Unit - 3
Definition of pure substance
Pure substance
A pure substance is one that has a consistent chemical composition throughout. Examples include water, helium, carbon dioxide, and nitrogen. It does not have to be a single chemical element if it is uniform throughout, such as air. A mixture of phases of two or more substances, such as ice and water (solid and liquid) or water and steam, can still be a pure substance if it is homogeneous (liquid and gas).
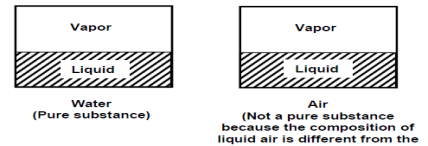
Phases & Properties of a pure substance
There are three basic phases: solid, liquid, and gas, but a substance can have multiple phases within the basic phase. Solid carbon (diamond and graphite) and iron (three solid phases) are two examples. Nonetheless, thermodynamics only deals with the primary phases.
• Solids have the strongest molecular bonds
• Solids are densely packed three-dimensional crystals.
• Their molecules do not move relative to one another.
• The molecular spacing of liquids is comparable to that of solids, but their molecules can float in groups.
• Within the groups, there is molecular order.
• Molecular bond strength is the weakest.
• Molecules in the gas phases are dispersed and lack an ordered structure.
• The molecules move erratically and collide with one another.
• Because their molecules have a higher energy level, they must release a lot of energy to condense or freeze.
An ideal gas is a theoretical gas made up of a collection of randomly moving point particles that only interact via elastic collisions. The ideal gas concept is useful because it obeys the ideal gas law, which is a simplified equation of state, and is amenable to statistical mechanics analysis.
Most real gases behave qualitatively like ideal gases under normal ambient conditions such as standard temperature and pressure. In general, deviation from an ideal gas tends to decrease with higher temperature and lower density, as the work performed by intermolecular forces becomes less significant when compared to the kinetic energy of the particles, and the size of the molecules becomes less significant when compared to the size of the molecules.

An ideal gas follows this equation.
Equation Table for an Ideal Gas
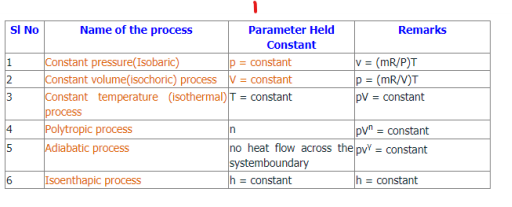
Real gas effects, as opposed to Perfect or Ideal Gas effects, refer to an assumption base that takes the following into account:
•Compressibility effects
•Variable heat capacity
•Van der Waals forces
•Non-equilibrium thermodynamic effects
•Issues with molecular dissociation and elementary reactions with variable composition.
For most applications, such a thorough examination is "overkill," and the ideal gas approximation is used. Real-gas models must be used near the condensation point of gases, near the critical point, at extremely high pressures, and in a variety of other unusual situations.
The term "real gas" usually refers to a gas that does not act as an ideal gas. The behavior of gaseous molecules can be explained by their interactions. Such intermolecular interactions between gas particles explain why the ideal gas law does not apply to actual gases. A real gas may thus be defined as a non-ideal gas containing molecules that occupy a certain amount of space and can interact with one another.
The Dutch scientist Johannes van der Waals amended the ideal gas law to describe the behavior of actual gases by explicitly incorporating the effects of molecule size and intermolecular interactions. The actual gas equation of Van der Waal is provided here.
Real gas law equation,

Where a and b represent the empirical constant which is unique for each gas.
 represents the concentration of gas.
P represents pressure
R represents a universal gas constant and T is the temperature
Daltons Law of partial pressure
In a homogeneous mixture of inert gases, having temperature T, Pressure P, Volume V. Where n = number of moles
Then,


So, P1 + P2+ P3+………+Pc = P
In certain gases, the compressibility factor Z is a function of P & T. On the coordinates of P & Z when the plot of constant Temp is made.
From this plot P & Z can be found out, on the other hand V is calculated from 
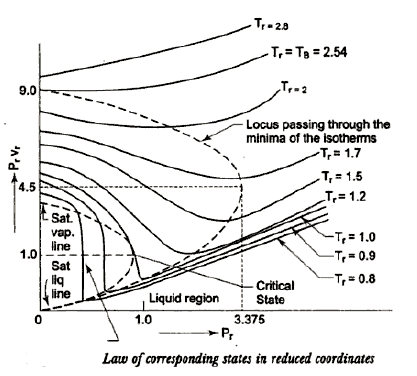
For each substance there is a compressibility factor chart. The shapes of vapor dome and of the constant temperature lines on the P-V planes are similar for all substances. But remember scales are different. This is exploited by using dimensionless properties also known as reduced properties.
 ,
, 
r = reduced state & c = Critical state
The relation between this reduced state is known as Law of corresponding states.
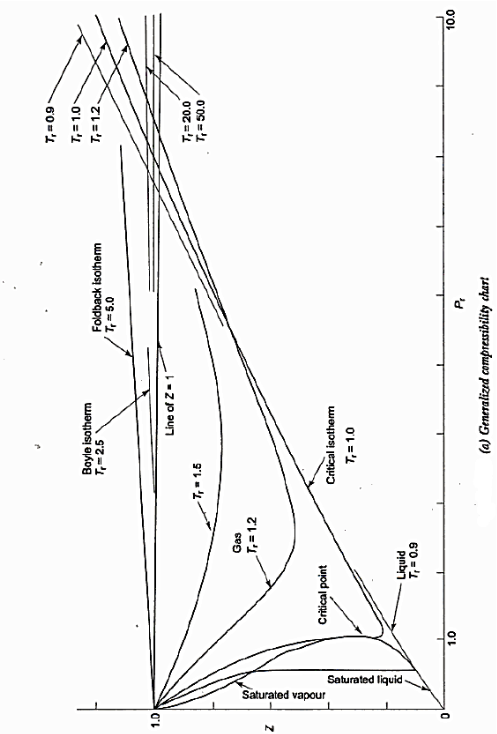
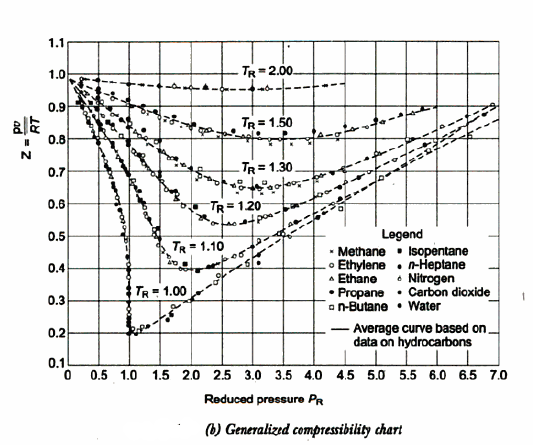
The transformation of ice to water and water to steam is referred to as phase transformation. It takes place at a constant temperature and a constant pressure.
- Sub-cooled ice:
Sub-cooled ice is ice that has a temperature lower than its freezing point of 0°C. As a result, ice at -6°C, -13°C, and -29°C will be sub-cooled ice. As a result, ice at -6°C will have 6 degrees of sub-cooling.
- Super-heated steam:
Superheated steam is steam that has a temperature higher than its boiling point at a given pressure. Superheated steam has a temperature of 112 degrees Celsius and a pressure of one atmosphere.
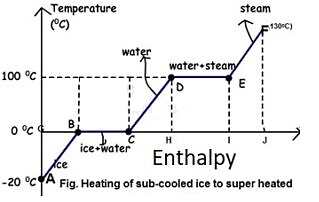
Figure: Phase Transformation of water
From A to F, subcooled ice is heated to superheated steam.
- Process A-B
Sensible heating of sub-cooled ice from -20 to 0 degrees Celsius. Ice is -20 degrees Celsius at point A and 0 degrees Celsius at point B, but there is no phase change.
- Sub cooled liquid
A sub-cooled solid is any substance that is at a temperature lower than its freezing point. Sensible heat gained during the AB process.
- Process B-C
At 0 degrees Celsius, ice melts. It only involves latent heat.
- Dry solid
A saturated solid is a solid that is at its freezing temperature and pressure. Ice at 0°C is a dry solid at point B.
- Wet solid
A Wet Solid is any solid that is frozen and liquid at the same time. As a result, the transition from point B to point C is a phase change process. Remember that a phase change process always occurs at constant temperature and pressure. As a result, it is both an isothermal and an isobaric process. Process C-D
Water can be heated safely from 0°C to 100°C.
- Sub cooled liquid
A sub-cooled liquid is any liquid that has a temperature lower than its boiling point at a given pressure.
Example: water at 13C or below 100C at 1atm pressure will be sub-cooled water. Water at 112C at 2atm will also be sub-cooled water because boiling point at 2 atm is.
- Saturated liquid
Any liquid that has reached its boiling point at a given pressure is said to be saturated. Water, for example, has a boiling point of 120 degrees Celsius at 2 atmospheres of pressure. As a result, water at 120 degrees Celsius and 2 atmospheres of pressure is saturated water.
- Process D-E
Water begins to change into steam vapour at 100C after further heating at point D, and vapour formation is complete at point E at 100C. Temperature and pressure remain constant during phase change. As a result, phase change is both isothermal and isobaric
- Dry Saturated Vapour
Dry saturated vapour is any vapour that has reached its boiling point at a given pressure but contains no liquid. As a result, water vapour at point E at 100 degrees Celsius will be a dry saturated vapour. There should be no liquid present alongside the vapour.
- Process E-F
Further heating at constant pressure raises the temperature of the steam to, say, 130 degrees Celsius. Superheated steam is 130 degrees Celsius at 1 atmosphere pressure.
- Super-heated vapour
Superheated vapour is vapour that has a temperature higher than its boiling temperature at a certain pressure.
- Degree of superheat
The difference between a vapor's actual temperature and its boiling temperature at a given pressure. Thus, at 1 atm pressure, the degree of super heat is 30 when vapour is at 130C, and at 2 atm pressure, when vapour is at 139C, the degree of super heat is 19 (139-120=19).
P-T Diagram
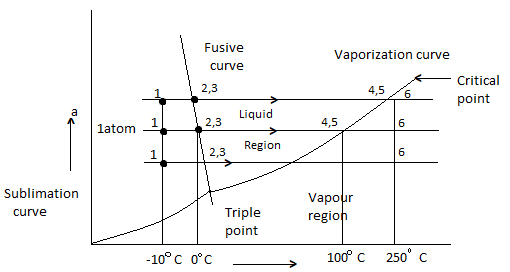
Phase Equilibrium diagram on P-T coordinates
Heating of ice at 0 C to steam at 250 C at constant pressure of 1 atm is considered.
- 1-2 Solid (Ice) = Heating
- 2-3 melting of ice at 0 C
- 3-4 is liquid heating
- 4-5 is vaporization of water at 100 C
- 5-6 is vapour state
- Process will be reversed from 6 -1 upon cooling
- Fusion curve passes through point 2,3
- Vaporization curve passes through 4,5 (indicating Vaporization or condensation at diff temperature and pressure)
- Sublimation curve is obtained if vapour pressure of solid is measured at diff temp.
- Fusion, Sublimation, Vaporization curve meet at triple point.
- Slope of Sublimation, Vaporization for all substance is + ve
- Slope of Fusion curve for most is + Ve, but for Water is – Ve.
- Liquid boiling temp is very sensitive to pressure, which is indicated by Vaporization curve, which gives saturation temperature at diff Pressure.
- Temp at which a solid melt is not much sensitive to Pressure as indicated by slope of fusion curve.
P-V Diagram
If we consider the pressure-cylinder device, but with some weights above the piston, removing the weights one at a time to decrease the pressure and allowing heat transfer to obtain an isothermal process, we will obtain one of the P-v diagram curves.
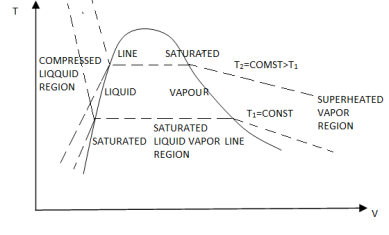
P-V Diagram
The solid phase, solid liquid, and solid-vapor saturation regions can be added to the P-v diagram. Because some substances, such as water, expand when they freeze, while the rest (the majority) contract during the freezing process, the P-v diagram with solid phase has two configurations.
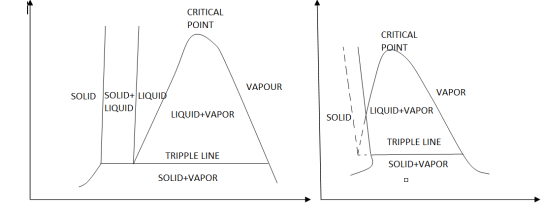
P-v diagram for a substance that contracts during freezing (left) and for a substance that expends during freezing (right).
Triple point
In thermodynamics, a substance's triple point is the temperature and pressure at which its three phases (gas, liquid, and solid) coexist in thermodynamic equilibrium. It is the temperature and pressure at which the sublimation, fusion, and vaporisation curves intersect.
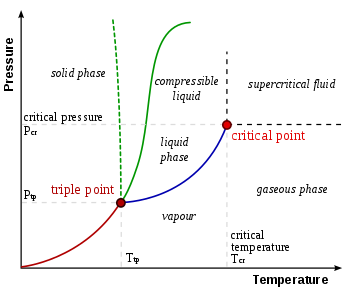
Phase Diagram (P-T) & Triple Point
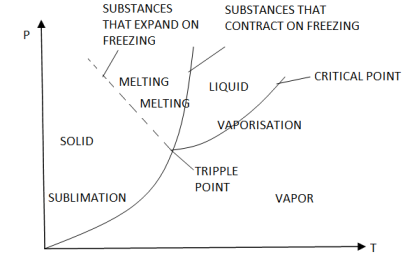
Phase Diagram (P-T) & Triple Point
The P-T diagram is often called the phase diagram since all three phases are separated by three lines.
- Solid - vapor sublimation
- Solid - liquid melting
- Liquid - vapor vaporization
Critical point
In physics, a critical point is a set of conditions under which a liquid and its vapour become identical. The critical temperature, critical pressure, and critical density are the conditions that define the critical point for each substance.
Example: The critical conditions can be met by filling a closed vessel with a pure substance that is partly liquid and partly vapour, so that the average density equals the critical density. The vapour pressure rises as the temperature rises, and the gas phase becomes denser. The liquid expands and becomes less dense until, at the critical point, the densities of the liquid and vapour become equal, eradicating the phase boundary. If the starting average density is too low, all of the liquid will evaporate before the critical temperature is reached. If the initial average density of the liquid is too high, it will expand to fill the container.
Saturation states
The term saturation in thermodynamics refers to a condition in which a mixture of vapour and liquid can coexist at a given temperature and pressure. The saturation temperature or boiling point is the temperature at which vaporisation (boiling) begins for a given pressure. The saturation pressure is the pressure at which vaporisation (boiling) begins for a given temperature.
When the vapour quality is equal to zero, the state is known as the saturated liquid state (single-phase). When the vapour quality is equal to one, the state is known as the saturated vapour state or dry steam (single-phase). We call the transition between these two states a vapor-liquid mixture or wet steam (two-phase mixture). At constant pressure, adding energy does not change the temperature of the mixture, but it does change the vapour quality and specific volume.
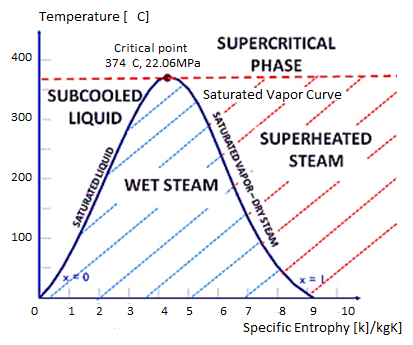
T-S Diagram
Sub- cooled liquid state
If the temperature of the liquid is less than the saturation temperature for the current pressure, it is referred to as a subcooled liquid or a compressed liquid.
A saturated liquid state exists when water exists as a liquid at saturation temperature and pressure with quality x = 0. (single-phase). If the temperature of the liquid is lower than the saturation temperature for the existing pressure, it is referred to as a compressed liquid or a subcooled liquid. Subcooling refers to a liquid that exists at a temperature lower than its normal boiling point.
Example: Water, for example, normally boils at 100°C (at atmospheric pressure); at 20°C, the water is referred to as “subcooled.”
Superheated vapour state
At saturation temperature, steam exists entirely as vapour and is referred to as saturated vapour, saturated steam, or dry steam. The dry saturated vapour is distinguished by a vapour quality equal to unity. Superheated vapour, also known as superheated steam, is a vapour that is hotter than its boiling point at the absolute pressure at which the temperature is measured. Because the temperature can rise while the pressure remains constant, the pressure and temperature of superheated vapour are independent properties. In reality, what we call gases are highly superheated vapours.
Phase – Change Processes of Pure Substances
It is critical to consider the liquid to solid phase change process at this point. Not so much solid to liquid because thermodynamics only deals with liquid to gas (or vice versa) conversion to generate energy.
Consider water in a piston-cylinder device at room temperature (20°C) and normal atmospheric pressure (1 atm). Water is in the liquid phase, and it is referred to as compressed liquid or sub cooled liquid (not about to vaporize).
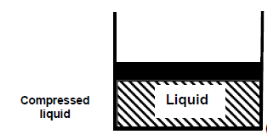
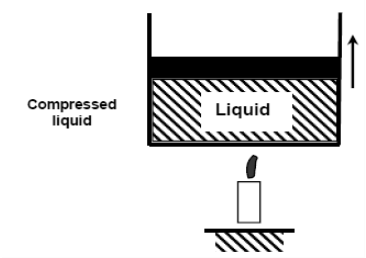
When we add heat to water, its temperature rises until it reaches 50°C. The specific volume v will increase as the temperature rises. As a result, the piston will move slightly upward, maintaining constant pressure (1 atm).
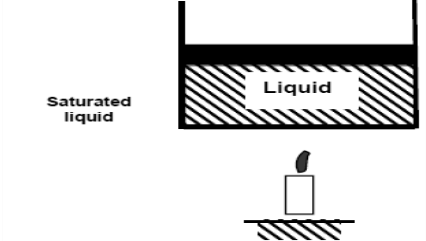
If we continue to add heat to the water, the temperature will rise until it reaches 100°C. Any additional heat will vaporise some water at this point. The point at which water begins to vaporise is referred to as saturated liquid.
As we continue to heat water, more vapour is produced while the temperature and pressure remain constant (T = 100°C and P = 1 atm). The only property that varies is the volume. These conditions will not change until the last drop of liquid has been vaporised. At this point, the cylinder is filled with vapour at 100°C. This is referred to as saturated vapour.
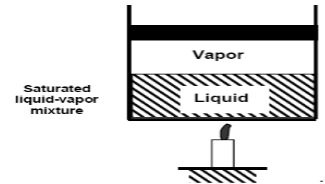
The state where two phases exist between saturated liquid (only liquid) and saturated vapour (only vapour) is known as a saturated liquid-vapor mixture.
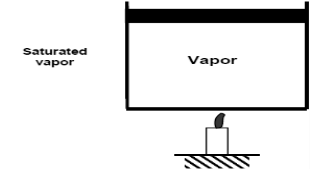
Saturated vapour phase on further addition of heat becomes superheated vapor.
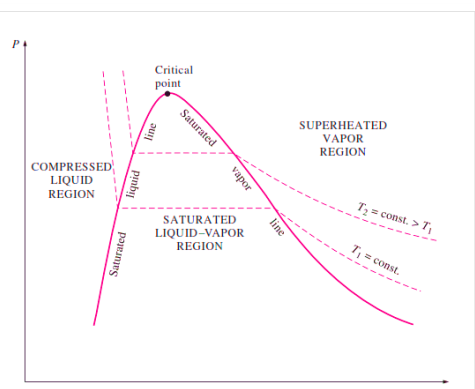
P-V Diagram of Pure Substance
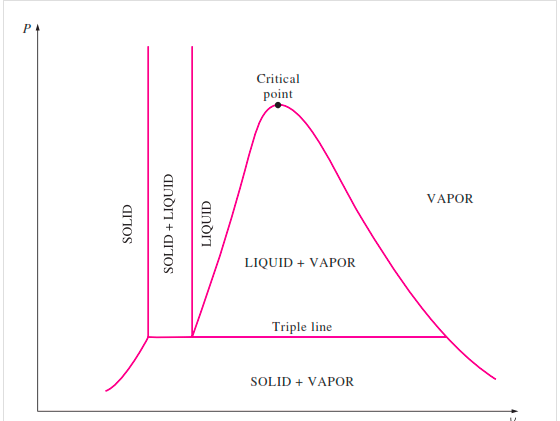
P-V Diagram of substance that Contracts on Freezing
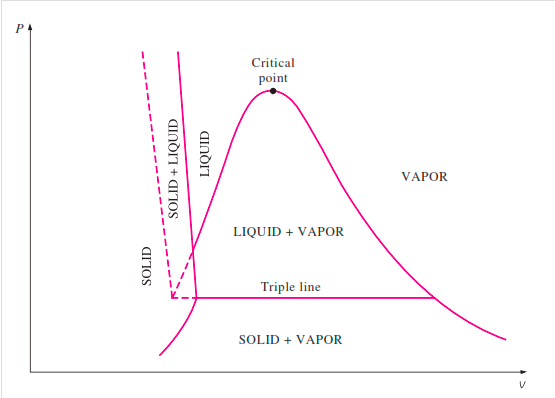
P-V Diagram of substance that expands on freezing (Water)
This concept is applicable to pure substances other than water. A pure substance is one that has a consistent chemical composition throughout. Examples include water, helium, carbon dioxide, and nitrogen. It does not have to be a single chemical element if it is uniform throughout, such as air. (Liquid and gas). A mixture of phases of two or more substances, such as ice and water (solid and liquid) or water and steam, can still be a pure substance if it is homogeneous.
When the pressure in the piston-cylinder device is increased, the process from compressed liquid to superheated vapour follows a path like the process for P = 1 atm, with the only difference being that the width of the mixture region is reduced.
The mixture region will then be represented by only one point at a given pressure. This is referred to as the critical point. It is defined as the point where the saturated liquid and saturated vapour states are the same.
The properties of a substance at the critical point are referred to as critical properties (critical temperature (Tcr), critical pressure (Pcr), and critical specific volume (Vcr)).
If we connect all the points representing saturated liquid, we will obtain the saturated liquid line.
If we connect all the points representing saturated vapor we will obtain the saturated vapor line.
The intersection of the two lines is the critical point.
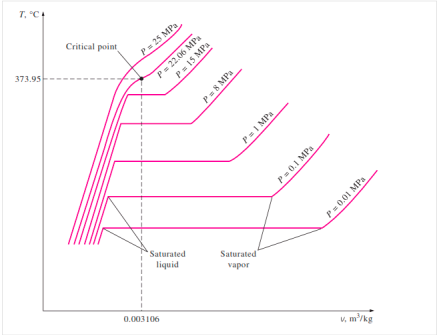
T-V Diagram of constant pressure phase change process of a pure Substance
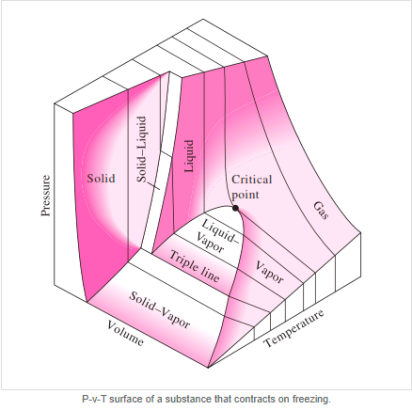
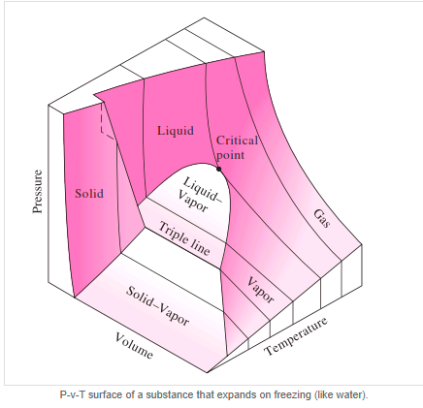
Key Takeaway:
- Water is in the liquid phase, and it is referred to as compressed liquid or sub cooled liquid (not about to vaporize).
- The point at which water begins to vaporise is referred to as saturated liquid.
- Saturated vapour
- The state where two phases exist between saturated liquid (only liquid) and saturated vapour (only vapour) is known as a saturated liquid-vapor mixture.
- Saturated vapour phase on further addition of heat becomes superheated vapor.
- The properties of a substance at the critical point are referred to as critical properties (critical temperature (Tcr), critical pressure (Pcr), and critical specific volume (Vcr)).
T-S Diagram
T-S Diagram is general used to analyse energy transfer systems as work done on or by the system including head addiction and removal can be visualized on T-S diagram.
It exhibits the same features as P-U diagram. Water & steam exists together in Liquid-Vapour region.
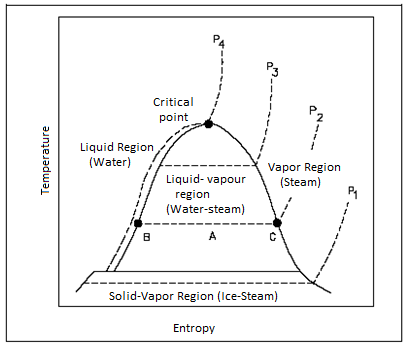
T-S for Water
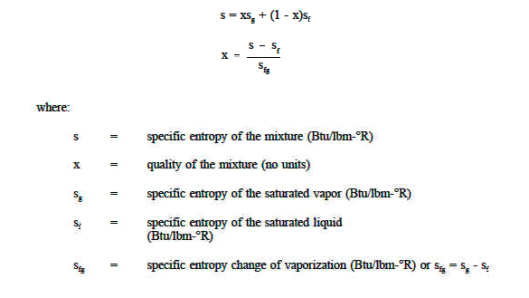
Water properties are organised in steam tables as functions of pressure and temperature. Separate tables are provided to show the properties of water in its various saturation states, as well as in its liquid and vapour phases. At the triple point (t = 0.01°C), the internal energy of saturated water is arbitrarily set to zero. Due to the small value of the (pv) term in h = u + pv, the enthalpy of saturated water at 0.0 I °C is slightly positive. At the triple point, the entropy of saturated water is also chosen to be zero.
- Saturation States
When a liquid and its vapour are in equilibrium at a specific pressure and temperature, only the pressure or temperature is required to determine the saturation state. If the pressure is given, the temperature of the mixture, known as the saturation temperature, is fixed; if the temperature is given, the saturation pressure is fixed. The saturated liquid or saturated vapour has only one independent variable, which means that only one property must be known in order to fix the state.
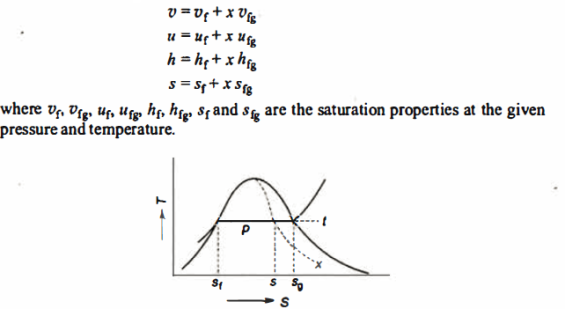
At a given temperature P, Vf, Vg, Hf, Hfg, Hg, Sf, Sg are given.
f = saturated liquid
g = saturated vapour state
Fg = change in property during evaporation or condensation
- Liquid vapour mixtures
Consider an equilibrium mixture of saturated liquid water and water vapour at pressure p and temperature t. The mixture's mass composition will be given by its quality x, and its state will be within the vapour dome.
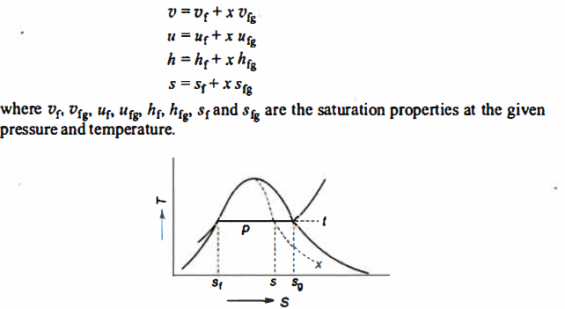
If p or t and the mixture's quality are given, the properties of the mixture (v, u, h, ands) can be calculated using the above equations. Instead of quality, one of the above properties, such as specific volume v and pressure or temperature, is sometimes given. In that case, the quality of the mixture x must be calculated from the given v and p or t, and then other properties are evaluated once x is known.
- Superheated Vapour
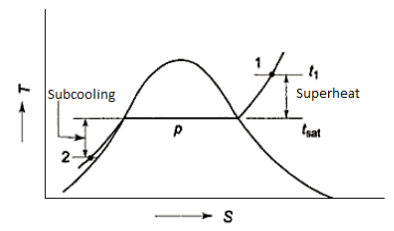
When the temperature of a vapour exceeds the saturation temperature for the given pressure, the vapour is said to be superheated. The superheat or degree of superheat is the difference in temperature between the superheated vapour and the saturation temperature at that pressure. At a given pressure, the temperature in a superheated vapour can have a range of values greater than the saturation temperature.
The values of superheated vapour properties (volume, enthalpy, and entropy) for each tabulated pair of pressure and temperature values, both of which are now independent for pressure and temperature pairs that are not given, interpolation or extrapolation should be used.
- Compressed liquid
When the temperature of a liquid is less than the saturation temperature at the given pressure, the liquid is said to be compressed. P and T can vary independently.
The properties of a superheated vapour table can be arranged to provide the properties at any P and T.
The liquid's properties vary very little with P. Subcooling occurs when a liquid is cooled below its saturation temperature at a given pressure. The difference between saturation and actual liquid temperature is referred to as the degree of subcooling
P-h diagram
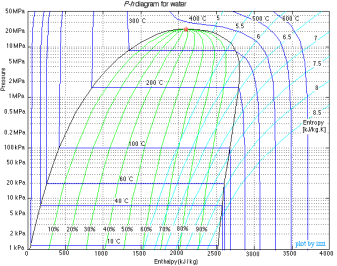
P-h Diagram of Water
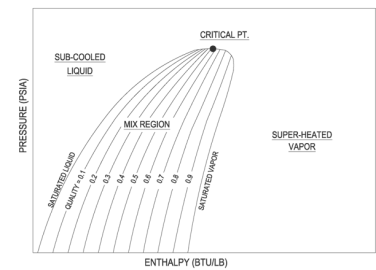
A p-h diagram is a graph that has a vertical axis for absolute pressure and a horizontal axis for specific enthalpy. It is an important diagram that is frequently used for calculating the performance of a refrigerating machine.
For each refrigerant specified, a p-h diagram is created. Of course, it cannot be used for another refrigerant. Diagrams are created for both the conventional unit and the SI unit.
A p-h diagram contains many thin lines, the names, and natures of which are important.
Key Takeaway
T-S Diagram is general used to analyse energy transfer systems as work done on or by the system including head addiction and removal can be visualized on T-S diagram.
A p-h diagram is a graph that has a vertical axis for absolute pressure and a horizontal axis for specific enthalpy. It is an important diagram that is frequently used for calculating the performance of a refrigerating machine.
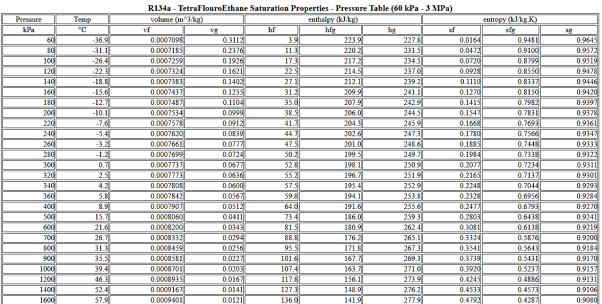
The saturation tables contain properties only along the saturation curve (x = 0 and x = 1) and no property values of liquid-vapor mixtures. These mixture properties must be calculated from the saturation values and the quality using Equations.
A saturated steam table is a must-have tool for every engineer who works with steam. It's commonly used to calculate saturated steam temperature from steam pressure, or vice versa: pressure from saturated steam temperature. These tables often include additional associated parameters such as specific enthalpy (h) and specific volume in addition to pressure and temperature (v).
A saturated steam table's data always relates to steam at a certain saturation point, also known as the boiling point. This is the temperature and pressure at which water (liquid) and steam (gas) may coexist. Because H2O can be either liquid or gas at saturation, two sets of data are required: data for saturated water (liquid), which is commonly denoted by a "f" in subscript, and data for saturated steam (gas), which is denoted by a "g" in subscript.
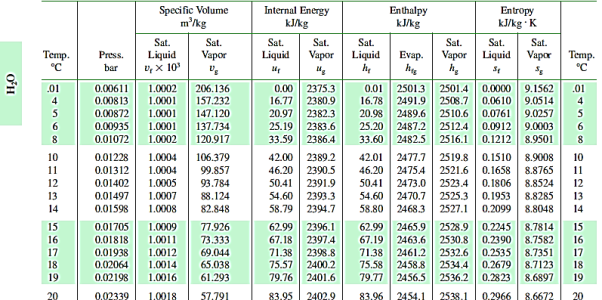
It comes in two Formats: Pressure Based and Temperature Based
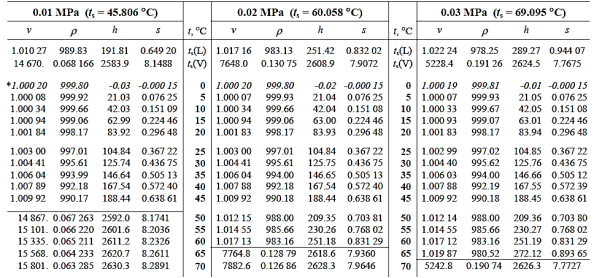
Superheated steam values cannot be acquired using a conventional saturated steam table but must instead be obtained using a Superheated Steam Table. This is since, unlike saturated steam, the temperature of superheated steam may vary significantly at the same pressure.
In fact, the number of conceivable temperature-pressure combinations is so large that compiling them all into a single table would be nearly impossible. As a result, many superheated steam tables employ typical pressure-temperature data to create a summary table.
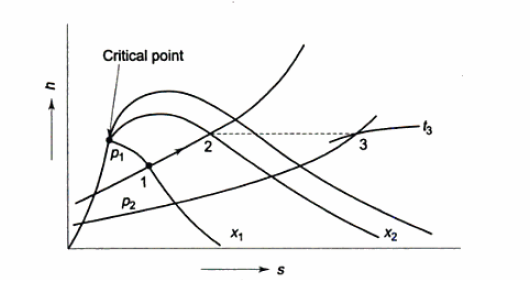
The dryness fraction of wet steam, which represents the fraction of steam in the water-steam mixture, can be measured using a throttling calorimeter and a Separating and throttling calorimeter.
Throttling calorimeter:
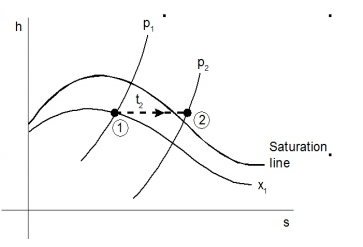
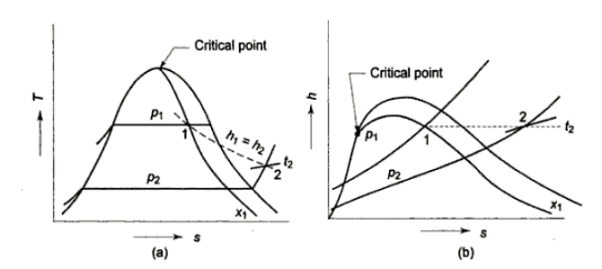
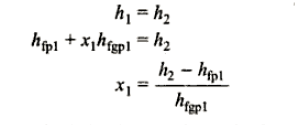
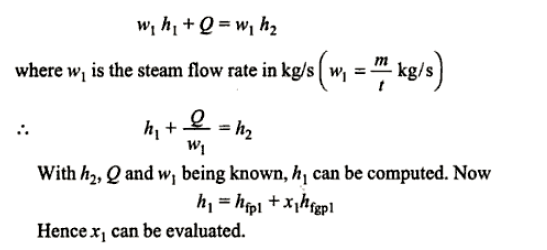
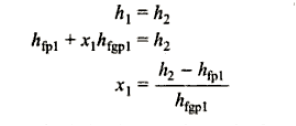
Consider wet steam, which is represented by state 1 in the h-s diagram. It enters the superheated region after undergoing a throttling process to state 2. The specific enthalpy can be calculated by measuring the temperature and pressure after throttling. As previously stated, enthalpy remains constant during throttling. Because the pressure before throttling and the corresponding specific enthalpy are known, the initial state can be completely fixed.
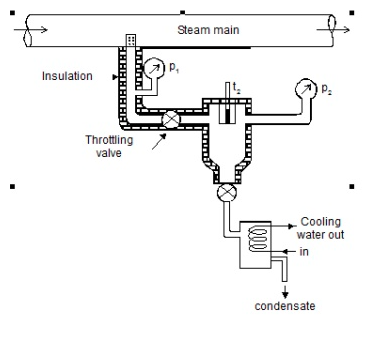
As shown in the figure, steam is extracted from the main via a perforated tube projecting into it. The pressure of steam is measured. It is then throttled into a chamber where pressure and temperature readings are taken. The expanded steam is then discharged from the chamber after being condensed by circulating cooling water.
Separating and throttling calorimeter:
When the dryness fraction of the steam is very low, throttling produces superheated vapour only at very low-end pressure. In general, the pressure after throttling for measuring dryness fractions should be higher than atmospheric. In such cases, separating and throttling calorimeters are used to measure the dryness fraction.
When wet steam undergoes a sudden change in flow direction, a portion of the liquid falls due to gravity and separates from the mainstream. As a result, the remaining steam becomes rich in vapour and, when throttled, becomes superheated vapour even at pressures higher than atmospheric pressure. This principle is used in calorimeters for separating and throttling.
Wet steam from the steam main is extracted via a perforated tube and directed to the separator, where a portion of the liquid is separated due to a sudden change in direction. The remaining steam is directed into a chamber where pressure and temperature readings are taken. The mass flow rate of liquid separated in the separator is measured. The mass of the remaining steam is also measured by condensing and collecting the throttled steam. Let be the mass of liquid separated in the separator and mass of throttled steam.

Key Takeaway:

H-S Diagram or Mollier Diagram
From 1st & 2nd law combined we get

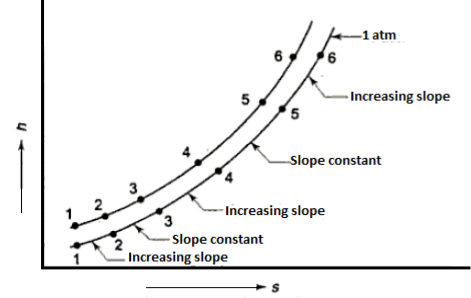
This equation serves as the foundation for the h-S diagram. Absolute temperature is given by the slope of an isobar on h-s. If the temperature is constant, the slope will also be constant.
As the pressure rises, so does the saturation temperature, and the slope of the isobar rises with it. As a result, constant pressure lines diverge. At the critical point, the critical isobar is tangent.
The states of equal slopes at constant pressures are joined in the vapour region by lines known as constant temperature lines.
Hf = specific enthalpy of saturated water
Hg = specific enthalpy of saturated vapour
Hfg = latent heat of vaporization at that pressure
Isobars on h-s plot
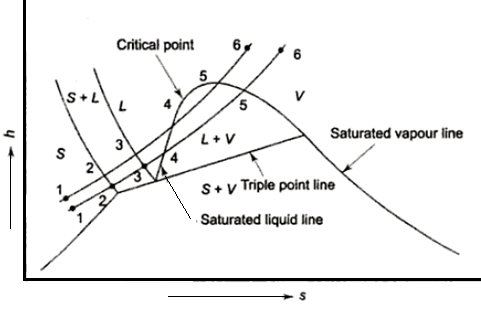
Phase equilibrium diagram
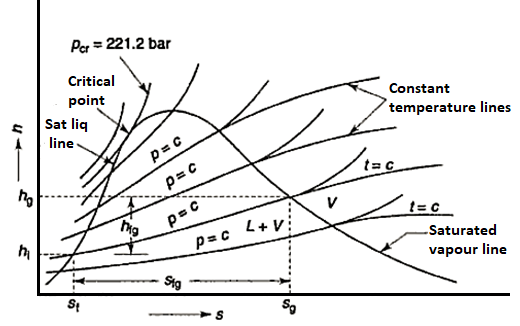
Enthalpy entropy diagram
Mollier chart
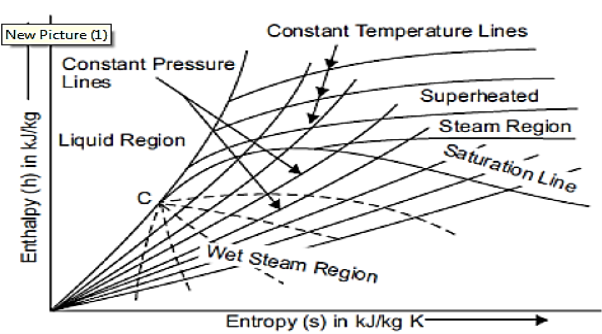
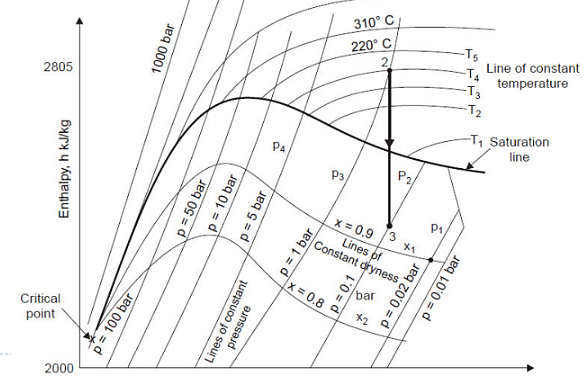
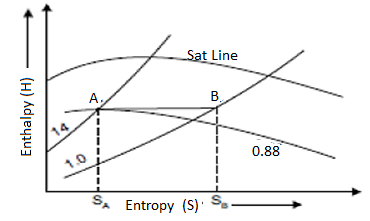
Mollier charts are graphical representations of steam tables, with enthalpy (h) plotted along the ordinate and entropy (s) plotted along the abscissa. To begin, the steam tables are used to calculate the enthalpy and entropy of water and dry saturated steam at any given pressure. These enthalpy and entropy values are plotted, and the liquid and dry saturated lines are obtained. Both of these lines intersect at C, the critical point depicted in the figure. At 221.2 bar, the critical point corresponds to the enthalpy of liquid and dry saturated steam.
The enthalpy-entropy chart, like the temperature entropy chart, is very useful in solving problems involving adiabatic or isentropic steam expansion and compression. In the actual diagram, the abscissa represents the entropy of 1 kg of water and steam, i.e., specific entropy above the freezing point of water, and the vertical ordinate represents the values of specific enthalpy, i.e., total heat.
A line called the saturation line divides the diagram into two parts. The upper region of the saturation line is known as the superheated region, where the temperature of steam rises at a given pressure, while the lower region of the saturation line is known as the wet region, where the temperature of steam remains constant at a given pressure.
The Mollier diagram has the following lines
1. Dryness fraction lines
2. Constant volume (i.e., specific volume) line
3. Constant pressure lines
4. Isothermal lines
5. Isentropic lines and
6. Throttling line
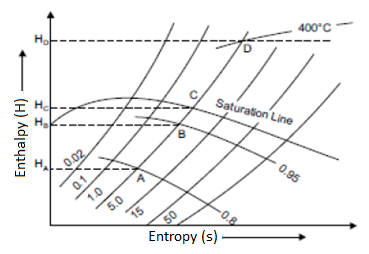
Constant Volume Line
In both the wet and superheated steam regions, constant volume lines are drawn. As shown in the figure, these lines are straight in the wet steam region but curved upwards above the saturation curve, i.e., superheated region. By the AB and CD parts of the line of constant volume.
Constant Pressure Line
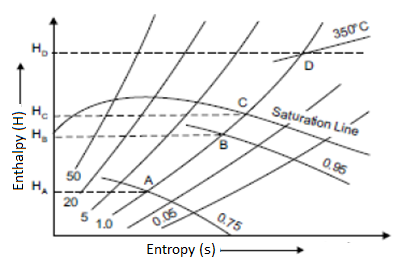
In both the upper and lower regions of the saturated steam line, constant pressure lines are drawn. These lines are straight in the wet region because the increase in enthalpy during vaporisation is directly proportional to the increase in quality, and thus to the increase in entropy. The figure depicts a curve that is closer to the wet region than the superheated region.
Isothermal Line
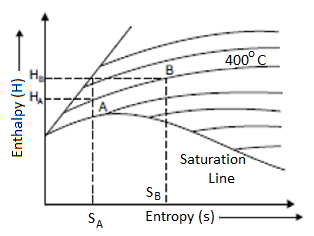
Only above the saturation line are isothermal lines or constant pressure lines drawn. These lines depict the state of superheated steam at various enthalpy and entropy values.
Isentropic Line on (H-S) Diagram
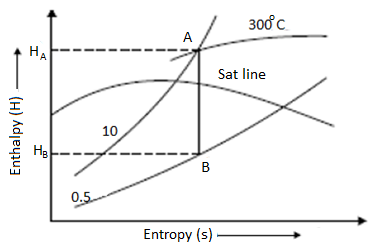
The isentropic process is a reversible adiabatic process. Entropy remains constant in this process. As a result, the isentropic line is parallel to the vertical axis by the line AB.
Throttling Lines on H-S Diagram
Enthalpy before throttling equals enthalpy after throttling in the throttling process, indicating that there is no change in enthalpy. As a result, enthalpy line AB will be parallel to the horizontal axis.
Key Takeaway:
References:
- Basic and Applied Thermodynamics by PK Nag, MCGRAW HILL INDIA.
- Thermodynamics for Engineers by Kroos & Potter, Cengage Learning.
- Thermodynamics by Shavit and Gutfinger, CRC Press.
- Thermodynamics- An Engineering Approach by Cengel, MCGRAW HILL INDIA.
- Basic Engineering Thermodynamics, Joel, Pearson.