Unit - 3
Properties of dry and wet air
Dry Air:
Air which does not contain any moisture is called Dry Air.
Properties of dry air:
- Specific heats
- Ratio of specific heats
- Dynamic viscosity
- Thermal conductivity
- Prandtl number
- Density
- Kinematic viscosity
- Thermal diffusivity of dry air vary at different temperatures and pressures.
Wet Air or Moist Air:
Air along with water vapour content, is called as Wet or Moist Air.
Properties of Wet Air:
Dry-Bulb Temperature:
Dry bulb temperature is measured with a normal thermometer.
Dew Point:
Dew point is the temperature at which water vapor begins to condense out of the air.
Wet-Bulb Temperature:
Wet bulb temperature is relatively easy to measure, but requires special equipment.
A normal thermometer is fixed to a rotating sling.
The bulb of the thermometer is covered with a wet wick of cotton.
The sling is rotated till the temperature reading is stabilized.
The air passes over the wet wick and cools down before reaching the bulb of the thermometer.
This temperature is called as wet bulb temperature.
Wet bulb temperature will never be higher than dry bulb temperature.
Wet bulb temperature is a critical parameter for sizing, and measuring the performance of evaporative-cooled cooling water systems.
Relative Humidity:
Relative humidity is the ratio (expressed as a percentage) of the amount of water vapor actually present in the air, to the maximum amount that the air could hold under that temperature and pressure.
Density:
Density is the total mass of moist air per unit volume.
All these above-mentioned properties of wet air can be easily found by using a psychrometric chart.
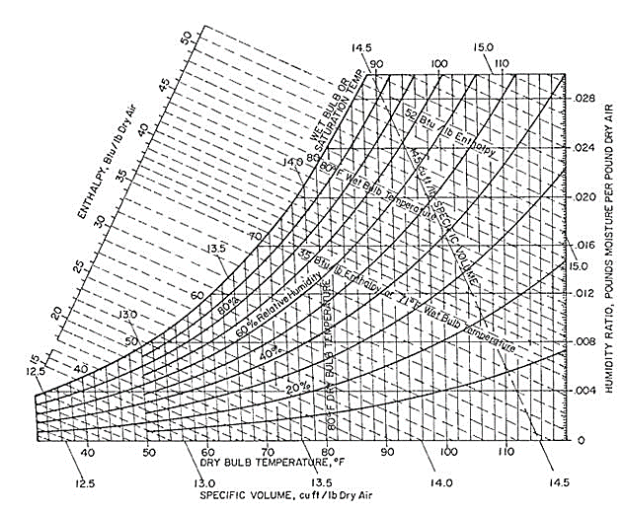
Though it may look complicated, once you understand the gist of it, it is very easy to use and very useful chart for the field of HVAC and RAC.
All the values represented in the chart are calculated at standard atmospheric pressure.
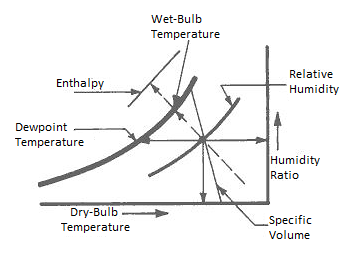
The horizontal line at the bottom represents the scale of Dry bulb temperature.
The vertical lines in the chart show the various Dry bulb temperatures.
Horizontal lines emanating from the extreme right vertical line represent the constant moisture values.
The diagonal lines emerging from the curve on the left side represent the Wet Bulb temperature lines.
Various Types of Psychrometric Processes
- Sensible heating:
Sensible heating refers to addition of heat at constant humidity, that is without any change in moisture content of air.
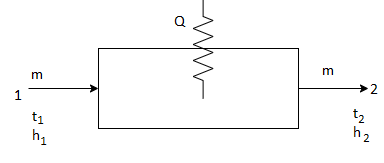
Q = m Cp ΔΤ
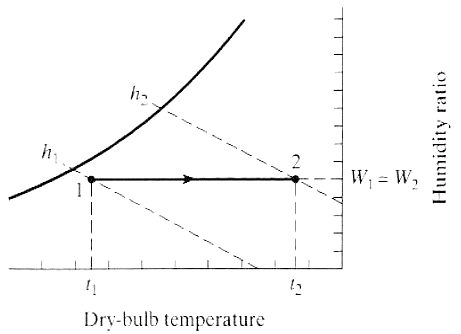
The process shown in the above figure shows the increase in temperature at constant humidity ratio (HR). There is increase in enthalpy of the system due to heat addition. The RH of the system increases.
2. Sensible Cooling:
Sensible cooling refers to removal of heat at constant humidity, that is without any change in moisture content of air.
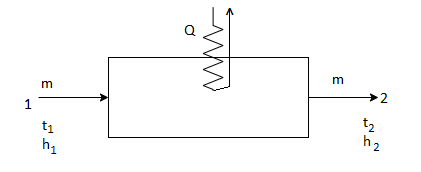
The process on the psychrometric chart would be exactly opposite to the first one, that is, it will follow the path 2-1. The enthalpy of the system would decrease at constant HR but decrease in RH.
3. Cooling and Dehumidification:
This process is removal of heat as well as moisture from the air. It involves removal of sensible as well as latent heat from the air.
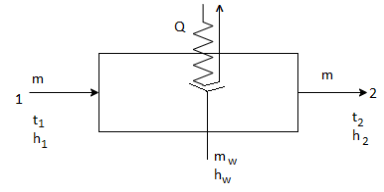

The above figure shows the dehumidifying cooling process.
Ideally the process should be combination of two stages.
In the first stage, the sensible heat is removed from the air till dew point temperature is reached.
In the second stage, the latent heat is removed from the air till the desired temperature is achieved.
But practically, the process takes place in a single process as shown in the graph.
4. Heating and Humidification:
This process is addition of heat as well as moisture to the air. It involves addition of sensible as well as latent heat to the air.
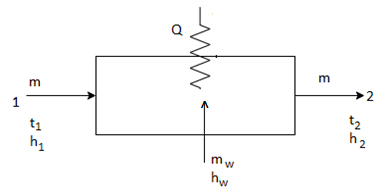

The above figure shows the humidifying heating process.
Ideally the process should be combination of two stages.
In the first stage, the latent heat is added to the air till the desired temperature is achieved.
In the second stage, the sensible heat is added to the air till dew point temperature is reached.
But practically, the process takes place in a single process as shown in the graph.
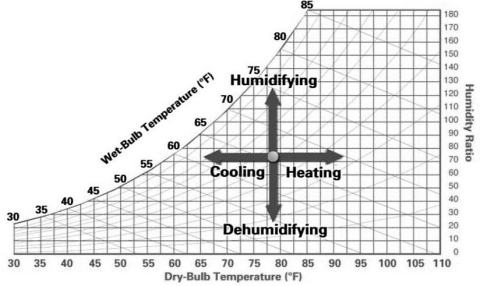
In short the above 4 processes can be summarized by figure below.
References:
1. Sonntag, R. E, Borgnakke, C. And Van Wylen, G. J., 2003, 6th Edition, Fundamentals of Thermodynamics, John Wiley and Sons.
2. Jones, J. B. And Duggan, R. E., 1996, Engineering Thermodynamics, Prentice-Hall of India
3. Moran, M. J. And Shapiro, H. N., 1999, Fundamentals of Engineering Thermodynamics, John Wiley and Sons.
4. Yunus A. Cengel; Michael A. Boles, Thermodynamics: An Engineering Approach, McGraw- Hill.
5. Nag, P.K, 1995, Engineering Thermodynamics, Tata McGraw-Hill Publishing Co. Ltd.