Unit 1
Introduction
The word statistics is derived from the Latin word “Status” that means a group of numbers that represent some information of our human interest. In ancient periods, the use of statistics was made to meet the administrative needs of the state. In modern time, the statistics is not only used for administrative of the state alone, also evaluate all those activities in our lives which can be expressed in quantitative terms.
The term “statistics” is defined in two senses: - in singular and in Plural senses.
Firstly, in plural sense, statistics means systematic collection of numerical facts. Secondly in singular sense, the term statistics means the various methods used for collection, analysis and interpretation of numerical facts. It is described as statistical method. In our study we are more concerned with the second meaning of statistics.
Definition
“Statistics is a body of methods for making wise decisions on the face of uncertainty.” —Wallis and Roberts
“Statistics is a body of methods for obtaining and analyzing numerical data in order to make better decisions in an uncertain world.” —Edward N. Dubois
Statistics are numerical statement of facts in any department of enquiry placed interrelation to each other.- Bouly.
The science of Statistics is essentially a branch of applied mathematics and can be regarded as a mathematics applied to observation data.- R.A fisher.
After analyzing the various definitions of statistics, the most proper definition of statistics are as follows:
“Statistics in the plural sense are numerical statements of facts capable of some meaningful analysis and interpretation, and in singular sense, it relates to the collection, classification, presentation and interpretation of numerical data.”
Statistics are numerical statements of facts capable of some meaningful analysis and interpretation, and in singular sense, it relates to the collection, classification, presentation and interpretation of numerical data. It is the science of data collection and analysis.
The nature of statistics can be enumerated as under:
i) Aggregate of facts: Statistics are aggregate of facts as the data collected are facts and figures gathered from various authentic sources and field survey. When the data collected are presented, they are presented in an understandable manner. A single figure like 40 years or 50 years is not statistics. It needs collection of facts and figures to be statistics.
Ii) Numerically expressed:The facts and figures collected are expressed numerically so that it can be measured. Qualitative descriptions don’t have any room in statistics.
Iii) Enumerated or Estimated:The data collected are estimated or enumerated where actual enumeration is not possible. In that case, facts are expressed in terms like ‘good’, ‘average’, ‘excellent’, etc.
Iv) Statistics are affected by a marked extent by multiplicity of causes:Statistics is affected by a number of causes in case of any field of enquiry. For example, In production statistics is affected by soil, climate, raw material, soil fertility and so on.
v) Collected on a systematic manner:The data collected in statistics are presented in a systematic manner after going through a series of procedures. The data collected is in a raw form. Hence it needs to be tabulated, organized, analyzed and then presented in an understandable form.
Vi) Pre determined purpose:The reason behind which statistics are used have a purpose or objective which is pre determined. Whenever a sort of problem is identified, the reason to investigate crops us. Data is collected and accordingly reason is determined.
Vii) Capable of being placed in relation to each other:The data collected in statistics should be comparable and connected with the same department as regards the inquiry. For example, heights and weights of students should be compared with the heights and weights of students in the same class.
Statistics has become indispensible in every area to day. There is hardly any field where statistics didn’t enter. Statistics is used right from the education till in aeronautical engineering. However, a few identified areas can be depicted as regards use of statistics:
- Statistics is used by Government, Banks, Financial Institutions in order to have knowledge about the economy, industrial performance and so on.
- In industry, statistics is used widely for quality control for the products manufactured.
- In education, statistics is so essential for the academicians for conducting research.
- In the field of Medical Science also Statistics plays an important role to test the efficiency of a new drug or medicine.
- In space research even statistics is used to conduct research and quality control.
- Importance for administrator administration – With the help of statistics, finance minister makes the use of revenue and expenditure data to prepare budget. Also, it helps in taking decision regarding taxes.
- Importance for businessman – statistics helps in providing relevant data. Thus, with the help of those data a business man can estimate demand and supply of the commodity.
- Importance in economics – statistics helps in measuring economics such as gross national output, consumption, saving, investment, expenditures, etc
- Importance for politician – Politician use statistics in formulating economic, social and educational policies of the country
- Importance in the field of education – statistics has wide application in education for determining the reliability and viability to a test, factor analysis, etc.
Limitation of statistics
- Study of numerical facts only – statistical method does not study quantitative phenomena such as honesty, wisdom, etc. So, experiments are done to measure the reaction of man through data.
- Study of aggregates only – statistics study only aggregates of quantitative facts. It does not study any particular unit.Prof. Horace Sacrist defined statistics, “By statistics we mean aggregates of facts…. And placed in relation to each other”
- It does not depict the entire story of phenomena – Any phenomena happen, due to many causes. But all the cause is not expressed in numbers. So, correct conclusion cannot be drawn. Analyzing quantitative data and ignoring qualitative data cannot give 100% conclusion.
- Homogeneity of data – To compare the data, it is essential that whatever statistics are collected, the same must be uniform in quality.
- It is liable to be miscued – As W.I. King points out, “One of the short-comings of statistics is that do not bear on their face the label of their quality.” Thus, the data collected by inexperienced person may be dishonest or biased. So, to get correct conclusion data must be used in caution.
- Too many methods to study a problem –to find a single result many statistical methods are used. All the methods result vary in each case. “It must not be assumed that the statistics is the only method to use in research, neither should this method of considered the best attack for the problem.” —Croxten and Cowden
- Expression of facts in numbers – One of the important function of statistics is to express facts in definite form i.e., in the form of numbers. The results expressed in definite form are more convincing than the result expressed on the basis of quality.
- Presentation of facts – Statistics helps in presenting the complex data in a simple form, so that it becomes easy to understand. Statistical methods present data in the form of graph, diagram, average, coefficient, etc.
- Comparison – After simplifying the data, it can be correlated and compared. Comparing data relating to fact is one of the functions of statistics as absolute figures convey less meaning.
- It helps other science- Many laws of economic, law of demand, law of supply have been verified with the help of statistics.
- Forecasting – Statistics also predicts future course of action. On the basis of estimates with the help of statistics we can make future policies.
- Policy making – Statistics helps in formulating favorable policies. Based on the forecast the government makes policies.
The authenticity of statistical report fully depends on the statistical investigator who collects and compiles the data. It on his discretion how much with integrity he has done the survey without room for biasness. Many statisticians present the facts with wrong data due to not maintaining integrity. Hence the validity and reliability of statistical data completely depends on the honesty of the statistical investigator. The person who is the statistician might be inexperienced, lack of knowledge or liar. Hence the data may be mishandled and the result would be disastrous. The statisticians should be expert and experienced which can help in producing relevant and authentic information. Just for instance, if in case of medicines which are meant for curing people, but if they are handled by inefficient persons, they may prove fatal to the patients.
We cannot say that the medicine is bad; it is the person who did handle the research and presented wrong reports.Similarly, if a child gets burnt, it’s not the child to blame but the person who was not careful in keeping hot bowl in proper place.
Misuse of statistics happens when a statistical argument prove false. Sometimes misuse happens accidently and sometimes it is done intentionally. The misuse can produce false result which can affect the solutions provided through statistical investigation for a defined problem.
The misuse of statistics can be in the form of:
- Manipulating Scale to change the appearance of the distribution of data.
- Eliminating high/low scores for more coherent presentation.
- Inappropriately focusing on certain variables to the exclusion of other variables.
- Presenting correlation as cohesion.
Statistical enquiry refers to statistical investigation where the statistical investigator requires taking the help of an investigator who with the help of enumerator which suppose to gather data. The respondents give information which is inputs to data collection. Statistical investigations test statements that may be true or false after evaluation. These statements are known as hypothesis. Before landing into investigation, the statistical investigator needs to do lot of planning for the statistical inquiry. There are certain preparations to be noted in statistical enquiry which may be as follows:
- Purpose of enquiry: This means why the investigation is necessary. The reason behind which the whole activity or process is going to be undertaken.
- Sources of data: Wherefrom the data is going to be collected, whether from published sources like journals, magazines, published statistical reports, websites, etc or from field survey.
- Methods of data collection: If it is for field survey, questionnaire can be used as a tool for collecting data. Questionnaire refers to prepared questions beforehand for the purpose of collecting data. The respondents will fill up the necessary questions and it becomes input for the survey.
- Nature and type of enquiry:The type of enquiry like explorative, descriptive should be decided in advance to have a proper guidance on the conduct of the investigation and the quality of questions to be framed for the questionnaire.
- Unit of Collection: The unit of data to be collected like height, weight, income in rupees, and so on needs to be decided in advance.
Primary data: -
Primary data is the information collected through original or firsthand research. Primary data is more reliable and authenticate as the data is nor changed or altered by any human beings. Also, the data is not published yet. Primary data is gathered by any authorized organization, investigator, and enumerator.
“Data which are gathered originally for a certain purpose are known as primary data.” — Horace Secrist
Sources of primary data
The sources of primary data are as follows
- Experiments: In natural sciences, experiments are most reliable source of data collections. Experiments are conducted for medicine, psychological studies, nutrition and other scientific studies. Experiments are conducted in the fields as well as laboratories. The results of experiments are analyzed by statistical test and thereafter conclusions are drawn.
2. Survey: surveys are used in social science, management, marketing and psychology to some extent. Surveys are conducted in different methods.
3. Questionnaire: Questionnaires consist of list of question either open ended or close ended for which the participants answer. Questionnaire can be conducted via telephone, mail, institute, fax, etc.
4. Interview: Interviews are expensive method of data collection. The interviewer collects information from each respondent independently. It involves in-depth questioning and follow up question. While taking interview, the interviewer can observe the body language and other reaction to the question.
5. Observation: observation can be conducted with or without knowledge of the participants. Observation can be made either natural or artificially created environment.
Advantages
- Date interpretation is better – Depending on the need of marketers, the data collected are examined and interpreted properly rather than relying on secondary data.
2. Efficient spending for information – Under primary research, the data collected specially for the purpose in mind. So, the research funds are used efficiently unlike secondary research where marketer spent for information that is not needed.
3. Proprietary issue – Information from primary research is their own and is not shared by any others. The information can be kept hidden from the competitors and also give added advantage from competitors who rely on secondary data.
4. Addresses specific research issue – Primary research helps the marketers in getting that information which they want to know and report it in ways that benefit them. While information from secondary research may not fit the need of marketers.
5. Greater control – Primary research not only focus on specific issue, it also enables the marketers to have greater control over the information collected. Such as location, time for completing project, etc.
Demerits
- High cost – primary research are very expensive compared to secondary research. It involves high expenses in preparing, designing and carrying out the research.
2. Time consuming – primary research starts from deciding to undertake a research project to the end point of having result is very time consuming compared to secondary research which can be collected in less time.
3. Inaccurate feedbacks – primary research involves taking feedback from target audience. There are high chances that feedback given is incorrect, as the audience can be biased or just give for sake of it.
4. More number of resources required – the data is collected from other resources like human resource, material which are needed in large quantity to do the survey. Also, the data are collected from skilled person only.
Secondary data
Secondary data are public information that has been collected by others. The data collected from primary research and used by other is referred as secondary data. The secondary data may be obtained from various sources like industry surveys, database and information system, etc.
“The data which are used in an investigation, but which have been gathered originally by someone else for some other purpose are known as secondary data.” — Blair
Sources of secondary data
- Government statistics – government statistics are widely available and easily accessible online. It provide information regarding trade activity, pricing and economic trends, business information, patents, population statistics, heath record, etc
- Books – books are available on any topic you want to research. Books provide insight on how much information is given for a particular topic and you can prepare your literature review.
- Journals – journals provide up to date information on the very specific topic on which you want to research. Journal is one of the most important sources for providing the information on data collected.
- Magazine or newspaper – Newspaper or magazine provide daily information regarding politics, business, sports, fashion, etc which can be used for conducting research.
- Internet – internet is becoming advance, fast and reachable to the masses and much information is available on internet. Almost all journals, books are available on internet. Some are free and others you have to pay price
- Company website – companies website provide lots of information. They have a section called investor relations which contains full of annual reports, regulatory findings and investor presentations that can provide insights into both the individual company’s performance and that of the industry at large.
Advantages
- Ease of access – Secondary research is easily available. In past secondary data was available in libraries or wait for the reports to be shipped. Currently, the data are available online and can be accessed any time.
- Low cost to acquire – the researcher can get information at very low cost compared to carrying out research themselves. Time and money is saved in secondary data.
- Clarification of research question – The use of secondary data helps in clarifying the research question. Sometimes secondary researches are done prior to primary research to clarify the research focus.
- Difficulties in conducting primary research – sometimes primary research are difficult to be conducted due to time, cost, etc. Thus, secondary data are used to carry out the research and accordingly the results are drawn.
Disadvantages
- Quality of research – primary researches are conducted and controlled by the researcher. Thus, it ensures the validity of the information. While secondary researches are conducted by others. Thus, the viability and reliability of the secondary data are questionable.
- Not specific to researcher needs – in many cases, secondary research do not meet the researcher’s needs. While primary research gets information the way researcher wants.
- Incomplete information – In many cases, researcher provide few information. To get the full version of the report they charge expensive fees.
- Not timely – while using secondary research, the researcher should check the date of information. Sometimes out of date reports are available which is not relevant to the current market situations.
The data collected with the help of statistical tools are in raw form. It needs to be given a proper shape before it can be presented. Or else data presented in raw form won’t be able to clarify the users. Hence it needs to be edited and organized. Organization can be done with the help of classification and tabulation.
Classification of data is the process of arranging the data into homogenous groups according to their common characteristics. Raw data cannot be easily understood and not fit for analysis and interpretation. Therefore, arrangement of data helps the user in comparison and analysis.
Example- population of a state can be grouped according to sex, age, etc
Definition
“Classification is the process of arranging data into sequences according to their common characteristics or separating them into different related parts.” - Prof. Secrist
Objectives of data classification
- To consolidate the huge data in such a way that similarities and differences are easily understood.
- It helps in comparison and analysis of data
- Classification of data ensures prominent data are collected and optional data are separated
- To allow a statistical method of the material gathered.
- To study relationships
Types of classification
- Geographical classification – when the data classified according to the geographical location or regions (like states, cities, regions, zones, areas, etc). It is called geographical classification. It is also known as a real or spatial classification.
Ex- production of food grains are classified in different states in India
S.No | Name of states | Total food grains (000’ tones) |
1 | Andhra Pradesh | 1093.00 |
2 | Bihar | 12899.09 |
3 | Karnataka | 1834.70 |
4 | Punjab | 41289.00 |
5 | Orissa | 3600 |
2. Chronological classification – classification of data on the basis of time (like months, years, etc) of their occurrence are called chronological classification. This type of classification is suitable for data which takes place in course of time such as population, production, sales, etc.
Ex – profit of a company from 2001 to 2005
S.No | Year | Profits (in 000 Rs) |
1 | 2001 | 77 |
2 | 2002 | 88 |
3 | 2003 | 89 |
4 | 2004 | 94 |
5 | 2005 | 99 |
3. Qualitative classification – under this classification, the data are classified on the basis of some attributes or quality such as sex, color, literacy, honesty, intelligence, religion, etc. In this the attributes cannot be measured. This sort of classification is known as descriptive classification.
For example, Population can be divided on the basis of marital status as married or unmarried etc.
4. Quantitative classification – quantitative classification states that classification of data according to some characteristics that can be measured such as height, weight, income, sales, profit, etc.
Ex – students are classified according to weights
S.No | Weight | No. Of students |
1 | 30-40 | 77 |
2 | 40-50 | 60 |
3 | 50-60 | 50 |
4 | 60 - 70 | 20 |
5. Alphabetical classification – when data are arranged according to alphabetical order is called alphabetical classification
Ex – state wise classification of population in alphabetical order
S.No | Name of states | Population |
1 | Andhra Pradesh | 157 |
2 | Bihar | 150 |
3 | Karnataka | 200 |
4 | Punjab | 700 |
5 | Orissa | 450 |
Tabulation is a systematic & logical presentation of numeric data in rows and columns, to facilitate comparison and statistical analysis. The method of placing organized data in tabular form is known as tabulation. Tabulation simplifies complex data and facilitates comparison.
Definition
“Table involves the orderly and systematic presentation of numerical data in a form designed to elucidate the problem under consideration” – According prof. L.R Connor
“Table in its broadest sense is an orderly arrangement of data in column and rows” – According to Prof M.M.Blaire
Objectives of tabulation
- It simplifies the raw data in meaningful form so that common man can easily understand in less time
- It brings essential facts in clear and precise manner
- Data presented in rows and columns helps in detailed comparison
- Tables serve as the best source of organized data for further statistical analysis
- Table saves the space without sacrificing the quality and quantity of data.
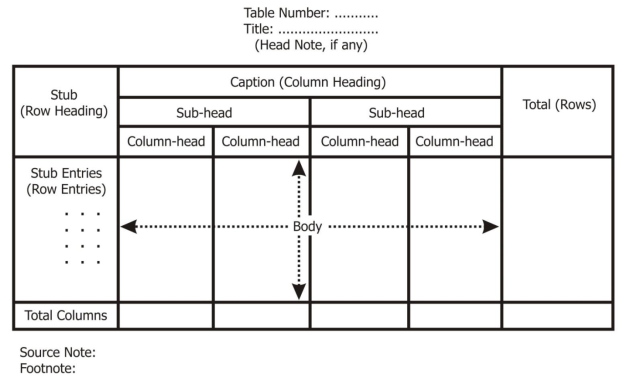
Parts of table
Table number |
|
Title of the table |
|
Caption |
|
Stub |
|
Body |
|
Head note |
|
Source note |
|
Footnote |
|

Types of tabulation
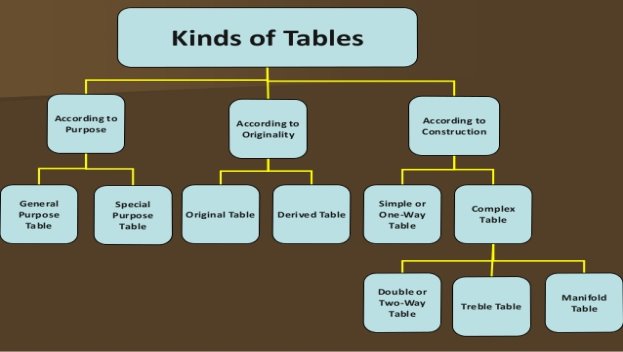
- According to purpose
- General purpose table – general purpose table is a table which is of general use. It does not serve any specific purpose under consideration
b. Special purpose table – special purpose table is prepared with some specific purpose in mind.
2. According to originality
- Original table – an original table is that table in which data are presented in the same manner in which they are collected.
b. Derived table – a derived table is that in which data is not presented in same manner in which they are collected. Here the data are first converted into ratio or percentage and then presented.
3. According to construction
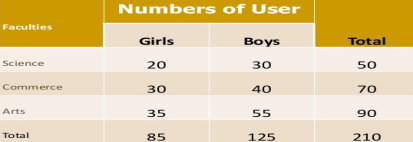
- Simple table – simple table also known as one-way table. Under this data are presented based on one characteristic
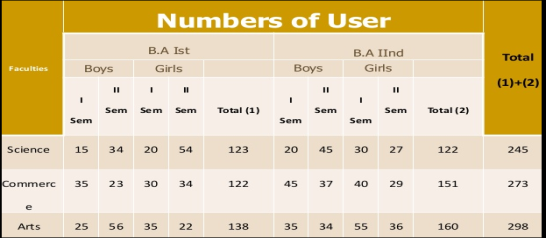
Faculty wise library user
b. Complex tables – in complex table data are presented according to two or more characteristics simultaneously.
The complex tables are
- Two way,
- Three-way table and
- Manifold table
Two-way table – Under this the variable under study is divided into two characteristics

Three-way table - Under this the variable under study is divided into three characteristics
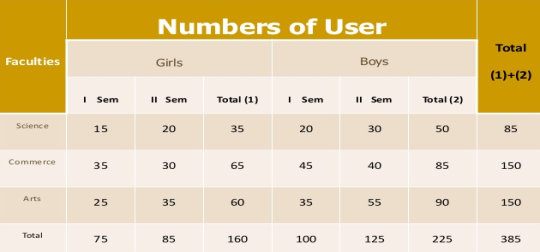
Manifold table - Under this the variable under study is divided into large number of characteristics.
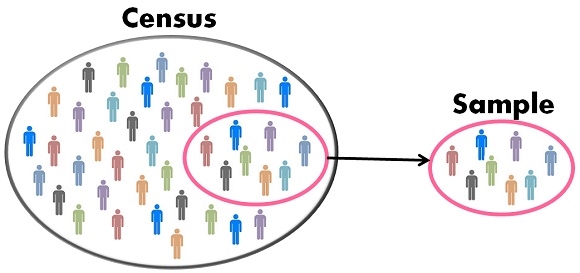
Both census and sampling provide information about a population. In census, each and every unit of population is studies. While in sampling small units are studied which represents the population. Government uses both census and sampling data for various purposes like planning, development programs, etc.
Census method
A well-organized procedure of gathering, recording and analyzing information regarding the members of the population is called a census. Under method census each and every unit of the universe is included in the collection of data. Huge amount of finance, time and labor are required for gathering information. This method is useful to find out the ratio of male to female, the ratio of literate to illiterate people, the ratio of people living in urban areas to the people in rural areas.
Merits
- It helps government with future plans
- It gives complete information about population
- It gives more reliable and accurate information
- It covers wide range of the study
Demerits
- It is time consuming and expensive
- Sometimes we many loose information while investing all individual
- It need a number of manpower
Sampling method
The sample is a small segment considered for study which represents the standard of entire population. The selection of sample should give justifiable conclusion about the whole population. When the population size is very large and it is difficult to consider all members then sampling method is used. Under this method selection of appropriate representative sample is utmost important. On the basis of data collected from sample, conclusion is drawn for the whole population.
Types of sampling method
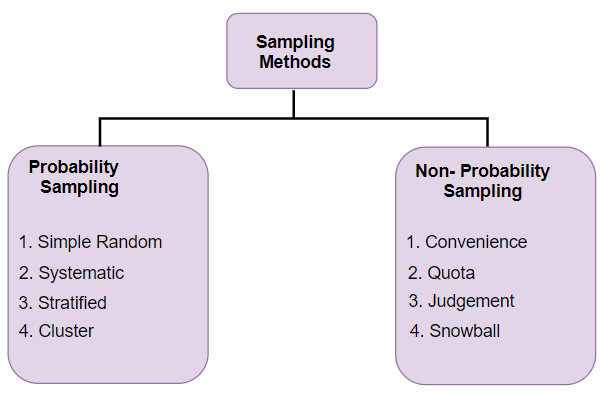
- Probability sampling
- It is also called as random sampling
- Random sampling is one of the simplest sampling techniques in which each sample have an equal chance of being chosen from the population
- It is an unbiased representation of the population
Types of random sampling
- Simple random sampling – It is one of the basic and easiest form of random sampling. Simple random sampling assures that every member have an equal chance of being included in the sample.
- Stratified random sampling – It is also known as proportional random sampling. In this sampling technique, the populations are split into different groups. The overall sample selected randomly from different groups. These techniques guarantee that each group will be represented in sample.
- Systematic random sampling – systematic random sampling refers to selecting sample on a system of interval in a numbered population.
- Cluster random sampling – under cluster sampling, the researcher divide the population into separate groups known as cluster. Here each cluster represents the population as a whole. The researcher randomly selects the cluster for his analysis.
b. Non random sampling –
- It is also called as non probability sampling
- Non random sampling is one of the sampling techniques in which each sample does not have an equal chance of being chosen from the population
- It is a biased representation of the population
Types of non-random sampling
- Convenience sampling – under this technique, the samples are selected because they are easily accessible to the researcher. This technique is easiest, cheapest and less time consuming
- Consecutive sampling – It is similar like convenience sampling. Under this technique all subjects that are available as a part of sample are included which result a better presentation of the entire population
- Quota sampling – Under quota sampling, the samples are selected on the same proportions of individuals as the entire population depending on characteristics, traits as the basis of quota.
- Judgmental sampling - Judgmental sampling is more commonly known as purposive sampling. The researcher keeps a specific purpose in mind and selects the subject for sampling process. The researcher believes that some subjects are fit for the research compared to other individuals.
- Snowball sampling – this technique is used when the population size is small. Under snowball sampling, the researcher ask initial subject to identify another potential subject who meets the criteria of research. Thus, this technique hardly represents the population.
References:
- B.N Gupta – Statistics
- S.P Singh – statistics
- Gupta and Kapoor – Statistics
- Yule and Kendall – Statistics method