Unit 4
The Firm and Perfect Market Structure
The following points highlight the top two approaches to explain the profit maximizing behavior of a firm.
Approach 1- Equilibrium of a Firm—The Total Revenue and Total Cost Approach:
Irrespective of the market situation profit becomes maximum, when the difference between total revenue (TR) and total cost (TC) becomes the greatest. The TR curve starts from the origin and it rises in proportion to the rise in the volume of sales.
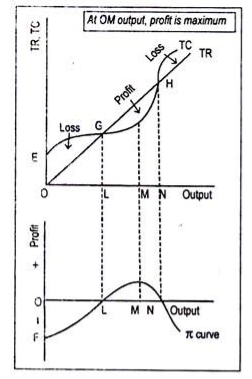
From point E the TC curve starts which lies above the origin which means even if no output is produced the costs are positive. Such costs are called fixed costs of a firm. All these curves have been drawn in the upper panel of the figure.
The bottom part of the figure shows various amounts of profit enjoyed by a firm at various volumes of output. Below the level of output OL, since TC exceeds TR the firm incur loss. TR equals TC and the firm earns only normal profit, only at the OL output level. Thus, point G is called break-even point. Now, if more than OL but less than ON output is produced, TR will exceed total cost and the firm will earn supernormal profit.
At the output level OM, as the difference between TR and TC is the greatest, profit is maximum. This is clear from the bottom panel of the figure where n is the profit curve. Below OL output level, profit curve lies below the origin indicating negative profit. Profit becomes zero at OL output level.
It becomes maximum at OM output level and, again, it reduces to zero (i.e., break-even point) when ON amount of output is produced. Beyond ON (or at ON), as TC exceeds TR, the firm incurs a loss. Now the profit curve has again entered the negative quadrant. Anyway, maximum profit is obtained at the output level OM, where the vertical distance between TR and TC curves is the maximum.
Approach 2- Equilibrium of a Firm—the Marginal Revenue and Marginal Cost Approach:
A firm will stop production if total revenue falls short of total variable cost, irrespective of the market conditions. At the point where MR and MC are equal to each other profit will be maximized.
The output MR > MC means that there is no incentive on the part of the firm to raise its output. If it decides to increase output when MC > MR, it will add more to its costs than to its revenues, thus reducing profit. Hence the profit-maximizing output occurs at that point when MR = MC.
We have shown equilibrium of a firm under perfect and imperfect competition, respectively. Under perfect competition, AR = MR = P. It has been drawn parallel to the horizontal axis. MC curve is U-shaped. Profit is maximized when MR and MC are equal.
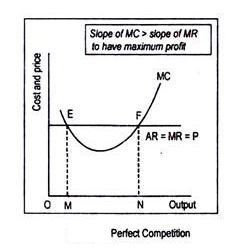
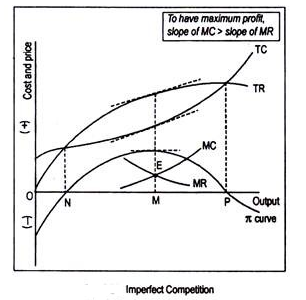
In the second figure, at point E, though MR = MC, it does not correspond to profit-maximizing situation.
If the firm expands output beyond OM, it will add more revenue than to its costs, since MR > MC. It will enjoy more profit by producing more output. Only at output ON will profit be maximized when MR = MC. Production beyond ON will entail a loss since MC > MR. So, a profit-maximizing firm always changes output toward the level at which MR = MC.
Thus profit maximization under two conditions
i. MC = MR, known as necessary condition or first-order condition (FOC); and
Ii. Slope of MC must be greater than the slope of MR. This condition is called sufficient condition or second-order condition (SOC).
Equilibrium requires the fulfillment of both FOC and SOC, simultaneously. This occurs at point F. Corresponding to point F, ON is the profit-maximizing level of output. The imperfectly competitive firm is in equilibrium at point E where both FOC and SOC are satisfied.
Key takeaways –
- Profit becomes maximum, when the difference between total revenue (TR) and total cost (TC) becomes the greatest.
Short run cost
Short run cost is the cost where the quantity of one input is fixed and the quantity of other input varies. In this case, the land and machinery is fixed where as the other factors such as labour and capital vary with time. Thus expansion is done in hiring more labour and increasing capital.
- Total fixed cost (TFC)-
- Total fixed cost remains fixed in short run period. The cost does not change with the change in the level of output.
- These costs are also called indirect costs, overhead costs, historical costs, and unavoidable costs.
- Definition
- In the words of Ferguson, “Total fixed cost is the sum of the ‘short run explicit fixed costs and implicit costs incurred by the entrepreneur.”
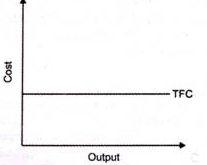
- From the above figure , we can see TFC curve is horizontal to X axis.TFC remains constant with proportionate change in the output.
2. Total variable cost
- Refers to the cost changes with the change in the level of output.
- Ex – cost incurred in purchase of raw material, hiring labour, etc
- Definition
According to Ferguson, “total variable cost is the sum of amounts spent for each of the variable inputs used”
- If the output is zero, total variable cost is zero.
- These costs are also called prime costs, direct costs, and avoidable costs.
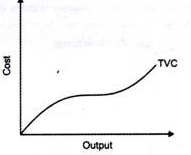
In the above figure, TVC changes with the change in the level of production
3. Total cost
- TC = TFC+TVC
- Total cost is the sum of fixed and variable cost. It changes with the change in the level of production
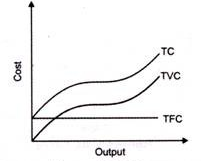
- In the above fig, initially total cost increases at diminishing rate, means the rate of cost increases with respect to less output. Later total cost increases at increasing rate, as cost increases with respect to output is more.
4. Average fixed cost (AFC)–
- Refers to fixed cost of production divided by the quantity of output produced.
- AFC= TFC/Output
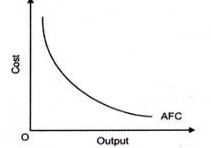
- AFC curve is declining in the above figure. The TFC remains constant as production increases, thus AFC falls
5. Average variable cost (AVC)
- It refers to total variable cost divided by total production
- AFC = TVC/Output
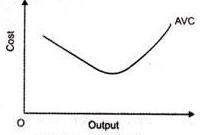
- AVC decreases as the output increases. But after a point, AVC increases as the output increases. Thus, it is U shaped curve
6. Average cost of production (AC)
- Refer to the total costs of production per unit of output.
- AC= TC/Output
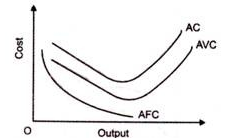
- AC is also equal to the sum total of AFC and AVC. AC curve is also U-shaped curve as average cost initially decreases when output increases and then increases when output increases.
7. Marginal cost (MC)
- Refers to change in total cost of production on addition unit of the product.
- MC = proportionate change in TC
 Proportionate change in output
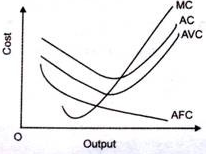
- In the above figure, we can see marginal cost initially decreases as output increases and later, rises as output increases. Thus, MC curve is also a U-shaped curve
In short, every firm is constrained by some fixed input that (1)leads to diminishing returns to variable inputs and (2)limits its capacity to produce. As a firm approaches that capacity, it becomes increasingly costly to produce successively higher levels of output. Marginal costs ultimately increase with output in the short run.
SHORT RUN COST-OUTPUT
In the earlier chapter we have discussed various concepts of cost. We are now familiar with money cost and its various categories such as fixed cost, variable cost , total cost and marginal cost. These costs behave in different ways as production changes. In this chapter we explain cost-output relationship in the short-run and long-run.
Short-run is a period where a firm produces its output within a given capacity. Its cost is divided between fixed and variable cost. Production is varied by changing variable cost. In the short-run, production is subject to law of variable proportion.
With a hypothetical example we explain behaviour of output and costs as shown in table
A Schedule of Short Run Costs-Output
All Costs in Rupees
Quantity q | Total fixed cost TFC | Total variable cost TVC | Total cost TC=TFC+TVC | Marginal cost MC | Average fixed cost AFC=TFC/q | Average variable cost AVC=TC/q | Average total cost ATC=TC/q ATC(AC)=AVC+AFC |
1 | 2 | 3 | 4 | 5 | 6 | 7 | 8 |
0 | 100 | 0 | 100 |
|
|
|
|
1 | 100 | 25 | 125 | 25 | 100 | 25 | 125 |
2 | 100 | 40 | 140 | 15 | 50 | 20 | 70 |
3 | 100 | 50 | 150 | 10 | 33.3 | 16.7 | 50 |
4 | 100 | 70 | 170 | 20 | 25 | 17.5 | 42.5 |
5 | 100 | 100 | 200 | 30 | 20 | 20 | 40 |
6 | 100 | 145 | 245 | 45 | 16.6 | 24.2 | 40.8 |
7 | 100 | 205 | 305 | 60 | 14.3 | 29.3 | 43.6 |
8 | 100 | 285 | 385 | 80 | 12.5 | 35.6 | 48.1 |
9 | 100 | 385 | 485 | 100 | 11.1 | 42.8 | 53.9 |
10 | 100 | 515 | 615 | 130 | 10 | 51.5 | 61.5 |
In table, output (q) in column 1 ranges from 0 to 10.
Total fixed cost (TFC) in column 2 remains the same (Rs.100) throughout production.
Total Variable Cost (TVC) Change from 0 to 515. When there is n production TVC is zero and as the output increases, TVC also increases.
Total Cost (TC) in column 4 is equal to TFC+TVC, which also increase as the output increases. Given the constant TC, change in TC is due to change in TVC. TVC can be obtained by deducing TFC from TC(TVC=TC-TFC).
Marginal Cost (MC) is the additional cost to produce an additional unit of output which is equal to a change in TVC or a change in TC, as ∆TVC=∆TC.
Average Fixed Cost (AFC) is equal to TFC/q. It decline continuously till the last unit of output. This is result of a constant sum (rs.100) which is divided by an increasing denominator.
Average Variable Cost (AVC) declines till output 5 (rs.20) and thereafter increases are more units are produced.
Average Total Cost (ATC) is equal to AFC+AVC. It declines till the 5th unit and thereafter increases.
Key takeaways –
- Short run cost is the cost where the quantity of one input is fixed and the quantity of other input varies.
In long run, all the factors of production vary. Long run is period in which all cost change as all the factors of production are variable. To produce at a lower cost in long run, the organization should have the ability to change the factors of production. There is no difference between TC and TVC as there is no fixed cost.
- Long run total cost (LTC)–
- It refers to the minimum cost at which a given level of output can be produced.
- Definition
According to Leibhafasky, “the long run total cost of production is the least possible cost of producing any given level of output when all inputs are variable.”
- LTC is always less than or equal to short run total cost (STC), but it is never more than short run cost.
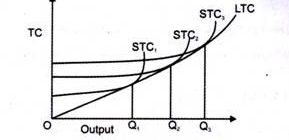
- In the above figure, STC 1,2,3 is the cost at different plant size. The LTC curve is made by joining the minimum points of STC curves.
2. Long run average cost (LAC)
- It refers to long run total cost divided by the output.
- The long run average costs curve is also called planning curve or envelope curve as it helps in making plans for expanding production and achieving minimum cost.
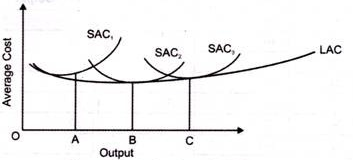
- In the above figure, LAC is derived from the short run average cost(SAC) curve. The organization will operate on the SAC2 plant as it entails lower cost than SAC1. If organization wants to produce more output, then it will be beneficial to produce at SAC3 than SAC2.
- LAC curve first falls then rises, so it is U shaped curve
3. Long run marginal cost (LMC)-
- Long run Marginal Cost (LMC) is defined as added cost of producing an additional unit of a commodity when all inputs are variable.
- LMC is derived from SMC
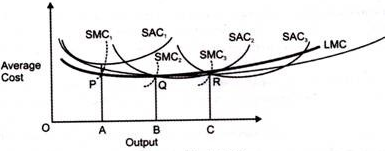
- On the graph, Output A,B,C intersects SMC at P,Q,R. LMC is drawn by joining P,Q and R respectively which is the tangency between LAC and SAC.
LONG-RUN COST OUTPUT
The long-run is a period of time during which the firm can alter its size and organisation to changing demand conditions. In other words, in the long-run the firm can adjust its scale of operations or size of plant to produce any required output in the most efficient way. Thus, in the long run the fixed factors can be altered. Management can be reorganized to run a firm of a different size. Capital can also be used differently. In short, all factors are variable in the long run and therefore the scale of operations can be altered.
Thus, in the long-run all costs are variable (i.e. the firm faces no fixed costs). The length of time of the long run depends on the industry. In some services industries, such as dry-cleaning, the period of the long-run may be only a few months or weeks. For capital intensive industries, such as electricity-generating plant, the construction of a new plant may take many years and hence long-run may be many years. The length of time of the long-run depends upon the time required for the firm to be able to vary all inputs.
The long-run is often referred to as the planning horizon because the firm can build the plant that minimizes the cost of producing any anticipated level of output. Once the plant has been built, the firm operates I the short-run. Thus, the firm plans for the long-run and operates in the short-run.
Key takeaways –
- In long run, all the factors of production vary. Long run is period in which all cost change as all the factors of production are variable.
REFERENCE
- Karl E. Case and Ray C. Fair, Principles of Economics, Pearson Education Inc., 8th Edition, 2007.
- N. Gregory Mankiw, Economics: Principles and Applications, India edition by South Western, a part of Cengage
- Learning, Cengage Learning India Private Limited, 4th edition, 2007.
- Joseph E. Stiglitz and Carl E. Walsh, Economics, W.W. Norton & Company, Inc., New York, International Student
- Edition, 4th Edition, 2007
- Arthashastra- Dr .Suman