Unit 2
Supply and Demand: How Markets Work, Markets and Welfare
Market is a place where commodities are bought and sold at a price( Wholesale or retail). A market refers to a place where buyer and seller come close to each other directly or indirectly to sell and buy goods. It also refers to place of demand and supply.
Definition
According to Prof. Behham – “We must therefore, define a market as any area over which buyers and sellers are in such close touch with one another either directly or through dealers that the prices obtainable in one part of the market affect the prices in other parts.”
Features of a market
- One commodity
- Market refers to market for a commodity. For example – tea market, cloth market, gold market
- Area
- Market refers to area of demand and supply. Where buyer and seller come together for transaction
- Buyers and sellers
- To create a market, group of potential buyers and potential sellers is needed.
- Sound monetary system
- Money exchange system be available in the market
- Knowledge of market
- Buyer and seller should have perfect knowledge of market regarding habbit, taste , etc
Types of market
Market structures are characterized based on the competition levels and the nature of these markets such as nature of goods, number of buyer, number of seller etc.
There are four types of market structure in an economy

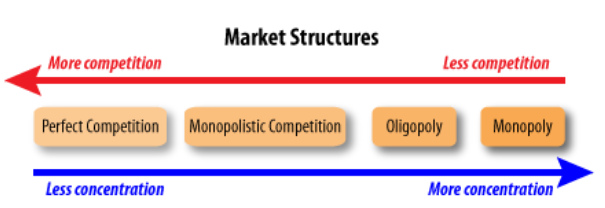
- Perfect competition – in perfect competition, there are large number of buyers and sellers, where large number of small seller competes against each other. A single firm cannot influence the market price. So all the firms in perfect completion are price takers.
Features
- All firm only have the motive of maximize profits
- All firm sell homogenous goods
- No customer preferences
- Free exit and entry in the market
- All firms are price takers. Therefore the firms demand curves perfectly elastic
- All firm have perfect information and knowledge
2. Monopolistic competition – in Monopolistic competition there are large numbers of buyers and sellers which do not sell homogenous product unlike perfect competition. This is more realistic in the real world.
Features
- All firms maximize profit
- Free entry and exit in the market ie no barriers
- Firm sell differentiated products
- Customers have the preference of choosing products
- Seller becomes price setter
- Seller can charge marginally high price to enjoy market power
3. Oligopoly – in oligopoly there are small number of firms in the market. As per the norms, oligopoly consist of 3 -5 dominant firms. The firms can compete with each other or collaborate to earn more profits. Here the buyers are more than the sellers.
Features
- All firms maximize profit
- Barriers to entry and exit in the market. New firm finds difficulty to establish
- Consumers become price takers
- Only few firms dominate the market
- Products may be homogenous or differentiated
- Ability to set prices
- Perfect knowledge of market
4. Monopoly – In monopoly market, single firm or one seller controls the entire market. The firm has all the market power, so he can set the prices to earn more profit as the consumers do not have any alternative.
Features
- The monopolist maximizes profits
- Monopolist set the prices
- Barriers to entry and exit
- One firm dominates the entire market
Key takeaways –
- A market refers to a place where buyer and seller come close to each other directly or indirectly to sell and buy goods.
- Four types of market structure is perfect competition, monopoly, monopolistic, oligopoly
Demand
- Demand refers to desire of a consumer to purchase goods and services and ability to pay a price for the goods and services purchased. No business will produce anything, without consumers demand
- Demand is an important factor for expansion and economic growth.
- For instance, if the price of goods or services increases will lead to decrease in the demand of goods and services by the consumer, and vice versa
Determinants of Demands:
They are as follows:
Price of the product:
- Price plays an important factor to make decision if all other factor remains constant.
- Increase in demand follows reduction in price and similarly, decrease in cost of goods and services will increase the demand
Income of consumer
- Income and demand is directly proportional
- When the income rises, the demand for the good and services increases. When the income fall, the demand will decrease simultaneously
Price of related goods and services
- Complementary products – complementary goods are goods that are used together. When the price of a particular item changes, it changes the demand of that item as well as the complement. Example: Increase in the price of car will reduce the demand for petrol.
- Substitute Product –Substitute products are those products which are used for same purpose. Example: Price of tea increases then the demand for coffee increases and the demand for tea decreases.
Consumer Expectations
- When consumer expect value of something will increase , they demand more of it
- For ex, if the vehicle price is expected to increase, people buy more
Number of Buyers in the Market
- The number of buyers plays a major effect on the total demand
- As the number of buyer increases, the demand rises and vice versa
Taste and preference of consumers
- The demand for commodity changes with changes in the tastes and preferences of consumers
- It depends on customers’ customs, traditions, beliefs, habits, and lifestyles.
Credit policy
- Credit policy affects the demand of the commodity
- Credit policy refers to the terms and conditions for supplying various commodities on credit.
- Favorable credit policies increase the demand for expensive durable goods such as cars and houses.
Supply
Supply is the willingness and ability of producers to produce goods and services and make it available to the consumers. The total amount of goods and services available for purchases at any specific price.
Definition: Supply is an economic term that refers to the amount of a given product or service that suppliers are willing to offer to consumers at a given price level at a given period.
Determinants of Demands:
- Price of the product - The major determinants of the supply of a product is its price. Other factors remains the same, an increase in the price of a product increases its supply and vice versa. Producer expects increase profits so they increase the supply of product at higher price.
2. Cost of production - Cost of production and supply are inversely proportional to each other. This implies that suppliers do not supply products in the market when the cost of manufacturing is more than their market price.
3. Natural conditions – certain products supply is directly influenced by climatic conditions. For example, the supply of agricultural products increases when the monsoon comes well on time.
4. Transportation conditions - Better transport facilities result in an increase in the supply of goods. Transport is always a constraint to the supply of goods. This is because due to poor transport facilities goods are not available on time.
5. Taxation policies - Government’s tax policies also act as a regulating force in supply. The supply will decrease if the rates of taxes levied on goods are high. This is because overall productions costs are increased by high tax rate, which will make it difficult for suppliers to offer products in the market.
6. Production technique - The supply of goods also depends on the type of techniques used for production. Obsolete techniques result in low production, which further decreases the supply of goods.
7. Price of related goods - The prices of substitutes and complementary goods also determines the supply of a product to a large extent.
For example, if the price of tea increases, farmers would tend to grow more tea than coffee. This would decrease the supply of tea in the market.
Key takeaways –
- Demand refers to desire of a consumer to purchase goods and services and ability to pay a price for the goods and services purchased
- Supply is the willingness and ability of producers to produce goods and services and make it available to the consumers.
Demand schedule and graph
The law of demand states that all other factors remain constant or equal, an increase in the price causes a decrease in the quantity demanded and a decrease in goods or services price leads to increase in the quantity demanded. Thus it expresses an inverse relationship between price and demand.
A table that shows the quantity demanded at each price, is called a demand schedule
A demand curve shows the relationship between price and quantity demanded on a graph.
For example, at Rs 70 per kg consumer may demand 2 kg of apple. On the other hand, the price rises to 100/- per kg then he may demand 1 kg of apple
Assumption of law of demand
- No change in the income
- No change in size population
- No change in price of related goods
- No change in consumers taste, preferences, etc
- No expectation of a price change in future
- No change in climate conditions
Given these assumption, the law of demand is explained in the below table –
Price(rs) | Quantity demanded |
10 | 10 |
8 | 20 |
6 | 30 |
4 | 40 |
2 | 50 |
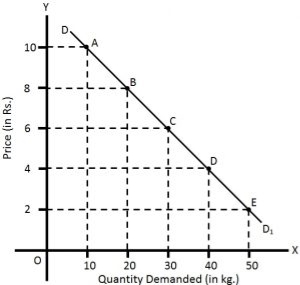
The above table shows that when the price of apple, is Rs. 10 per kg, 10 kg are demanded. If the price falls to Rs.8, the demand increases to 20 kg. Similarly, when the price declines to Rs 2, the demand increases to 50 kg. This indicates the inverse relation between price and demand.
Also, in the above figure, X axis represents quantity demanded and Y axis represent price. The graph shows the demand curve slopes downwards as the price decreases, the quantity demanded increases.
Supply schedule and graph
Law of supply states that all factors being constant, seller supply more in the rising price and supply less when the price decreases.
Definition
“Other things remaining unchanged, the supply of a commodity rises i.e., expands with a rise in its price and falls i.e., contracts with a fall in its price.
Assumption
- No change in income
- No change in technique of production
- No change in transport cost
- The price of other goods remain constant
- No change in government policies
- No speculation about future changes in the price of the product
- Fixed scale of production
Explanation of the law
Law of supply explained with the help of supply schedule and supply curve
Supply schedule
Supply schedule is the tabular representation of price and quantity supplied by the seller

When the price was Rs 10, quantity supplied was 1kg. When the price started 3ising from Rs 20 to 50 to 40 so on, the quantity supplied by the seller increased from 2kg, 3 kg to 5kg respectively.
Thus the above table shows positive relation between price and quantity
Supply curve
The supply curve is a graphical representation of a supply schedule.
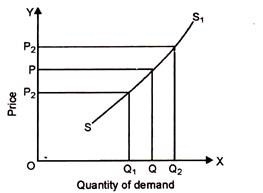
In the above figure, OX axis shows quantity of demand and OY axis shows price. When the price was at OP, supplier was supplying OQ quantity. When the price increases from OP to OP2 and then supply also increases from OQ to OQ2. Similarly, if price decreases from OP to OP1, then supply also decreases from OQ to OQ1.
In the above figure, we can see supply curve is sloping upward. The market supply rises with the rise in price.
Key takeaways –
- A table that shows the quantity demanded at each price, is called a demand schedule
- A demand curve shows the relationship between price and quantity demanded on a graph.
Meaning of individual supply
Individual supply refers to the demand by individual or firm. Individual demand refers to the quantity demanded by the single consumer or firm at a specific price in a given period of time.
Meaning of Market Supply:-
Market supply refers to the demand by all the individuals or the firms. Market demand refers to the quantity demanded by all the consumers or firms at a specific price in a given period of time.
Difference
Basis of difference | Individual supply | Market supply |
Meaning | It refers to the quantity of commodity supplied by a single seller. | It refers to the quantity of a commodity supplied by all the sellers or the firms in the market. |
Shown by | Individual Supply is shown by Individual Supply Schedule and Individual Supply Curve. | Market Demand is shown by the Market Supply Schedule and Market Supply Curve. |
Inter relationship | Individual supply is a component of Market supply. | It is the aggregation of individual supply. |
Supply curve | The individual supply curve is relatively steeper. | The market supply curve is relatively flatter. |
Scope | It has a narrower scope as it is related to the supply of a seller only. | It has a broader scope as it is related to the supply of all the sellers. |
Represents | It represents different quantities of a commodity supplied by an individual at different prices in the market. | It represents different quantities of a commodity supplied by all sellers at different prices in the market. |
Individual demand vs market demand
The individual demand is the demand of one individual or firm. It represents the quantity of a good that a single consumer would buy at a specific price point at a specific point in time. While the term is somewhat vague, individual demand can be represented by the point of view of one person, a single family, or a single household.
Market demand provides the total quantity demanded by all consumers. In other words, it represents the aggregate of all individual demands. There are two basic types of market demand: primary and selective. Primary demand is the total demand for all of the brands that represent a given product or service, such as all phones or all high-end watches.
Key takeaways –
- Individual supply refers to the demand by individual or firm
- Market supply refers to the demand by all the individuals or the firms.
Shifts in the demand/supply curve
Shift in the demand curve
The shift in demand curve is when, the price of the commodity remains constant, but there is a change in quantity demanded due to some other factors, causing the curve to shift to a particular side.
Change in demand refers to increase or decrease in demand for a product due to various determinants of demand other than price.
- It is measured by shifts in the demand curve.
- The terms, change in demand means to increase or decrease in demand.
Increase and decrease in demand takes place due to changes in other factors, such as change in income, distribution of income, change in consumer’s tastes and preferences, change in the price of related goods. In this case, the price factor remains unchanged.
Increase in demand
Increase in demand refers to the rise in demand for a product at a specific price,
Decrease in demand
Decrease in demand is the fall in demand for a product at a given price.
When other factors change, the demand curve changes its position which is referred to as a shift along the demand curve, which is shown in Figure.
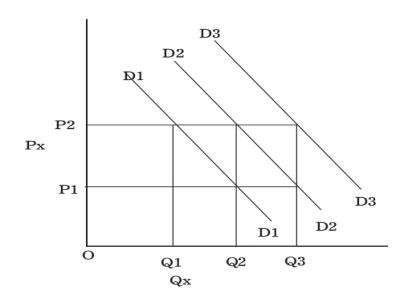
Demand Curve Shift
Demand curve D2 is the original demand curve of commodity X. At price OP2, the demand is OQ2 units of commodity X.
When the consumer’s income decreases owing to high income tax, he is able to purchase only OQ1 unit of commodity X at the same price OP2. Therefore, the demand curve, D2 shifts downwards to D1.
Similarly, when the consumer’s disposable income increases due to a reduction in taxes, they are able to purchase OQ3 units of commodity X at the price OP2. Therefore, the demand curve, D2 shifts upwards to D3. Such changes in the position of the demand curve from its original position are referred to as a shift in the demand curve.
Shift in supply curve
The shift in supply curve is when, the price of the commodity remains constant, but there is a change in quantity supply due to some other factors, causing the curve to shift to a particular side.
Change in supply refers to increase or decrease in the supply of a product due to various determinants of supply other than price (in this case, price remaining constant).
- It is measured by shifts in supply curve.
- The terms, while a change in supply means an increase or decrease in supply.
Increase and Decrease in Supply
Increase in Supply
An increase in supply takes place when a supplier is willing to offer large quantities of products in the market at the same price due to various reasons, such as improvement in production techniques, fall in prices of factors of production, and reduction in taxes.
Decrease in Supply
A decrease in supply occurs when a supplier is willing to offer small quantities of products in the market at the same price due to increase in taxes, low agricultural production, high costs of labour, unfavourable weather conditions, etc.
Supply curve shifts
A shift takes place in supply curve due to the increase or decrease in supply, which is shown in Figure.
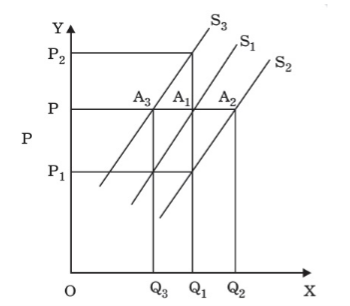
In the above Figure, an increase in supply in indicated by the shift of the supply curve from S1 to S2. Because of an increase in supply, there is a shift at the given price OP, from A1 on supply curve S1 to A2 on supply curve S2. At this point, large quantities (i.e. Q2 instead of Q1) are offered at the given price OP.
On the contrary, there is a shift in supply curve from S1 to S3 when there is a decrease in supply. The amount supplied at OP is decreased from OQ1 to OQ3 due to a shift from A1 on supply curve S1 to A3 on supply curve S3.
However, a decrease in supply also occurs when producers sell the same quantity at a higher price which is shown in Figure as OQ1 is supplied at a higher price OP2.
Key takeaways –
- Change in demand refers to increase or decrease in demand for a product due to various determinants of demand other than price.
- Change in supply refers to increase or decrease in the supply of a product due to various determinants of supply other than price
Elasticity and its application
Under law of demand, price falls and demand rises, vice versa. But how much the quantity rise or fall for a given change in price is not determined in law of demand. So the concept of elasticity of demand is derived to know how much quantity demanded changes for a change in the price of goods or services.
“The elasticity (or responsiveness) of demand in a market is great or small according as the amount demanded increases much or little for a given fall in price, and diminishes much or little for a given rise in price”. – Dr. Marshall.
Elasticity means sensitivity of demand to the change in price.
The formula for calculating elasticity of demand is:
EP = proportional changes in quantity demanded/proportional changes in price
Types of elasticity of demand
Elasticity of demand is of following types
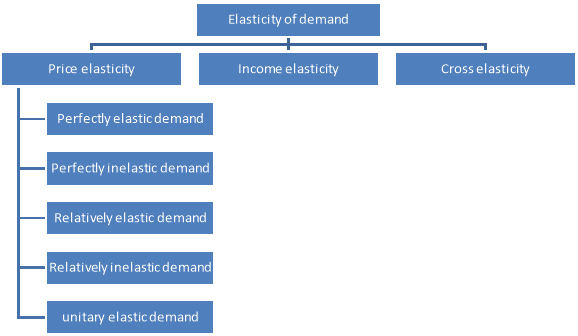
Price of elasticity of demand –
- The price of elasticity demand is the change in the quantity demanded to the change in the price of the commodity
- Formula –
- Ep = percentage change in quantity demanded/percentage change in price
There are 5 types of price elasticity of demand given below
- Perfectly elastic demand
- A small change in price results to major change in demand is said to be perfectly elastic demand
- The demand curve in perfectly elastic demand represent horizontal straight line
- Ep = infinity
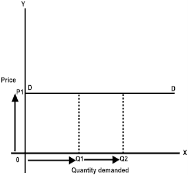
From the above figure, we can see at price P1 consumers are ready to buy as much quantity as they want. A slight increase in price may result to fall in demand to zero.
2. Perfectly inelastic demand
- When there is no change in the demand of the commodity with the change in price is said to be perfectly inelastic demand
- The demand curve in perfectly elastic demand represent Vertical straight line
- Ep = zero


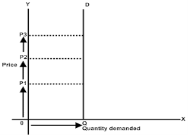
From the above fig, we can see that price is rising from P1 to P2 to P3, but there is no change in the demand. This cannot happen in practical situation. But, in essential goods such as salt, with the change in price the demand does not change.
3. Relatively elastic demand
- When the proportionate change in demand is greater than the proportionate change in price of a product
- The value ranges between one to infinity (ep>1)
- Ex – a smaller change in flight price result in more demand for booking the flight tickets
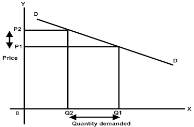

- From the above figure, it is observed that the percentage change in demand from Q2 to Q1 is larger than the percentage change in price from P2 to P1. Thus the demand curve is gradually sloping downwards
4. Relatively inelastic demand
- When the percentage change in demand is less than the percentage change in price
- The value ranges between zero to one (ep<1)
- Ex – cloths, drinks, food, oil , as the change in price does not affect the quantity demanded.

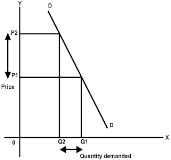
- From the above figure, it is interpreted that the proportionate change in demand from Q2 to Q1 is less than the proportionate change in price from P2 to P1. Thus the demand cure rapidly sloping down.
5. Unitary elastic demand
- When the percentage change in quantity demanded in equal to the percentage change in price of the commodity
- The value is equal to one (ep=1)
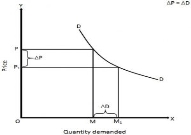
In the above figure we can observe that proportionate change in price from P to P1 cause the same proportionate change in price from M to M1
Income elasticity demand
The income elasticity is measures the sensitivity of quantity demanded for a goods or services to a change in consumer’s income
 Formula - Percentage change in the quantity demanded
Percentage change in the consumer’s income
Cross elasticity
“The cross elasticity of demand is the proportional change in the quantity of X good demanded resulting from a given relative change in the price of a related good Y” Ferguson
It measures the percentage change in the quantity demanded of commodity X to the percentage change in the price of its substitute/complement Y
 Formula – proportionate change in quantity demanded of X
Proportionate change in the price of Y
Practical application of elasticity of demand
- Taxation –
- Price elasticity of demand is used by the government while planning taxes
- High rate of tax is imposed on products for which demand is inelastic.
- Government to earn more revenue imposes taxes on necessities of life.
- Whereas under elastic demand, government will earn less revenue as increase in price will lead to decrease in demand.
2. Monopoly prices
- Monopolist consider the demand of consumer to fix the price
- Business man will fix the price at low when the demand is elastic
- Whereas the price will be high when the demand is inelastic
3. Price discrimination
- It means different consumers are charged different prices for the same product
- For instance, electricity for domestic consumer is charged more than industrial purpose. As electricity for industrial purpose can be replaced from other fuel. Thus the demand for electricity for domestic user is inelastic
4. Wages
- Wages are influenced by elasticity of demand
- In case of inelastic demand, the trade union succeed in raising the wages for the service of labor, but not in case of elastic demand
5. Joint products
- Prices are not determined separately for joint product
- Eg – cotton fiber and cotton seeds
- Elasticity of demand is applied to determine their individual prices
6. Economic policies
- Elasticity of demand helps in formation of economic policies
- It helps in devaluing the currency to increase revenue
- Under elastic demand, there will be increase in volume sold after devaluation. On the contrary, if the demand is inelastic there will be no change in volume sold after devaluation
7. Effects in revenue
- The concept helps in determining equilibrium of a firm
- A firm reaches equilibrium when the revenue is equal to cost price
- Elasticity of demand helps in determining the price to earn more revenue
Price elasticity of supply
Price elasticity of supply (Ep) is a measure of how much quantity supplied of a good
Responds to a change in the price of that good. Depends on the flexibility of sellers to
Change the amount of the good they produce
Supply Ep = Percentage change in quantity supplied / Percentage change in price
Supply often becomes less elastic as quantity rises, due to capacity limits.
Supply is elastic if quantity supplied responds substantially to changes in the price. In
This case Supply Ep > 1
Supply is inelastic if quantity supplied responds only slightly to changes in the price.
In this case Supply Ep < 1.
Supply has unit elasticity if the quantity moves the same amount proportionately as
The price. In this case Supply Ep = 1
A vertical supply curve is perfectly inelastic (Elasticity =0). A horizontal supply
Curve is perfectly elastic (Elasticity =Infinity).
The more easily sellers can change the quantity they produce, the greater the price
Elasticity of supply.
For many goods, price elasticity of supply is greater in the long run than in the short run,
Because firms can build new factories, or new firms may be able to enter the market.
The price elasticity of supply measures how much the quantity supplied responds to changes in the price. Supply of a good is said to be elastic if the quantity supplied responds substantially to changes in the price. Supply is said to be inelastic if the quantity supplied responds only slightly to changes in the price.

Determinants of supply elasticity:
The elasticity of supply is very important in economics.
There are several factors that affect the elasticity of supply, as well as demand.
(a)Time:
This is the most important factor, as we have seen how elasticity increases over time.
(b) factor mobility:
The ability to easily move production factors from one application to another affects the elasticity of supply.The higher the factor mobility, the greater the elasticity of the supply.
(c)natural constraints:
Nature imposes restrictions on supply.For example, if you want to produce more vintage wines, it will take years to mature to become vintage.
(d)risk-taking:
The more entrepreneurs try to take risks, the greater the elasticity of the supply. This is partly affected by the system of incentives in the economy. For example, if the marginal tax rate is very high, the elasticity of the supply may decrease.
(e) cost:
The elasticity of supply largely depends on how costs change as output changes. If unit prices rise sharply as output increases, the stimulus to expand production in response to price increases is immediately suppressed by the increase in costs incurred as output increases. In this case, the supply is not quite elastic.
SOn the other hand, if the unit price increase is slow with the increase in output, if the profit increases due to the increase in price, the supply will increase significantly before the increase in cost stops the increase in output.In this case, the supply tends to be quite resilient.
Key takeaways
- Elasticity means sensitivity of demand to the change in price.
Controls on prices, consumer surplus.
Price controls are government-mandated legal minimum or maximum prices set for specified goods. They are usually implemented as a means of direct economic intervention to manage the affordability of certain goods. Rice controls are only effective on an extremely short-term basis. Over the long term, price controls can lead to problems such as shortages, rationing, inferior product quality, and black markets.
Factors affecting the decision of prices
The factors that affect the pricing of products are:
1] Product cost
The cost of the product is one of the most important factors that affect the price. This includes the sum of fixed, variable and semi-variable costs incurred through the manufacture, distribution and sale of products. Fixed costs refer to costs that remain fixed at all levels of production or sales. For example, rent, salary, etc.
Variable costs are attributed to costs directly related to the level of production or sales. For example, the cost of basic materials, the cost of apprenticeships, etc. Semi-variable costs take into account these costs, which vary depending on the level of activity, but not in direct proportions.
2] Utility and demand
Habitually, end users demand more units of the product when the price is low, and vice versa. On the other hand, if the demand for the product is elastic, then the volume of demand can change significantly if the price fluctuations are small. On the other hand, if there is no elasticity, the change in price will not have a significant impact on demand. In addition, the buyer is ready to pay to the point where he feels that the utility from the product is at least equal to the price paid.
3] Degree of competition in the market
The next consistent factor that affects the price of manufactured goods is the nature and degree of competition in the market. If the degree of competition is low, companies can fix any price for their products. However, if there is competition in the market, we will fix the price, taking into account the price of the replacement.
4] Government and regulatory regulations
Companies that monopolize the market habitually impose high prices on their products. To protect the interests of the people, the government intervenes and regulates the price of goods. For this purpose, it declares some products as indispensable products. For example, life-saving drugs.
5] Pricing purposes
Another consistent factor affecting the price of an item for consumption or service is the purpose of pricing. Maximizing profits, gaining market share leadership, surviving in a competitive market and achieving product quality leadership are the goals of the company's pricing? Generally, companies charge higher prices to cover higher quality and higher costs if backed by the above objectives.
6] Used marketing methods
Various marketing methods such as distribution system, salesman quality, marketing, wrapping type, regular customer service, etc. also affect the price of manufactured goods. For example, if an organization uses elegant materials for packaging a product, the organization will charge an ultra-high amount of revenue.
Determination of Equilibrium Price

A price that equates demand with supply is called a balanced price.Graphically speaking, the equilibrium price is the point at which the demand and supply curves intersect.There is no unsold stock, and the demand is also a price that can not be met.Therefore, it is also known as market clearing price.
When the equilibrium price and quantity are reached, the stable equilibrium is reached.A stable equilibrium adjusts the disturbance of supply and demand and restores the original equilibrium.
Other things remain the same, but when the price falls below the equilibrium price, demand increases and supply decreases.A shortage of goods occurs, which raises the price to a balanced price.
Similarly, if the price exceeds the equilibrium price, demand will decrease and supply will increase.A surplus of goods occurs,which lowers the price to the equilibrium price.Therefore, the market will restore equilibrium prices by itself.
However, prices are not determined solely by the forces of supply and demand.Other factors such as the price of substitutes, the price of related products, government policy and competition in the market also play an important role in determining prices.
Consumer surplus
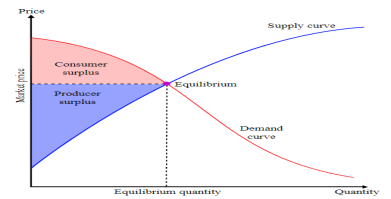
Consumer surplus is the difference between the maximum price a consumer is willing to pay and the actual price they do pay. If a consumer would be willing to pay more than the current asking price, then they are getting more benefit from the purchased product than they spent to buy it. Consumer surplus plus producer surplus equals the total economic surplus in the market.
This chart graphically illustrates consumer surplus in a market without any monopolies, binding price controls, or any other inefficiencies.. This means that the price could not be increased or decreased without one of the parties being made worse off. The consumer surplus, as marked in red, is bound by the y-axis on the left, the demand curve on the right, and a horizontal line where y equals the equilibrium price. This area represents the amount of goods consumers would have been willing to purchase at a price higher than the optimal price. Generally, the lower the price, the greater the consumer surplus.
Key takeaways –
- Price controls are government-mandated legal minimum or maximum prices set for specified goods.
- Consumer surplus is the difference between the maximum price a consumer is willing to pay and the actual price they do pay.
REFERENCES
- Karl E. Case and Ray C. Fair, Principles of Economics, Pearson Education Inc., 8th Edition, 2007.
- N. Gregory Mankiw, Economics: Principles and Applications, India edition by South Western, a part of Cengage
- Learning, Cengage Learning India Private Limited, 4th edition, 2007.
- Joseph E. Stiglitz and Carl E. Walsh, Economics, W.W. Norton & Company, Inc., New York, International Student
- Edition, 4th Edition, 2007
- Arthashastra- Dr .Suman