Unit - 6
PID controllers and Control system components
Effects of controller are viewed on time response and stability.
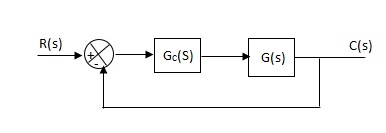
Gc(S) = TF of the controller
G(S) = OLTF without controller
G’(S) = Gc(S).G(S)
= OLTF with controller
(1). Proportional Controller:
Proportional means scalar Multiplier.
Gc(S) = Kp Stability can be controlled
Q. G(S) = 1/S(S + 8)
CLTF = 1/S2 + 8S + 1
w2n = 1
wn = 1
2ξWn = 8
ξ = 4
ξ>/1 so, overdamped.
Now introducing Gc(S) = K
G’(S) = Kp/S(S + 8)
CLTF = Kp/S2 + 8S + Kp
wn = √Kp
2 ξwn = 8
ξ = 4/√Kp
If,
Kp = 16; ξ = 1; critically damped
Kp> 16; ξ< 1; undamped
Kp< 16; ξ> 1; overdamped
(2). Integral controller:
The transfer function of this controller is
Gc(S) = Ki/S
Integral controller is used to improve the steady state response or reduce the steady state error.
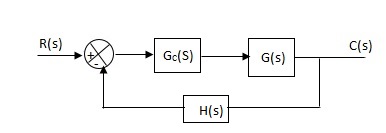
G’(S) = Gc(S).G(S)
G(S) = 1/S + 5, Gc(S) = Ki/S
G’(S) = Ki/S(S + 5). After applying the Gc(S) the type of system is increasing and hence, the steady state error is decreasing (Refer Time Response).
Disadvantage:
By using integral controller the stability of closed loop system decreases.
G(S) = 1/S + 5
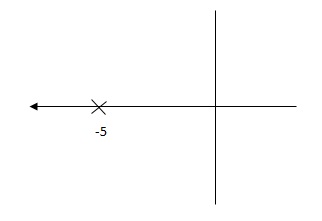
Fig (a)
G’(S) = Ki/S(S + 5)
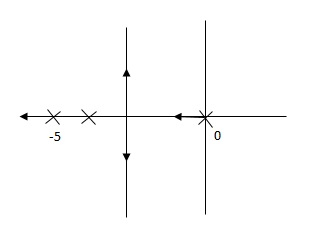
Fig (b)
Fig(a), is more stable than (b) as more the away the pole from origin (imaginary axis) more is the stability.
Q. G(S) = 1/(S + 5)(S + 10)
G’(S) = Kp/S(S + 5)(S + 10)
G(S) = 1/(S + 5)(S + 10)
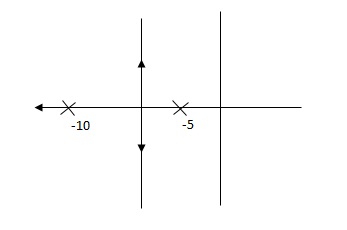
Fig (a)
G’(S) = Ki/S(S + 5)(S + 10)
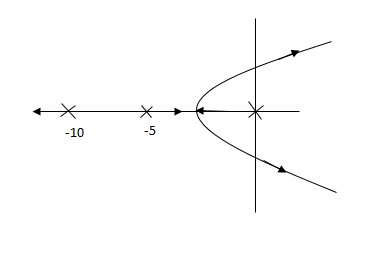
Fig (b)
So, (b), is less stable at root locus lies on the R.H.S,
(3). Derivative Controller:
Gc(S) = Kd(S)
They are used to improve the stability.
G’(S) = KdS/S2(S + 10)
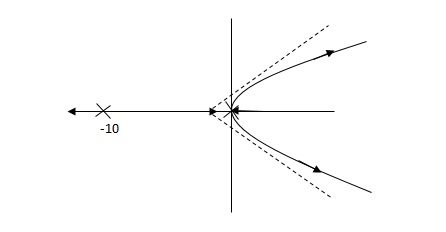
Fig (a)
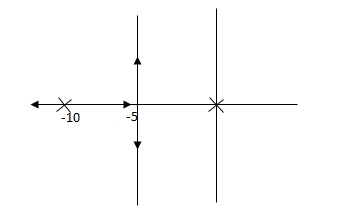
Fig (b)
(b) is stable i.e. more stable than the (a).
Disadvantage:
It increases the steady state i.e. o/p will not track the input at steady state.
(4). Proportional Plus Integral [PI] controller:
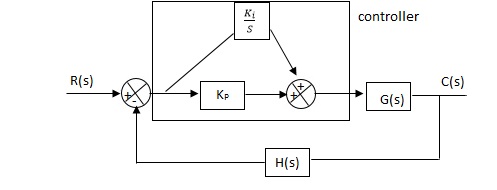
Gc(S) = KpS + Ki/S
The steady state error will decrease and the stability will depend on Kp i.e. if Kp is increased/decreased than according to it stability will change(Kpα stability).
Used to reduce ess without much affecting the stability.
(1). Resonant Frequency Wr
(2). Resonant Peak (Mr)
(3). Bandwidth (WO)
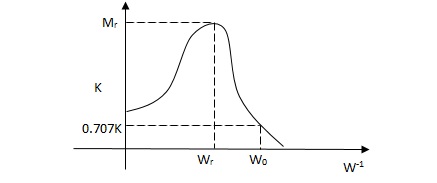
(1). Resonant Freq
It is frequency at which CL system magnitude is maximum.
(2). Resonant Peak
Max magnitude of CL system is called Mr.
(3). BW
It is range of freq whose CL sys mag >/ 0.707 times the 0 freq. Mag.
CLTF = w2n/S2 + 2 ξwnS + w2n
CLTF = w2n/-w2 + j2 ξwnw + w2n
= 1/-(w/wn)2 + j2 ξw/wn + 1
= 1/1 - µ2 + 2 ξµj
|µ| = 1/√(1-µ)2 + (2 ξµ)2
d µ/d µ = 0
µ = √1 - 2 ξ2
w/wn = √1 - 2 ξ2
wr = wn√1 - 2 ξ2
|Mr| = 1/√(1 – (w/wn)2)2 + (2 ξw/wn)2
|Mr| = 1/2 ξ√(1 –ξ2
BW = wr[1 – 2G2S + √4ξ4 + 4ξ2 + 2]1/2
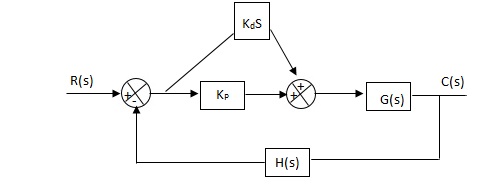
Used to improve the stability without affecting much the steady state error.
PID controller:
Gc(S) = Kp + Ki/S + KdS
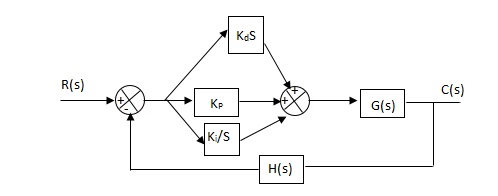
It improves the stability. It decreases the steady state error and both are proportional to Kp.
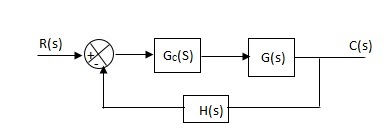
Q. The block diagram of a system using PI controllers is shown in the figure. Calculate:
(a). The steady state without and with controller for unit step input?
(b). Determine TF of newly constructed sys. With controller so, that a CL Poles is located at -5?

(a). Without:
C(S)/R(S) = 0.2/(S + 1)
C(S) = R(S) 0.2/(S + 1) + 0.2
For unit step
Ess = 1/1 + Kp
Kp = lt G(S)
S 0
= lt 0.2/(S + 1)
S 0
Kp = 0.2
Ess = 1/1.2 = 5/6 = 0.8
(b). With controller:
Gc(S) = Kp + Ki/S
G’(S) = Gc(S).G(S)
= ( Kp + Ki/S )0.2/(S + 1)
= (KpS + Ki)0.2/S(S + 1)
Ess = 1/1 + Kp = 0
So, the value of ess is decreased.
(b). Given
Kpi/Kp = 0.1
G’(S) = (Kp + Ki/S)(0.2/S + 1)
= (KpS + Ki)0.2/S(S + 1)
As a pole is to be added so, we have to examine the CE,
1 + G’(S) = 0
1 + (Kp + Ki)0.2/S(S + 1) = 0
S2 + S + 0.2KpS + 0.2Ki = 0
S2 + (0.2Kp + 1)S + 0.2Ki = 0
Given,
Kpi = 0.1Ki
Kp = 10Ki
S2 + (2Ki + 1)S + 0.2Ki = 0
Pole at S = -5
25 + (2Ki + 1)(-5) + 0.2Ki = 0
-10Ki – 5 + 25 + 0.2Ki = 0
-9.8Ki = -20
Ki = 2.05
Kp = 10Ki
= 20.5
Now,
G’(S) = (KpS + Ki)(0.2)/S(S + 1)
= (20.5S + 2.05)(0.2)/S(S + 1)
G’(S) = 4.1S + 0.41/S(S + 1)
Q. The block diagram of a system using Pd controller is shown, the PD is used to increase ξ to 0.8. Determine the T.F of controller?

(1). Kp = 1
Without controller:
C(S)/R(S) = 16/S2 + 1.6S + 16
wn = 4
2 ξwn = 16
ξ = 1.6/2 x 4 = 0.2
(b). With derivative:
ξS = 0.2 to 0.8
Undamped to critically damped,
G’(S) = (1 + KdS)(16)/(S2 + 1.6S)
CE:
S2 + 1.6S + 16(1 + KdS) = 0
S2 + (1.6 + Kd)S + 16 = 0
2 ξwn = 1.6 + Kd1.6
wn = 4
ξS = 0.8
2 x 4 x 0.8 = 1.6 + Kd1.6
4.8/16 = Kd
Kd = 0.3
TF = (1 + 0.3S)16/S(S + 16)
As PID Controller are used in plans. It the design of control parameter of plant can be easily determined then various techniques can be used to determine the transient and steady state specifications of the used loop system. But if we can design the mathematical model due to complexity, then process of selecting controller parameter is called Tuning of PID Controller.
Ziegler-Nichol Method
They proposed the rules for determining values of proportional gain kp, derivative hire Td and integral time Ti. They have proposed fro (1) methods.
1) First Method: The basic PID controller is shown in figure below. In this method a unit step response of a plant. Is obtained if the plant has neither integrators non dominant complex conjugal poles, then the output step curve is of shape s. As shown below. This curves are generated experimentally.
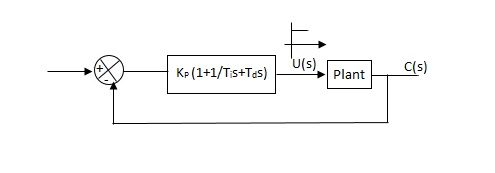
Fig. PID Controller
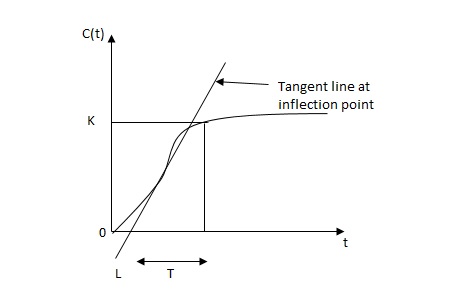
Fig: S-Shaped Response Curve

c(s) / l(s) = ke-l1s / ts+1
The values of KP, Ti and td should be set according to the table suggested by Ziegler Nichols tuning rules shown below.
Type of controller
Types of controller | Kp | Ti | Td |
|
P | T/L | 00 | 0 |
|
PI | 0.9T/L | L/0.3 | 0 |
|
PID | 1.2T/L | 2L | 0.5L |
|
Controller gain Gc(s)= kp(1+1/Tis+Tds)
= 1.2T / L(1+1 / 2LS+0.5 LS)
= 1.2t/l+0.6t / L2S+0.6TS
= 0.6T(2/L+1/L2S+S)
Gc(s) = 0.6 T(S+1/L)2/S
Thus, the PID controller has a pole at the origin and double zeros at S=-1/ L
2) Second Method -
1) Firstly set Ti= and Td=0
2) Use proportional control action only, increase kp from 0 to Kcr (Critical value).
3) Then Kcr and pcr (period) are determined experimentally.

Fig. Closed loop with proportional controller
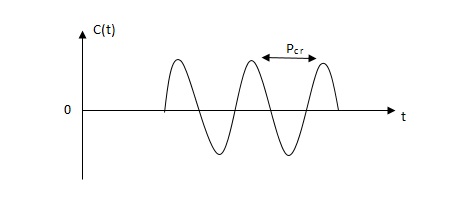
Fig. Sustained oscillation with period pcr.
4)For this method Ziegler Nichols suggested new set of values for kp ,ti and td shown in table below.
Types of controller | KP | TI | Td |
P | 0.5Kcr |  | 0 |
PI | 0.45 KCR | 1/1.2PCR | 0 |
PID | 0.6KCR | 0.5PCR | 0.125PCR |
|
|
|
|
GC(S) = KP(1.1/Tis+Tds)
=0.6 Kcr(1+1/0.5PcrS+ 0.125 PCRS)
=0.075 KcrPcr(s+4/Pcr)2 / s
Thus, the PID controller has a pole at the origin and double zeros at s= -4/Pcr
Necessity
- In order to obtain the desired performance of the system, we use compensating networks. Compensating networks are applied to the system in the form of feed forward path gain adjustment.
- Compensate an unstable system to make it stable.
- A compensating network is used to minimize overshoot.
- These compensating networks increase the steady state accuracy of the system. An important point to be noted here is that the increase in the steady state accuracy brings instability to the system.
- Compensating networks also introduces poles and zeros in the system thereby causes changes in the transfer function of the system. Due to this, performance specifications of the system change.
Methods of Compensation
- Connecting compensating circuit between error detector and plants known as series compensation.
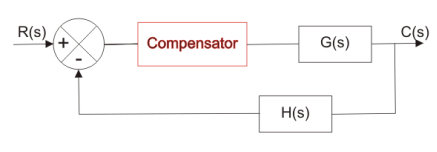
Fig.: Series Compensator
2. When a compensator used in a feedback manner called feedback compensation.
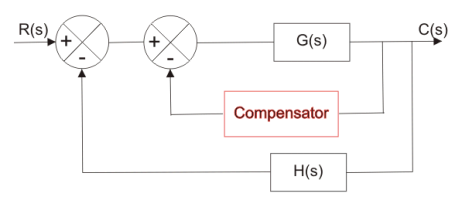
Fig.: Feedback Compensator
3. A combination of series and feedback compensator is called load compensation.
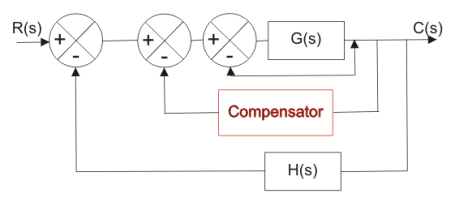
Fig.: Load Compensator
Phase Lead Compensation
A system which has one pole and one dominating zero (the zero which is closer to the origin than all over zeros is known as dominating zero.) is known as lead network. If we want to add a dominating zero for compensation in control system then we have to select lead compensation network.
The basic requirement of the phase lead network is that all poles and zeros of the transfer function of the network must lie on (-)ve real axis interlacing each other with a zero located at the origin of nearest origin.
Given below is the circuit diagram for the phase lead compensation network.
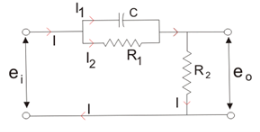
Fig.: Phase Lead Compensation Network
From above circuit we get,


Again 
Equating above expression of I we get,

Now let us determine the transfer function for the given network and the transfer function can be determined by finding the ratio of the output voltage to the input voltage.
So taking Laplace transform of both side of above equations,
 (neglecting initial condition)


 On substituting the α = (R1 +R2)/ R2 and T = {(R1R2) /(R1 +R2)} in the above equation.
Where, T and α are respectively the time constant and attenuation constant, we have
Transfer function, 
The above network can be visualized as an amplifier with a gain of 1/α. Let us draw the pole zero plot for the above transfer function.
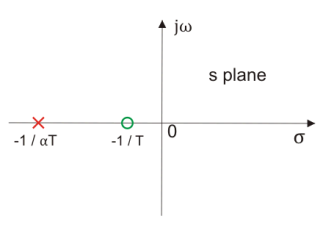
Fig.: Pole Zero Plot of Lead Compensating Network
Clearly we have -1/T (which is a zero of the transfer function) is closer to origin than the -1/(αT) (which is the pole of the transfer function).Thus we can say in the lead compensator zero is more dominating than the pole and because of this lead network introduces positive phase angle to the system when connected in series.
Let us substitute s = jω in the above transfer function and also we have α < 1. On finding the phase angle function for the transfer function we have
 Now in order to find put the maximum phase lead occurs at a frequency let us differentiate this phase function and equate it to zero. On solving the above equation we get

Where, θm is the maximum phase lead angle. And the corresponding magnitude of the transfer function at maximum θm is 1/a.
Effect:
- The velocity constant Kv increases.
- The slope of the magnitude plot reduces at the gain crossover frequency so that relative stability improves and error decrease due to error is directly proportional to the slope.
- Phase margin increases.
- Response become faster.
Advantages:
- Due to the presence of phase lead network the speed of the system increases because it shifts gain crossover frequency to a higher value.
- Due to the presence of phase lead compensation maximum overshoot of the system decreases.
Phase Lag Compensation
A system which has one zero and one dominating pole ( the pole which is closer to origin that all other poles is known as dominating pole) is known as lag network. If we want to add a dominating pole for compensation in control system then, we have to select a lag compensation network.
The basic requirement of the phase lag network is that all poles and zeros of the transfer function of the network must lie in (-)ve real axis interlacing each other with a pole located or on the nearest to the origin.
Given below is the circuit diagram for the phase lag compensation network.
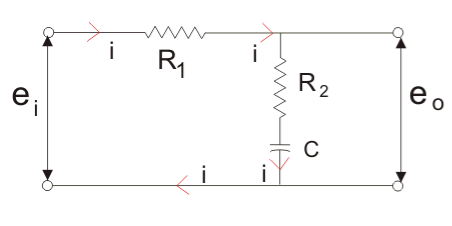
Fig.: Phase Lag Compensating Network
We will have the output at the series combination of the resistor R2 and the capacitor C.
From the above circuit diagram, we get

 The transfer function for the given network and the transfer function can be determined by finding the ratio of the output voltage to the input voltage.
Taking Laplace transform of above two equation we get,


Transfer function, 

On substituting in the above equation (Where, T and
β are respectively the time constant and DC gain), we have
Transfer function 
The above network provides a high frequency gain of 1 / β. The pole zero plot for the above transfer function.
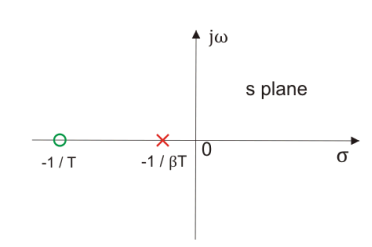
Fig.: Pole Zero Plot of Lag Network
Clearly we have -1/T (which is a zero of the transfer function) is far to origin than the -1 / (βT)(which is the pole of the transfer function). Thus, we can say in the lag compensator pole is more dominating than the zero and because of this lag network introduces negative phase angle to the system when connected in series.
Let us substitute s = jω in the above transfer function and also, we have a < 1. On finding the phase angle function for the transfer function we have

Now in order to find put the maximum phase lag occurs at a frequency let us differentiate this phase function and equate it to zero. On solving the above equation we get

 θm is the maximum phase lead angle. Remember β is generally chosen to be greater than 10.
Effect:
- Gain crossover frequency increases.
- Bandwidth decreases.
- Phase margin will be increase.
- Response will be slower before due to decreasing bandwidth, the rise time and the settling time become larger.
Advantages:
- Phase lag network allows low frequencies and high frequencies are attenuated.
- Due to the presence of phase lag compensation the steady state accuracy increases.
Phase Lag Lead Compensation
With single lag or lead compensation may not satisfied design specifications. For an unstable uncompensated system, lead compensation provides fast response but does not provide enough phase margin whereas lag compensation stabilize the system but does not provide enough bandwidth. So we need multiple compensators in cascade.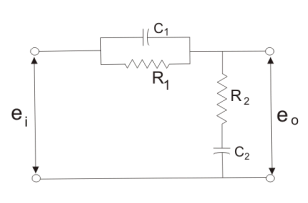
Fig.: Lag Lead Compensating Network
Now let us determine transfer function for the given network and the transfer function can be determined by finding the ratio of the output voltage to the input voltage.
Transfer function, 

On substituting the αT1 = R1C1, R2C2 = βT2, R1R2C1C2 = αβT1T2 and T1T2 = R1R2C1C2 in the above equation (where T1, T2 and α, β are respectively the time constants and attenuation constants). We have
Transfer function, 
Let us draw the pole zero plot for the above transfer function.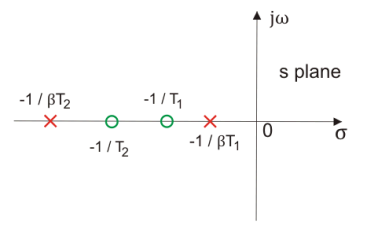
Fig.: Pole Zero Plot Lag Lead Network
Clearly we have -1/T (which is a zero of the transfer function) is far to the origin than the -1/(βT)(which is the pole of the transfer function). Thus we can say in the lag-lead compensation pole is more dominating than the zero and because of this lag-lead network may introduces positive phase angle to the system when connected in series.
Advantages:
- Due to the presence of phase lag-lead network the speed of the system increases because it shifts gain crossover frequency to a higher value.
- Due to the presence of phase lag-lead network accuracy is improved.
Comparison
Phase Lead Network | Phase Lag Network |
1>. It is used to improve the transient response. | It is used to improve the Steady state response. |
2>. It acts as a high pass filter. | It acts as a low pass filter. |
3>. The system becomes fast as Bandwidth increases as rise Time decreases. | The Bandwidth decreases through rise time the speed is slow. |
4>. As the circuit acts as differentiator, signal to noise ratio is poor. | Signal to noise ratio is higher as it an acts as integrator. |
5>. Maximum peak overshoot is reduced. | It reduces steady state error thus improve the steady state accuracy |
It is an electromechanical transducer which converts the
Mechanical energy into electrical energy. The input to the device is in the form of linear mechanical displacement when the voltage is applied across fixed terminals the output voltage is proportional to displacement.

Fig: Potentiometer Linear Relation
Vi input voltage
Vo output voltage
xi displacement from zero position
xt total length of translational potentiometer.
Servomechanism is also called servo which is a device usually error sensing device connected as a feedback element to correct the action of a mechanism. Here instead of controlling a device by variable input signal, the device is controlled by feedback signal.
The input signal applied to such systems generate the required output which is compared again to the input signal. If the device achieves its desired output, there will be no longer the logical difference between the two signals. Hence, the primary task of servomechanism is to maintain the output of a system at the desired value in the presence of disturbances.
Servomotors: These motors are used in feedback control system. These are also known as control motors. These motors should have low rotor inertia and high speed of response. The servomotors used in the feedback control systems should have linear control signal and rotor speed.
Types of Servomotors:
(a). A.C. Servomotors
(b). D.C. Servomotors
D.C. Servomotor:
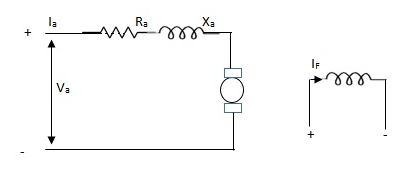
D.C. Servomotor are separately excited or permanent magnet dc servomotors. The armature of D.C. Servomotors is having large resistance and hence torque-speed characteristic is linear.
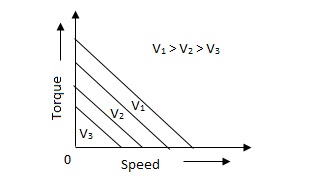
The above graph fig, clearly shows that the torque-speed characteristics is a function of control winding voltage as shown below.
T = mw + KVc -- (1)
Where T = Torque developed by motor
w = angular velocity
Vc = control winding voltage
Taking laplace of above equation (1),
T(S) = mS Q(S) + KVc - - (2)
T(S) = JS2Q(S) + FSQ(S) - - (3)
Above equation (3) is the dynamic equation with,
J – moment of inertia
F – coefficient of friction of motor
From equation (2) and (3) the block diagram will be,

Q(S)/Vc = K/Js + F + m - - (4)
Comparison between A.C. Servomotor & D.C. Servomotor
| A.C. Servomotor | D.C. Servomotor |
1. | They are less efficient | They are more efficient |
2. | They have low power output | They have high power output |
3. | No noise so have smooth operation | These motors have noisy operation |
4. | They do not have any radio frequency noise | These motors have brushes so produce radio frequency noise |
5. | They are maintenance free because of no brushes and slip rings | For these motors maintenance is required. |
References:
1) B. C. Kuo, “Automatic Control System”, Wiley India, 8th Edition, 2003.
2) Richard C Dorf and Robert H Bishop, “Modern control system”, Pearson Education, 12th edition, 2011.
3) D. Roy Choudhary, "Modern Control Engineering", PHI Learning Pvt. Ltd., 2005.