Unit - 1
Introduction

Fig 1. Block Diagram of DSP
To perform the processing digitally, there is a need for an interface between the analog signal and the digital processor. This interface is called an analog-to-digital (A/D) converter. The output of the AD converter is a digital signal that is appropriate as an input to the digital processor.
The digital signal processor may be a large programmable digital computer or a small microprocessor programmed to perform the desired operations on the input signal. It may also be a hardwired digital processor configured to perform a specified set of operations on the input signal.
Programmable machines provide the flexibility to change the signal processing operations through a change in the software, whereas hardwired machines are difficult to reconfigure. Consequently, programmable signal processors are in very common use.
On the other hand, when signal processing operations are well defined, a hardwired implementation of the operations can be optimized, resulting in a cheaper signal processor and, usually, one that runs faster than its programmable counterpart.
In applications where the digital output from the digital signal processor is to be given to the user in analog form, such as in speech communications, we must provide another interface from the digital domain to analog domain. Such an interface is called a digital-to-analog (D/A) converter. Thus the signal is provided to the user in analog form.
However, there are other practical applications involving signal analysis, where the desired information is conveyed in digital form and no D/A converter is required. For example, in the digital processing of radar signals, the information extracted from the radar signal, such as the position of the aircraft and its speed, may simply be printed on paper. There is no need for a D/A converter in this case.
Key takeaway
The digital signal processor may be a large programmable digital computer or a small microprocessor programmed to perform the desired operations on the input signal. It may also be a hardwired digital processor configured to perform a specified set of operations on the input signal.
1. Physical size of analog systems is quite large while digital processors are more compact and lighter in weight.
2. Analog systems are less accurate because of component tolerance ex R, L, C and active components. Digital components are less sensitive to the environmental changes, noise and disturbances.
3. Digital system is most flexible as software programs & control programs can be easily modified.
4. Digital signal can be stores on digital hard disk, floppy disk or magnetic tapes. Hence becomes transportable. Thus, easy and lasting storage capacity.
5. Digital processing can be done offline.
6. Mathematical signal processing algorithm can be routinely implemented on digital signal processing systems. Digital controllers are capable of performing complex computation with constant accuracy at high speed.
7. Digital signal processing systems are upgradeable since that are software controlled.
8. Possibility of sharing DSP processor between several tasks.
9. The cost of microprocessors, controllers and DSP processors are continuously going down. For some complex control functions, it is not practically feasible to construct analog controllers.
10. Single chip microprocessors, controllers and DSP processors are more versatile and powerful.
The sampling theorem, which is also called as Nyquist theorem, delivers the theory of sufficient sample rate in terms of bandwidth for the class of functions that are bandlimited.
The sampling theorem states that, “a signal can be exactly reproduced if it is sampled at the rate fs which is greater than twice the maximum frequency W.”
Let us consider a band-limited signal, i.e., a signal whose value is non-zero between some –W and W Hertz.
Such a signal is represented as x(f)=0 for ∣f∣>W
For the continuous-time signal x (t), the band-limited signal in frequency domain, can be represented as shown in the following figure.
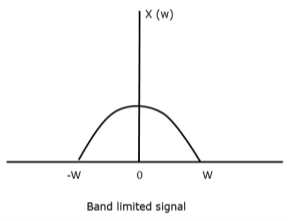
Fig 2. Band Limited Signal
If the signal x(t) is sampled above the Nyquist rate, the original signal can be recovered, and if it is sampled below the Nyquist rate, the signal cannot be recovered.
The following figure explains a signal, if sampled at a higher rate than 2w in the frequency domain.
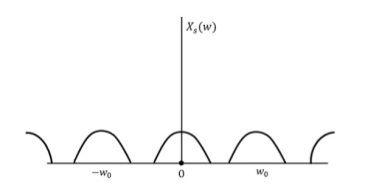
Fig 3. FT of xs(t)
The above figure shows the Fourier transform of a signal xs (t).
If fs<2W
The resultant pattern will look like the following figure.

Fig 4. Resultant Signal
Here, the over-lapping of information is done, which leads to mixing up and loss of information. This unwanted phenomenon of over-lapping is called as Aliasing.
Aliasing
Aliasing can be referred to as “the phenomenon of a high-frequency component in the spectrum of a signal, taking on the identity of a low-frequency component in the spectrum of its sampled version.”
Key takeaway
The sampling theorem, which is also called as Nyquist theorem, delivers the theory of sufficient sample rate in terms of bandwidth for the class of functions that are bandlimited.
Fs<2fm
Numerical:
1. The continuous-time signal x(t) = cos(200πt) is used as the input for a CD converter with the sampling period 1/300 sec. Determine the resultant discrete-time signal x[n].
Solution:
We know,
X[n] =x(nT)
= cos(200πnT)
= cos(2πn/3) , where n= -1,0,1,2……
The frequency in x(t) is 200π rad/s while that of x[n] is 2π/3.
2. Determine the Nyquist frequency and Nyquist rate for the continuous-time signal x(t) which has the form of:
X(t) = 1+ sin(2000πt) + cos (4000πt)
Solution:
The frequencies are 0, 2000π and 4000π.
The Nyquist frequency is 4000π rad/s and the Nyquist rate is 8000π rad/s.
3. Consider an analog signal.
xo(t) = 3 cos 50 π πt + 10 sin 300 π t + 3 cos 100 π t
Solution.
The frequency in the analog signal
F1 = 25 Hz, F2 = 150 Hz, F3 = 50 Hz
The largest frequency is
Fmax = F2 = 150 Hz
The Nyquist rate is
FN = 2 Fmax = 300 Hz
4. The analog signal
xo(t) = 3 cos 200 π π t + 15 sin 600 π t – 10 cos 12000 π t
- What is the Nyquist rate for this signal?
- Using a sampling rate FS = 5000 samples. What is discrete time signal obtained after sampling?
- What is analog signal yo(t) we can reconstruct from the samples if we use ideal interpolation?
Solution.
- The frequency of the analog signal are
F1 = 1 KHz, F2 = 3 KHz, F3 = 6 KHz
The Nyquist rate is
FN = 2 Fmax = 12 KHz
2. For x(n) = xa(nT) = xa 
= 3 cos 2 π  n + 5 sin 2 π
  n – 10 cos 2 π
  n
n
= 3 cos 2 π  n + 5 sin 2 π
  n – 10 cos 2 π
= 3 cos 2 π  n - 5 sin 2 π
  n – 10 cos 2 π
  n
n
= - 7 cos 2 π  n - 5 sin 2 π
  n
n
For FS = 5 KHz, the folding frequency is Fmax =  = 2.5 KHz
Hence F1 = 1 KHz is not effected by aliasing
F2 = 3 KHz is changed by the aliasing effect F2 = F2 – F1 = - 2 KHz
F3 = 6 KHz is changed by the aliasing effect F3’ = F3 – F2 = 1 KHz
So that normalizing frequencies are
f1 =  , f2 =
  , f3 =
The analog signal that we can recover is
ya(t) = - 7 cos 2000 π t – 5 cos 4000 π t
Which is different than the original signal xa(t)
5. xa(t) = 3 cos 100πt
- Find the minimum sampling rate required to avoid aliasing.
- If FS = 200 Hz, what is the discrete time signal after sampling?
- If FS = 75 Hz, what is the discrete time signal after sampling?
- What is the frequency F of a sinusoidal that yields sampling identical to obtained in part c?
Solution. a. Ω = 100π → F = 50 Hz
The minimum sampling rate is
FS = 2F = 100 Hz
And the discrete time signal is
x(n) = xa(nT) = 3 cos  = 3 cos π n = 3 cos 2 π
  n
n
b. If FS = 200 Hz , the discrete time signal is
x(n) = 3 cos  = 3 cos
  n – 3 cos 2 π
  n
n
c. If Fs=75Hz , the discrete time signal is
x(n) = 3 cos  = 3 cos
  n = 3 cos 2 π
  n
n
d. For the sampling rate FS = 75 Hz
F = f FS = f 75 and f = 1/3 in part in (c). Hence
F = 75/3 = 25 Hz
So, the analog sinusoidal signal is
ya(t) = 3 cos 2 π π Ft
= 3 cos 50 πt
6.Suppose a continuous-time signal x(t) = cos (Ø0t) is sampled at a sampling frequency of 1000Hz to produce x[n]: x[n] = cos(πn/4)
Determine 2 possible positive values of Ø0, say, Ø1 and Ø2. Discuss if cos(Ø1t) or cos(Ø2t) will be obtained when passing through the DC converter.
Solution:
Taking T= 1/1000s
Cos(πn/4) =x[n] = x(nT) = cos (Ø0n/1000)
Ø1 is easily computed as 
Ø1 = 250π
Ø2 can be obtained by noting the periodicity of a sinusoid:

Ø2 = 2250π
Sampling usually refers to conversion of continuous signal into short duration of pulses each pulse followed by a skip period when no signal is available. Below shown is a uniformly sampled signal.
Following are two popular sampling operations:
1. Single rate or periodic sampling
2. Multi-rate sampling
Figure below shows the structure and operation of a finite pulse width sampler, where 5(a) represents the basic block diagram and 5(b) illustrates the function of the same. T is the sampling period and p is the sample duration.

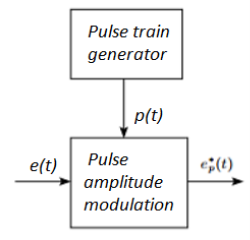
Figure 5 (a): Basic block diagram

Figure 6 (b): Sampler output
Finite pulse width sampler converts a continuous time signal into a pulse modulated or discrete signal. The most common type of modulation in the sampling and hold operation is the pulse amplitude modulation.
The block diagram of sampler is shown above, having a pulse train of p seconds and sampling period of T seconds.
p(t)= unit pulse train with period T
p(t)= 
Us(t)=unit step function

In frequency domain p(t) can be represented as
p(t)= 
 = 2π/T
Cn= 
p(t)=1 for 0≤ t ≤p
The output of the ideal sampler can be expressed as
f*(t)= 
F*(s)= 
The output of the sampler can be approximated as
Cn= 

Reconstruction process
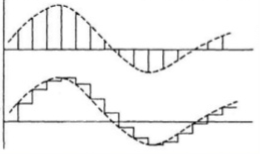
Fig 7. Sampled Data
The sampled data signal is modified by the controller. The hold circuit than converts the signal to analog form. The simplest hold circuit is ZOH (zero order hold) in which the reconstructed signal acquires the same value as the last received sample for the entire sampling period.
The basic sampler is shown in above figure (a) and output in figure (b). The high frequency signal present in the reconstructed signal is filtered by the controller elements which are the low pass in frequency behaviour.
The first or higher order holds have no advantage over the ZOH. In the first order hold the last two signal samples are used to reconstruct the signal for the current sampling period.
Aliasing
Aliasing can be referred to as “the phenomenon of a high-frequency component in the spectrum of a signal, taking on the identity of a low-frequency component in the spectrum of its sampled version.”
Key takeaway
We can simply avoid aliasing by sampling the signal at a higher rate than the Nyquist rate (Fs>Fm). Or, we can use anti-aliasing filters. These are special low-pass filters that are usually found in the initial stages of any digital signal processing operation. The anti-aliasing filters attenuate the unnecessary high-frequency components of a signal. They band-limit the input signal by removing all frequencies higher than the signal frequencies.
Examples
1) The continuous-time signal x(t) = cos(200πt) is used as the input for a CD converter with the sampling period 1/300 sec. Determine the resultant discrete-time signal x[n].
Solution:
We know,
X[n] =x(nT)
= cos(200πnT)
= cos(2πn/3), where n= -1,0,1,2……
The frequency in x(t) is 200π rad/s while that of x[n] is 2π/3.
2) Determine the Nyquist frequency and Nyquist rate for the continuous-time signal x(t) which has the form of X(t) = 1+ sin(2000πt) + cos (4000πt)
Solution:
The frequencies are 0, 2000π and 4000π.
The Nyquist frequency is 4000π rad/s and the Nyquist rate is 8000π rad/s.
3) Consider an analog signal xo(t) = 3 cos 50 ππ t + 10 sin 300 π t + 10 sin 300 π t + 3 cos 100 π t
Solution:
The frequency in the analog signal
F1 = 25 Hz, F2 = 150 Hz, F3 = 50 Hz
The largest frequency is
Fmax = F2 = 150 Hz
The Nyquist rate is
FN = 2 Fmax = 300 Hz
4) The analog signal xo(t) = 3 cos 2000 ππ t + 15 sin 6000 π t - 10 cos 12000 π t
- What is the Nyquist rate for this signal?
- Using a sampling rate FS = 5000 samples. What is discrete time signal obtained after sampling?
- What is analog signal yo(t) we can reconstruct from the sample if we use ideal interpolation?
Solution:
- The frequency of the analog signal is
F1 = 1 KHz, F2 = 3 KHz, F3 = 6 KHz
The Nyquist rate is
FN = 2 Fmax = 12 KHz
3. For x(n) = xa(nT) = xa 
= 3 cos 2 π  n + 5 sin 2 π
  n – 10 cos 2 π
  n
n
= 3 cos 2 π  n + 5 sin 2 π
  n – 10 cos 2 π
= 3 cos 2 π  n - 5 sin 2 π
  n – 10 cos 2 π
  n
n
= - 7 cos 2 π  n - 5 sin 2 π
  n
n
For FS = 5 KHz, the folding frequency is Fmax =  = 2.5 KHz
Hence F1 = 1 KHz is not effected by aliasing
F2 = 3 KHz is changed by the aliasing effect F2 = F2 – F1 = - 2 KHz
F3 = 6 KHz is changed by the aliasing effect F3’ = F3 – F2 = 1 KHz
So that normalizing frequencies are
f1 =  , f2 =
  , f3 =
The analog signal that we can recover is
ya(t) = - 7 cos 2000 π t – 5 cos 4000 π t
5) For given signal xa(t) = 3 cos 100πt
- Find the minimum sampling rate required to avoid aliasing.
- If FS = 200 Hz, what is the discrete time signal after sampling?
- If FS = 75 Hz, what is the discrete time signal after sampling?
- What is the frequency F of a sinusoidal that yields sampling identical to obtained in part c?
Solution. a. 𝛀 = 100𝛀 = 100𝛑 →F = 50Hz
The minimum sampling rate is
FS = 2F = 100 Hz
And the discrete time signal is
x(n) = xa(nT) = 3 cos  = 3 cos π n = 3 cos 2 π
  n
n
b. If FS = 200 Hz , the discrete time signal is
x(n) = 3 cos  = 3 cos
  n – 3 cos 2 π
  n
n
c. If Fs=75Hz , the discrete time signal is
x(n) = 3 cos  = 3 cos
  n = 3 cos 2 π
  n
n
d. For the sampling rate FS = 75 Hz
F = f FS = f 75 and f = 1/3 in part in (c). Hence
F = 75/3 = 25 Hz
So, the analog sinusoidal signal is
ya(t) = 3 cos 2 π π Ft
= 3 cos 50 π t
6) Suppose a continuous-time signal x(t) = cos (Ø0t) is sampled at a sampling frequency of 1000Hz to produce x[n]: x[n] = cos(πn/4). Determine 2 possible positive values of Ø0, say, Ø1 and Ø2. Discuss if cos(Ø1t) or cos(Ø2t) will be obtained when passing through the DC converter.
Solution:
Taking T= 1/1000s
Cos(πn/4) =x[n] = x(nT) = cos (Ø0n/1000)
Ø1 is easily computed as as 
Ø1 = 250π
Ø2 can be obtained by noting the periodicity of a sinusoid:

Ø2 = 2250π
Discrete time systems
A discrete-time system is anything that takes a discrete-time signal as input and generates a discrete-time signal as output. The concept of a system is very general. It may be used to model the response of an audio equalizer or the performance of the US economy. In electrical engineering, continuous-time signals are usually processed by electrical circuits described by differential equations.
For example, any circuit of resistors, capacitors and inductors can be analysed using mesh analysis to yield a system of differential equations. The voltages and currents in the circuit may then be computed by solving the equations. The processing of discrete-time signals is performed by discrete-time systems. Similar to the continuous-time case, we may represent a discrete-time system either by a set of difference equations or by a block diagram of its implementation. For example, consider the following difference equation.
y[n] = y[n − 1] − 2x[n] + 3x[n − 1]
This equation represents a discrete-time system. It operates on the input signal x[n] to produce the output signal y[n]. This system may also be defined by a system diagram as in Figure.

Fig:8 Diagram of a discrete-time system.
Discrete-time digital systems are often used in place of analog processing systems. Common examples are the replacement of photographs with digital images, and conventional NTSC TV with direct broadcast digital TV. These digital systems can provide higher quality and/or lower cost through the use of standardized, high-volume digital processors.
Discrete time signal:
If a discrete variable x(t) is defined at discrete time then x(t) is a discrete time signal. A discrete time signal is often identified as a sequence of number denoted by x(n), where ‘n’ is an integer.
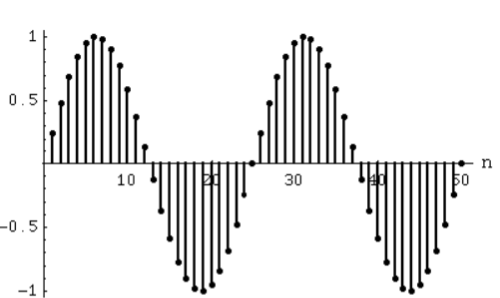
Fig:9 Discrete time signal
Even and Odd Signals
The even signals are symmetrical about Y-axis. They lie in first and second quadrants.
x[-n]=x[n]
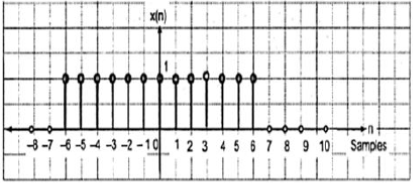
Fig:10 Even signal
The odd signals are symmetrical about origin. They lie in first and third quadrants.
x[-n]= -x[n]

Fig:11 Odd signal
A signal having even and odd parts is mixed signal.
Periodic and Non-periodic signals:
A signal which repeats itself after a particular period of time is called as Periodic signal. The condition for any signal to be periodic is
x(n+N) = x(n)
Considering a cosine signal −
x(n)=A cos(2πf0n+θ) x(n)= A cos(2πf0n+θ)
x (n +N) = A cos (2πf0(n +N) +θ)
=A cos(2πf0n+2πf0N+θ) x (n+ N)
=A cos (2πf0(n +N) +θ) =A cos(2πf0n+2πf0N+θ)
=A cos(2πf0n+2πf0N+θ) = A cos(2πf0n+2πf0N+θ)
For the signal to become periodic, following condition should be satisfied;
X (n+ N) = x(n) x (n +N) = x(n)
A cos(2πf0n+2πf0N+θ) =A cos(2πf0n+θ)
A cos(2πf0n+2πf0N+θ) = A cos (2πf0n+ θ)
As, 2πf0N is an integral multiple of 2π
2πf0N=2πK
N=Kf0
Frequencies of discrete sinusoidal signals are separated by integral multiple of 2π.
Energy and Power Signals
Energy Signal
Energy of a discrete time signal is denoted as E. It can be written as
E = 
If each individual values of x(n)x(n) are squared and added, we get the energy signal. Here x(n) is the energy signal and its energy is finite over time i.e 0<E<∞
Power Signal
Average power of a discrete signal is represented as P. This can be written as
P = 
Key takeaway
E = 
P = 
A linear time-invariant system is represented by its impulse response. If X(t) is the input signal to the system, then output is represented as
Y(t) =  =
=  ---------------(1)
The above integral is called convolution of h and X where
Y(t) = h(t) * X(t) = X(t) * h(t) -----------------------------(2)
The impulse response can be obtained is the input is unit impulse function. For discrete-time systems the output is written as
Y(n) = h(n) * X(n) = X(n) * h(n) =  =
=  --------(3)


LTI systems and their properties
1) Convolution sum:


2) Convolution Integral:


3) Commutative Property:
x*h=h*x
4) Associative Property:
x*[h1*h2] = [x*h1] * h2
5) Distributive Property:
x*[ h1+h2] = [x*h1] + [x*h2]
6) Causality:
x[n]=0 for n<0
7) Stability:

8) Memoryless:
If x[n]=0 for all n≠0
9) Invertibility:
A system is said to be invertible if there exists an inverse system which when connected in series with the original system produces an output identical to input.
(x*δ)[n]=x[n]
(x*h*h-1) [n]=x[n]
(h*h-1) [n]=δ[n]
Considering an LTI system with input as impulse signal. As we know that impulse response of any system gives complete describes the behavior of any LTI system. Basically, we decompose the input signal first. The apply input as impulse and obtain the corresponding output. Obtained output is then graphically analysed.
Let input signal be x[n]

The output obtained when we apply input as unit sample sequence for n=k
y[n,k] = h[n,k] = H[ [n-k]]
Where n= time index
k = location of input impulse parameter
The x[n] because of input weighted sum of output will be
y[n] = H[x[n]]
= H [ ]
]
But y[n,k] = h[n,k] = H[δ[n-k]]
Hence, the output will now be
y[n] = [
= ] (Due to superposition theorem)
Now, by time invariance property we can write
h[n]= H [δ[n]]
For delayed sequence we have
h[n-k] =H [ ]
]
Hence, the output equation can now be written as
y[n] = [
The above equation is called as convolution sum.
y[n]= x[n] * h[n]
Example
Que) For sequence h[n]={ 1, 2 , 1, -1} determine the response of system with input signal x[n] = {1, 2 ,3 ,1}
Sol:
a) Finding x[k] and h[k] i.e n=k.
b) Folding h[k] we get h[-k].
c) Then shifting the above signal[-k] we get h[1-k]
d) Multiplying above signal h[1-k] with x[n].
e) Again, incrementing h[1-k] by 1 we get h[2-k] multiplying with x[n].
f) Continuing this process till we get 0 for output y. In this case for n=5.
The graphical representation is shown below.


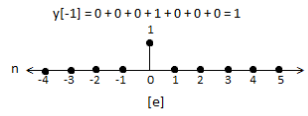


Convolution by tabulation method
In this method we form a table type structure and find the convolution of x[n] and h[n]. We will understand this by solving an example.
Que) For h[n] = {1, 2, 1, -1}, x[n] = {1, 2, 3, 1}. Find x[n]*h[n]?
Sol:

y[-1] = 1
y[0]= 2+2 = 4
y[1] = 1+4+3 = 8
y[2]= -1+2+6+1 = 8
y[3]= -2+3+2 = 3
y[4]= -3+1 = -2
y[5]= -1
y[n]= {1, 4, 8, 8, -2, -1}
The above sequence is the required convolution of x[n] and h[n].
Properties of Linear Convolution
Commutative Law
x(n) * h(n) = h(n) * x(n)
X(n) → Unit Sample Response = h(n) → Response = y(n) = x(n) * h(n)
Y(n) → Unit Sample Response = x(n) → Response = y(n) = h(n) * x(n)
Associate Law
[ x(n) * h1(n) ] * h2(n) = x(n) * [ h1(n) * h2(n) ]
X(n) → Unit Sample Response = h1(n) → Unit Sample Response = h2(n) 
X(n) → Unit Sample Response h(n) = h1(n) * h2(n) → Response
Distribute Law
x(n) * [ h1(n) + h2(n) ] = x(n) * h1(n) + x(n) * h2(n)
Example
Q1)
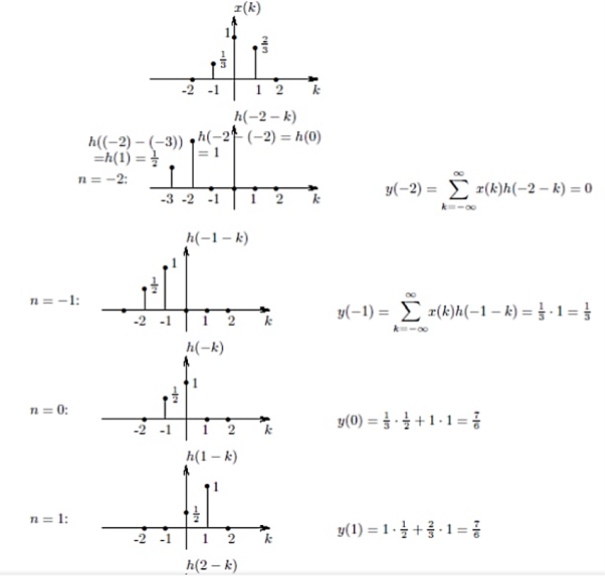
Let us find the response to  . The impulse response h of the system is the response to the unit impulse:
A1)
(1) flip h;
(2) for a fixed n, shift h by n;
(3) for the same fixed n, multiply x(k) by h(n-k), for each k;
(4) Sum the products over k; 

y(n) = 
Cross correlation is the measure of similarity between two different signals.
Consider two signals x1(t) and x2(t). The cross correlation of these two signals R12(τ)is given by
R12(r) = 

If signals are complex then
R12(r) = 

R12(r) = 

It is defined as correlation of a signal with itself. Auto correlation function is a measure of similarity between a signal & its time delayed version. It is represented with R(τ).
Consider a signals x(t). The auto correlation function of x(t) with its time delayed version is given by
R11(r) = R(r) = 

Where τ = searching or scanning or delay parameter.
If the signal is complex then auto correlation function is given by
R11(r) = R(r) = 

References:
1. Digital signal processing- A practical approach Second Edition, 2002.E. C. Ifeachar, B. W. Jarvis PearsonEducation
2. Sanjit K. Mitra, ‘Digital Signal Processing – A Computer based approach’
3. S. Salivahanan, A Vallavaraj, C. Gnanapriya, ‘Digital Signal Processing’, 2nd Edition McGraw Hill.
4. A. Nagoor Kani, ‘Digital Signal Processing’, 2nd Edition McGraw Hill.
5. P. Ramesh Babu, ‘Digital Signal Processing’ Scitech