Unit-2
Wireless Channel Modelling
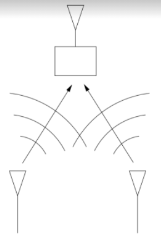
The uplink model for discrete time is shown below. The equation for output can be given as
y[m] = x1[m]+x2[m]+w]m]
The performance of the channel can be achieved by knowing the capacity of the channel. The communication can be achieved by R<C and for R>C communication is not possible.
For multiuser case this range needs to be increased say for range (R1, R2). Which means that both the users can communicate at rates R1 and R2. There is trade off between the communication rates as the users share same bandwidth.

Fig 1 Uplink two-user
The symmetric capacity
Csym =  R
R
The sum capacity is Csum =  R1+R2
R1+R2
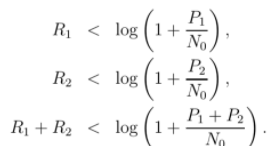
The capacity region for AWGN channel is shown below


Fig 2 Capacity region of two-user uplink AWGN
The power of the received signal is the sum of the powers of individual received signals. The receiver will decode the information from both users. While decoding the first user signal it takes user 2 signal as gaussian noise and vice versa. This is called as successive interface cancellation. The point B can be found if we reverse the order of cancellation.
The above figure 2
R2= log (1+ ) – log(1+
 )
)
User 1 can achieve its single-user bound while at the same time user 2 can get a non-zero rate, in fact as high as its rate at point A above equation. By time sharing between multiple access the other points between AB can be found. We can increase both user rates by moving near to point on AB.
Key takeaway
The operating points which are not as per the requirement than we have consider that corner where the strong user is decoded first. By doing this the weak user gets the best rate it can.
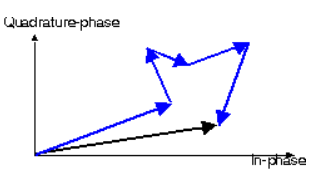
The Rayleigh fading occurs due to multipath reception. When there are N number of scattered waves which are received at the mobile antenna than the power received by the moving antenna is a random variable. The phasor representation is shown below.

Fig 3 Phasor for Rayleigh Fading
Let Cn be the amplitude of nth reflected wave. Then the transmitted signal is
V(t) = cos(wct+ )
)
The signal received will be given as
r(t) = 
The quadrature phase component can be given as
Q(t) = 
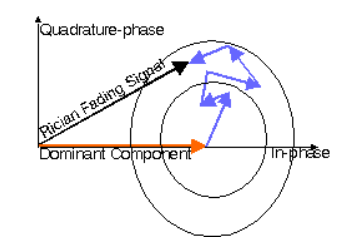
There is a dominant component present in this model. The component which is dominant can be a LoS (line of sight). The antenna also receives many reflected and scattered waves. The phasor sum of two or more dominant signals can also be LoS. The phasor for this is shown below.

Fig 4 Phasor for Rician Fading Signal
A sinusoidal transmitted carrier is taken with narrowband propagation channel
S(t) = cos wct
The received signal from Rician path is given by
V(t) = C cos wct+
Where C= amplitude of LoS
 = amplitude of nth reflected wave
 = phase of nth reflected wave
The ratio of signal power in dominant component to the scattered power is called as Rician factor denoted by k.
Key takeaway
If antenna is kept still or its speed is zero than there is no fading due to no fluctuations in signals.
Rayleigh fading is for C=0
This model matches the empirical results for short wave ionospheric propagation. When Rayleigh fading signal combines with k branch maximum ratio combination the Nakagami fading is found. When there is large delay time spread for multipath scattering Nakagami fading occurs.
This fading occurs with cluster of reflected waves. The phase of individual reflected waves is different for one cluster. The envelop of each cluster is Rayleigh distributed. There can be interference when the bit time of signal is more than delay time.
The Nakagami model is equivalent to the Rician model. But it is not exactly same in all cases. This approximation holds good for the body of probability density function but not for its tail.
Key takeaway
The Nakagami distributed signal amplitude is obtained when the sum of multiple independent signals is Rayleigh distributed.
This model has the information which is graphical based on the Okumara model. This model is used to predict the path loss in urban areas. This mode mainly has the waves which are reflected, diffracted and scattered from the obstacles. The parameters for this model are
- Frequency Range: 150 MHz to 1500 MHz
- Transmitter Height: 30 m to 200 m
- Link distance: 1 km to 20 km
- Mobile Station (MS) height: 1 m to 10 m
For urban area the model is as below
LU = 69.55+26.16 logf – 13.28loghB- CH + (44.9-6.55loghB) logd
The area for which antenna height is >10m
CH = 0.8 + (1.1 logf – 0.7) hM – 1.56logf
For Large Cities
CH = 8.29(log(1.54hM))2 – 1.1 for 150MHz<f<200MHz
= 3.2(log(11.75hM))2 – 4.97 for 200MHz<f<1500MHz
LU= Path loss in Urban Areas
hB= Height of base station antenna in meters (m)
hM= Height of mobile station antenna in meters (m)
f= Frequency of Transmission in megahertz (MHz).
CH= Antenna height correction factor
The Hata model equation for suburban areas is given by
LSU = LU – 2(log )2 – 5.4
LSU = Path loss in suburban areas in decibels (dB)
LU = Average Path loss in urban areas in decibels (dB)
f = Frequency of Transmission in megahertz (MHz).
The Hata model for areas with less obstruction is
Lo = LU – 4.78(logf)2 + 18.33logf – 40.94
LO = Path loss in open area. Unit: (dB)
LU = Path loss in urban area. Unit: decibel (dB)
f = Frequency of transmission. Unit: (MHz)
Key takeaway
The above model has one disadvantage that it has slow response to rapid terrain changes.
A channel is basically the medium of transmission. The information from the transmitter is transmitted through a channel to receiver. This channel ca be a wired medium or a wireless medium. The physical process which can affect any signal is calculated in channel modelling.
The main mechanism for transmission of any signal is
Reflection
- Reflections Occurs when a wave impinges upon a smooth surface.
- Dimensions of the surface are large relative to l.
- Reflections occur from the surface of the earth and from buildings and walls.
Diffraction
- Diffraction Occurs when the path is blocked by an object with large dimensions relative to l and sharp irregularities (edges).
- Secondary “wavelets” propagate into the shadowed region.
- Diffraction gives rise to bending of waves around the obstacle.
Scattering
- Scattering Occurs when a wave impinges upon an object with dimensions on the order of l or less, causing the reflected energy to spread out or “scatter” in many directions.
- Small objects such as street lights, signs, & leaves cause scattering
Key takeaway
The wired channels are fast, secure and low cost but have short range.
Stochastic Model
The main purpose of a stochastic model for large-scale variations is to aid the design of the power and rate control algorithms, feedback schemes, admission control, and other functions in the upper layers of the standard network stack. A stochastic description of small-scale fading is an approach well suited to model many types of fading channels in the sense that it correctly predicts the significant difference between the rates achievable over a fading channel in comparison with the capacity of a channel that is only affected by AWGN.
It is non-frequency selective fading. The channel has constant gain and its phase response is also linear but has BW greater than the transmitted signal. The received signal frequency components fluctuates simultaneously in same proportion. The major flat fading can cause fade up to 30dB
Key takeaway
It can be described by Rayleigh Distribution
The channel has constant gain and its phase response is also linear but has BW smaller than the transmitted signal. There is inter symbol interference due to time dispersion of symbol within the channel. There is unequal effect on the different spectral components. The frequency selective fading channel is also known as wideband channel.
Reference
1. T.S. Rappaport, “Wireless Communication-Principles and practice”, Pearson
Publications, Second Edition.
2. Misra, Wireless Communication & Network: 3G & Beyond, McGraw Hill Education
3. Jaganathan, Principles of Modern Wireless Communication System, McGraw Hill Education
4. Upena Dalal, “Wireless Communication and Networks”, Oxford Press Publications.
5. T L Singal, “Wireless Communications”, McGraw Hill Education.