UNIT III
Financial Statement analysis: Ratio analysis

Definition
The nature and importance of financial statements are described on the previous page. It is explained that the facts disclosed by the financial statements have remarkable significance for various parties interested in the financial situation of business concerns. Financial statements help executives to assess the impact of decisions, assess performance, review and implement corrective actions.
In fact financial statements render valuable services to owners, employees, customers, suppliers and governments in their respective areas of interest. Financial statements are useful and meaningful only when they are analysed and interpreted.
Models, bank lending decision models, and corporate financial management models.”
Purpose of Financial Statement Analysis:
The main purpose of financial table analysis is to provide decision-makers information about business companies for use in decision making. Users of the Financial daily are decision makers involved in assessing the economic situation of a company and predicting its future course. Financial table analysis can be used by different users and decision makers to achieve the following objectives:
1. Evaluation of past performance and current position:
A good indicator of future performance is denoted by Past performance Therefore, the investor or creditor is interested in the trend of past sales, expenses, net profit, cash flow and return on investment. These trends provide a means to determine the past performance of management and are a possible indicator of future performance. Similarly, an analysis of the current position shows where the business stands today. For example, the current position analysis shows the types of assets owned by the enterprise and the various liabilities incurred for the enterprise. It tells you what the cash position is, the amount of debt the company have in relation to capital, and how reasonable the inventory and receivables are.
2. Forecast net income and growth prospects:
Financial table analysis helps to predict the revenue outlook and growth rate of earnings used by investors while comparing other users interested in determining investment options and the profitability potential of a business company. Investors also consider the risks or uncertainties associated with the expected returns.
Decision makers are futurists and are always interested in the future. Financial statements containing information about past performance are analyzed and interpreted as a basis for predicting future returns and assessing risks.
3. Predicting bankruptcy and failure:
Financial table analysis is an important tool in predicting the probability of bankruptcy and failure of a business enterprise. After being aware of possible failures, both managers and investors can take precautions to avoid/minimize losses. Enterprise management can go for a change in management policy, reorganization of the financial structure, or even voluntary liquidation to reduce the length of time loss.
In the field of accounting and finance, empirical studies conducted suggest a set of financial ratios that can give an early signal of the failure of the enterprise. Such predictive models supported financial table analysis is useful for managers, investors and creditors.
Investors and shareholders can use the model to make optimal portfolio selection and bring about changes in investment strategies according to their investment goals. Similarly, creditors can apply predictive models while assessing the creditworthiness of the commercial enterprise.
4. Lending decisions by financial institutions and banks:
Financial table analysis is used by financial institutions, lending institutions, banks, etc. to make sound lending or credit decisions. Thus, they can make an appropriate allocation of credit between different borrowers. Financial table analysis helps to determine credit risk, the terms of the loan if approved, interest rates, maturity dates, etc.
Financial statement analysis techniques:
In the analysis of financial data, various technologies are used to evaluate the position of the enterprise, emphasizing the comparative and relative importance of the presented data. These techniques are widely used in the following:
(1) Horizontal analysis,
(2) Vertical Analysis,
(3) Trend Analysis and
(4) Ratio analysis.
(1) Horizontal analysis:
The analysis of the percentage increase or decrease of the corresponding item in the comparative financial statements is called horizontal analysis. Horizontal analysis includes the calculation of the change in the amount of money and the change in the percentage from the previous year to the current year. The amount of each item in the latest statement is compared to the corresponding item in another previous statement.
An increase or decrease in the amount of items is listed, together with a percent of the increase or decrease. Make a comparison and use the statements in the table. If the horizontal analysis contains three or more statements, there are two options for choosing a base.
First, the earliest date or period can be used as a basis for comparing all later dates or periods, or secondly, each sentence can be used as a basis for comparing the previous sentence.
Exhibit 17.1: comparative balance sheet with horizontal analysis
ABC company limit, balance sheet
December 31, 2009 and December 31, 2008
| In Rs.000 | Increase (decrease) | ||
2009 Rs | 2008Rs | Amount Rs | Percentage Rs | |
Assets |
|
|
|
|
Current assets |
|
|
|
|
Cash | 161 | 192 | (31) | (16.1) |
Marketable securities | 652 | 819 | (167) | (20.4) |
Receivables | 2,346 | 2,050 | 296 | 14.4 |
Inventories | 1,940 | 1758 | 182 | 10.4 |
Prepaid expenses and deferred charges | 578 | 312 | 266 | 85.3 |
Total current assets | 5,677 | 5,131 | 546 | 10.6 |
Properties |
|
|
|
|
Land, building, machinery and equipment less accumulated depreciation of Rs 5,386 and Rs 4,801 | 5,977 | 5,389 | 588 | 10.9 |
Long term receivable and other non- current assets | 488 | 258 | 230 | 89.1 |
| 12,142 | 10,778 | 1,364 | 12.7 |
Liabilities |
|
|
|
|
Current liabilities |
|
|
|
|
Payables |
2986 | 1828 | 1161 | 63.5 |
Taxes payable | 156 | 268 | (112) | (41.8) |
Dividend payable | 180 | 210 | (30) | (14.3) |
Total current liabilities | 3,325 | 2,306 | 1,019 | 44.2 |
Long – term liabilities |
|
|
|
|
Long – term debenture | 988 | 409 | 579 | 141.6 |
Other long – term liabilities | 219 | 203 | 16 | 7.9 |
Deferred income tax liabilities | 1048 | 723 | 325 | 45.0 |
Total liabilities | 5,580 | 3,641 | 1,939 | 53.3 |
Ownership |
|
|
|
|
Equity capital | 621 | 414 | 207 | 50.0 |
Preferred capital | 312 | 520 | (208) | (40.0) |
Govt. Securities at cost | (1,081) | (728) | (353) | 48.5 |
Total ownership | 6,562 | 7,137 | (575) | 8.1 |
Total liabilities | 12,142 | 10,778 | 1,364 | 12.7 |
Exhibit 17.2: comparative profit and loss account with horizontal analysis
Comparative profit and loss account with horizontal analysis
ABC company ltd.
Income statement for year ended
December 31, 2008 and December 31, 2009
| (in Rs .000) | Increase (decrease) | ||
2009 Rs | 2008 Rs | Amount Rs | Percentage Rs | |
Sales | 10,631 | 10,600 | 31 | 0.3 |
Costs and expenses |
|
|
|
|
Cost of goods sold | 7,129 | 6,887 | 242 | 3.5 |
Selling and administrative expenses | 2,378 | 2,166 | 212 | 9.8 |
Total cost and expenses | 9,507 | 9,053 | 454 | 5.0 |
Earning from operations | 1,124 | 1,547 | (423) | (27.3) |
Unusual charges | (563) | - | (563) | NA |
Other income and expenses including interest expenses of Rs 183 and Rs 114 | (31) | 77 | (108) | (140.3) |
Earning before income tax | 530 | 1,624 | (1,094) | (67.4) |
Provision from income tax | 198 | 701 | (503) | (71.8) |
Net earnings | 332 | 923 | (591) | (64.0) |
Attachments 17.1 and 17.2 show the company's comparative balance sheet and profit and loss accounts, respectively, showing the increase or decrease and the rate of change. Change rate=change amount/previous year×100
(2)Vertical Analysis:
Vertical analysis uses percentages to display the relationship between different parts and totals in a single statement. Vertical analysis sets the total shape in the statement to 100 percent and calculates the percent of each component of that figure.
The numbers you use as 100 percent are total assets or total liabilities and equity in the case of balance sheets, and revenue or sales in the case of profit and loss accounts.
(3) Trend analysis:
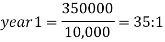
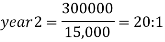
Using data from the previous year of the company, you can conduct a trend analysis and observe the rate of change over time of the selected data. In trend analysis, the percentage change is calculated for two years rather than several consecutive years
| Year 1 | Year 2 | Year 3 | Year 4 | Year 5 |
Sales | 202.0 | 215.0 | 243.0 | 320.0 | 415.0 |
Net earning | 10.9 | 11.7 | 13.5 | 15.4 | 18.8 |
Fig 2
Financial table analysis is an information processing system designed to provide data for decision-making models such as portfolio selection the only trend is that a certain ratio is found where the ratio is relatively constant, rising or remaining. From this observation, problems are detected or signs of good management are found.
Annual performance ( perecentage of base year)
| Year 1 | Year 2 | Year 3 | Year 4 | Year 5 |
Sales | 100 | 106 | 120 | 158 | 205 |
Net earning | 100 | 107 | 124 | 141 | 172 |
Fig 3
ABC Company
There are many trends of accurate calculation by changing the pattern of healthy growth pattern by the above data. To do this, the base year is selected and the data is split by the base year data for each other year.
The resulting figure is actually an indicator of the changes that occur throughout the period. If you select Year 1 as the base year, all data from years 2 to 5 are associated with Year 1, which is represented as 100%. To create the following table, divide each annual turnover by Rs from 2 to 5 years. Like the 202 year 1 sales ranking, the 2-year to 5-year net profit is divided by Rs. The company announced a net profit of 10.9% for the first quarter of the year and 1% for the third quarter.
Annual results
The trend percentage revealed that revenue growth exceeded sales growth for 2 and 3 years and then fell below sales growth for the last two years.
The analysis of this comparative statement reveals that in 5 years a disproportionate increase in operating expenses appeared. Analysing the data for 4 years, you can determine whether the net profit was affected for the same reason or whether the decline in growth was caused by other factors.
(4) Ratio analysis:
Ratio analysis is a crucial means of expressing the connection between two numbers. Ratios can be calculated from any number pair. To be useful, ratios need to represent meaningful relationships, but the use of ratios cannot take place to study the underlying data.
Ratios are guides or shortcuts that help you assess the financial situation or business of a company and compare them with previous years or other companies. The main purpose of the ratio is to point out areas for further investigation. They should be utilized in reference to a general understanding of the corporate and its environment.
Comparison of income statement and balance table numbers can create difficulties due to the timing of financial statements in the form of ratios. Specifically, the profit and loss account covers the entire accounting period, while the balance sheet is at a single point in time, which is the end of the period.
Ideally, comparing earnings report figures, like sales, to record figures, like assets , usually requires an inexpensive measure of the typical receivables for the year that sales cover.
However, these data are not available to external analysts. In some cases, analysts should take the next best approach, using an average of start and end balance sheet figures. This approach changes smoothly from beginning to end, but does not exclude problems with seasonal and periodic changes. It also doesn't reflect changes that occur unevenly throughout the year.
Common size statement:
The future of common size, actually compare the published representation rate. General size statement can be used to compare individual businesses, to compare the current period and the proportion of past periods, or to provide industry associations and financial information services.
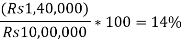
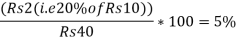
Financial statements of general size contain only the percentage of key figures, without the corresponding amount of figures. The use of percentages is usually preferable to the use of absolute numbers. The illustration makes this clear. If the company A earns Rs. Company 10,000 and Company B earn Rs. 1,000,which one is more profitable? The answer is likely to be company A.
However, the total shareholder interest of Company A is Rs. 10,00,000 and Company b is Rs. The return on capital of 10,000 is as follows:
If we compare the return on capital, we can clearly say that company B is more profitable than company a.
With a common size statement, the figures are brought to a common base, i.e. percent, so such a statement allows analysts to compare the operating and financing characteristics of the two companies of different sizes in the same industry, much more meaning the comparison of business companies of different sizes.
Trend analysis uses index numbers over a period of time. If the index number, one year, the base year is equal to 100%. Other years are measured in relation to their quantity. For example, analysts may be interested in sales and revenue In its long-term view, trend analysis is important because it may point to fundamental changes in the nature of the business.
In its long-term view, trend analysis is important because it may point to fundamental changes in the nature of the business.
It trends over the past five years. For this purpose, the turnover and revenue data of the enterprise is given to further prepare a trend analysis or percentage. When absolute numbers are small, you should be careful when using generic size statements, as small absolute changes can result in very substantial percentage changes. For example, if net profit reached Rs last year. Increased this year to 1000 and Rs. 5000, this will be an increase of Rs only. Net profit is 4,000, but represents a significant increase on a percentage basis.
In the vertical analysis format, the numbers from the year are compared with the base selected from the same year, while the common size statement can be prepared in the format of Vertical Analysis and horizontal analysis. For example, if the ad cost was Rs. 10,000 in 2008 and sales were Rs. 10, 00,000, advertising costs will be 1% of sales.
In the horizontal analysis format, the amount of the item (account) is expressed as a number in the same account for the selected base year. For example, if the turnover was Rs. 8, 00,000 in 2008 and Rs. 12, 00,000 in 2009, then sales increased to 150% of the 2008 level in 2009, an increase of 50%.
Types of financial analysis: financial analysis can be divided into different categories according to:
(I) Materials used, and
(II) Method of operation according to the analysis.
(I) can be classified into external and internal analysis based on the materials used or those who are interested in the analysis:
- External analysis:
People outside the company do external analysis. As for the analysis of financial statements, investors, credit institutions, government agencies, shareholders, etc. the company is an outsider/outsider party.
External analysts usually have only published information that they trust. His position has been challenged in recent days by increased government regulations that require business concerns to provide detailed information to the public through audited accounts.
- Internal analysis: analysis for administrative purposes is an internal type of analysis. This is done by the financial and Accounting Department of the company and is more detailed than an external analysis. Executives and employees of the organization also do it.
Officers appointed by government or court bodies under regulatory and other jurisdiction attributable to them with respect to business also carry out the analysis.
(II) Based on the analytical method, it can be classified as horizontal vs. Vertical analysis.
- Horizontal analysis: This refers to comparing the trends of each item of the financial statement, or the trends of the company over the years. Numbers for this type of analysis are displayed horizontally across several columns.
Such columns represent the year or company. This type of analysis is also called dynamic analysis because it is based on year-by-year data, not year-by-year data.
- Vertical analysis:
It is also called static analysis. In vertical analysis, the figures related to the financial statements are displayed vertically, that is, the figures from the Year Statement are compared with the base selected from the same statement. This type of analysis is mainly used to study the quantitative relationship of various items of financial statements with respect to certain data through proportions, or to analyse them over a certain accounting period.
It is useful to understand the performance of several companies in the same group, or many departments or departments within the same company.
However, this type of analysis does not help much to properly analyse the financial situation of the enterprise, since it depends on the data for a certain period of time. To make it more efficient, it can be conducted vertically as well as horizontally.
What is ratio analysis?
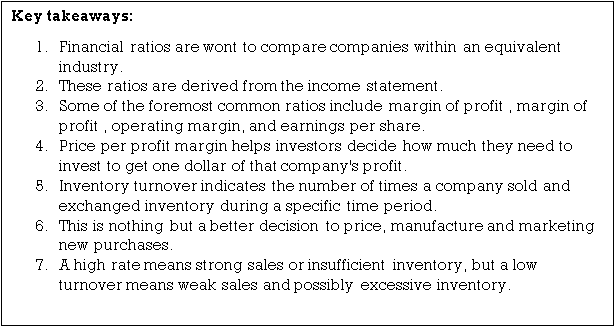
Ratio analysis refers to the analysis of financial information that is contained in a company's financial statement. These are primarily used by external analysts to determine various aspects of the business, such as profitability, liquidity and solvency.
Ratio analysis
Analysts obtain data to assess a company's financial performance based on current and historical financial statements. They use the data to determine if a company's financial position is on the rise or down and compare it to other competitors.
Use of ratio analysis
1. Comparison
One use of ratio analysis is to compare a company's financial performance to similar companies in the industry to understand its position in the market. By obtaining financial ratios such as price-earnings ratios from known competitors and comparing them to company ratios, management can identify market gaps and explore competitive advantages, strengths and weaknesses. I can do it. Management can then use that information to make decisions aimed at improving the company's position in the market.
2. Trend line
Companies can also use ratios to see if they are prone to financial performance. Established companies collect data from financial statements over a number of reporting periods. The trends obtained can be used to predict the direction of future financial performance. It can also be used to identify financial disruptions that are expected to be impossible to predict using a single reporting period ratio.
3. Operational efficiency
Company owners can also use financial ratio analysis to determine the degree of efficiency in managing assets and liabilities. Inefficient use of assets such as automobiles, land and buildings brings unnecessary costs to be eliminated. The financial ratio also helps determine if the financial resources are overused or underused.
Classification
This relationship can be represented as a percentage or quotient. The ratio is simple to calculate and easy to understand. Those interested in analysing financial statements can be grouped under three heads,
i) Owner or investor
Ii) Creditors and
Iii) Financial executives
All these three groups are interested in the financial situation and performance of the company, but each of them is the main objective to try to get from these statements.
Investors primarily want a basis for estimating income capacity. Creditors are primarily concerned with liquidity and the ability to pay interest and redeem the loan within the specified period. Management is interested in the evolution of analytical tools that measure cost, efficiency, liquidity and profitability to make intelligent decisions.
Classification of ratios:
Financial ratios can be divided into the following five groups:
- Structure
- Fluidity
- Profitability
- Sales
- Other.
1. Structure Group: the ratio of structure groups is as follows:
A. Liabilities funded by total capitalization:
The term "total" capitalization refers to the term of the loan, consisting of debt, capital stock and reserves and surpluses. The ratio of funding debt to total capitalization is calculated by dividing funding debt by total capitalization. It can also be expressed as a percentage of the provident debt to the total capitalization.
B. Long term loans
Total capital (share capital +reserve and surplus + long-term borrowings) II) debt to capital:
It is necessary to pay close attention to the calculation and interpretation of this ratio. The definition of debt takes two first. One includes current liabilities and the other includes current liabilities. Therefore, the ratio is calculated by the following two methods:
Long-term loans term credits + total liabilities on capital=current liabilities and reserves share capital + reserves and surplus (or)
Long-term debt on shares = long-term debt / equity capital + reserve and surplus
C. Net fixed assets to funded liabilities:
This ratio acts as a complementary measure to determine the security for the lender. A 2: 1 ratio means that for all rupees of long-term debt, there is a book value of two rupees of net fixed assets:
Fixed assets net assets Reserve debt
D. Reserve (long-term) debt on net working capital:
This ratio is calculated by dividing long-term debt by the amount of net working capital. It helps to find out the creditor's contribution to the company's current assets.
Long-term loans net working capital
2. Liquidity group:
It includes current ratio and acid test ratio
i) Current Ratio:
It is measured by dividing current assets by current liabilities. This ratio indicates the extent to which the receivables of short-term creditors are covered by assets that may be converted into cash in the period corresponding to the maturity of the receivables, so short-term credit to general current assets/current liabilities and reserves+ Inventory
Ii) Acid test ratio:
It is also termed as fast ratio. It is determined by dividing the "quick assets", that is, cash, marketable investments and sundries debtors by current liabilities. This ratio is the most bitter of financial strength than the current ratio, as it does not give consideration to stocks that can move very low.

Liquidity group
3. Profitability group:
It has five ratios and that they are calculated as follows:


- Return on investment =

4. Sales group:
It has four ratios, and that they are calculated as follows:
Ii. 
Iiii. 
Iv. Inventory turnover = a. 
b. 
5. Other group:
It contains four ratios, and they are:
MP = market price per share
Criteria for comparison:
For proper use of proportions, it is essential to fix the criteria for comparison. As long as the ratio itself is not very meaningful, it is also suitable as compared to. The choice of the right criteria for comparison is the most important factor in the ratio analysis. The four most common criteria used in ratio analysis are absolute, historical, horizontal and budgetary.
Absolute standards are those that are generally perceived as desirable, regardless of the company, Time, stage of the business cycle or the purpose of the analyst. Past standards include comparing the company's own past performance as a present or future standard.
On a horizontal basis, one enterprise is compared with another or with the average of other enterprises of the same nature. Budget standards arrive after preparing the budget for the period ratio developed from the actual performance, and to find out the degree of achievement of the expected goals of the enterprise, the planning of the budget is carried out.
Benefits of ratio analysis:
Ratio analysis is widely used as a powerful tool for financial table analysis. It is a numerical or quantitative relationship between the two figures of the financial statements to confirm the strengths and weaknesses of the company, as well as its current financial situation and past performance. It assists various stakeholders to make an assessment of certain aspects of the company's performance. The main advantages of ratio analysis are:
1. Forecasting and planning:
The trend of costs, turnover, profit and other facts can be known by calculating the ratio of the relevant accounting figures for the past few years. With the help of ratios, this trend analysis may help to predict and plan future business activities.
2. Budgeting:
A budget is an estimate of future activities based on past experience. Accounting ratios help to estimate budget figures. For example, the sales budget can be prepared with the help of an analysis of past sales.
3. Measurement of operating efficiency:
The ratio analysis shows the degree of efficiency in the management and use of that asset. Different activity ratios show operational efficiency. In fact, the solvency of the enterprise depends on the sales income generated by utilizing its assets.
4. Communication:
The ratio is an effective means of communication and is important in informing the owner or other party of the position and progress made by the business concern.
5. Performance and cost control:
Ratios may also be used for controlling the performance of different departments or departments of a project as well as controlling costs. Management always concerns the overall profitability of the company. They want to know if the company has the capacity to meet its short-term and long-term obligations to Creditors, ensure a reasonable return to the owner and ensure the optimal use of the company's assets. This is possible if all the proportions are taken into account together.
6. Enterprise-to-enterprise comparison:
Comparing the performance of multiple companies reveals efficient and inefficient companies, and inefficient companies adopt appropriate measures to improve efficiency the best way of enterprise-to-enterprise comparison is to compare the relevant ratio of the organization to the average ratio of the industry.
7. Displaying liquidity positions:
Ratio analysis helps to assess the liquidity position i.e., the short-term debt that pays the company's ability. The liquidity ratio shows the ability to pay and support credit analysis by banks, creditors, and other suppliers of short-term loans.
8. Displaying long-term solvency positions:
Ratio analysis is also used to assess the long-term debt solvency of the enterprise. . This is measured by the ratio of leverage/capital structure to profitability, which indicates profitability and operational efficiency. Ratio analysis shows the strength and weakness of the enterprise in this regard.
9. Indicators of overall profitability
Management always concerns the overall profitability of the company. They want to know if the company has the capacity to meet its short-term and long-term obligations to Creditors, ensure a reasonable return to the owner and ensure the optimal use of the company's assets. This is possible if all the proportions are taken into account together.
10. Signals of corporate illness:
Companies are sick when they are unable to continuously generate profits and are suffering from a serious liquidity crisis. Proper ratio analysis can give industry disease signals in advance so that timely measures can be taken to prevent the occurrence of such diseases.
11. Assistance in decision making:
Ratio analysis helps to make decisions such as whether to supply the enterprise with goods on credit, whether bank loans will be available.
12. Simplify financial statements:
Ratio analysis makes it easy to understand the relationships between various items and helps to understand the financial statements.
These constraints / Limitations:
1. Restrictions on financial statements:
The ratio is calculated from the information recorded in the financial statements. However, the financial statements suffer from many limitations and, therefore, can affect the quality of the ratio analysis.
2. Historical information: financial statements provide historical information. They do not reflect the current situation. Therefore, it is not useful to predict the future.
3. Different accounting policies:
Different accounting policies regarding the valuation of inventories, charges depreciation, etc prevents you from comparing accounting data and accounting ratios for both companies.
4. Lack of criteria for comparison:
No fixed standard can be set for the ideal ratio. For example, it is said that the current ratio is ideal if current assets are twice the current liabilities. But this conclusion is justifiable in the case of these concerns, which have sufficient arrangements with their bankers to fund when they need it.
5. Quantitative analysis:
Ratios are a quantitative analysis only tool, and qualitative factors are ignored when calculating ratios. For example, if a liquid asset contains a large inventory consisting mainly of obsolete items, a high current ratio does not necessarily mean a healthy liquid position.
6. Window-dressing:
The term "window dressing" means presenting a financial statement in such a way that it displays a better position than what it actually is. For example, if a low depreciation rate is charged, the revenue expense field is treated as a capital investment, for example. The position of concern can be made to appear on the balance sheet much better than what it is. The ratio calculated from such a balance sheet cannot be used to scan the financial situation of the business.
7. Price level changes:
For fixed assets, the system displays the position statement at the cost only. Therefore, it does not reflect changes in the price level. Therefore, it makes the comparison difficult.
8. Causality is necessary:
Proper care should be taken to study only such figures that have causality.
9. The ratio occupies one variable.
Since the ratio occupies only one variable, they cannot always give the correct picture, since some other variables such as government policy, economic situation, availability of resources, etc. You should keep in mind while interpreting the ratio.
10. Seasonal factors affect financial data:
Proper care should be taken when interpreting the accounting ratios calculated for seasonal operations. For example, an umbrella company maintains high inventory during the rainy season, and the inventory level for the rest of the year will be 25% of the seasonal inventory level. Therefore, the liquidity ratio and inventory turnover will give a biased picture.
Du Pont Chart
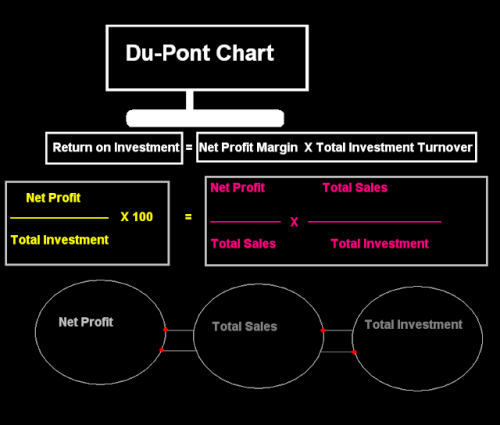
DuPont analysis is an extended examination of a company's return on equity (ROE), which analyses net profit margins, asset turnover, and financial leverage. This analysis was developed by the company DuPont in 1920.
What is DuPont analysis?
In simple terms, we break down ROE to analyse how companies can increase shareholder profits.
Equity margin=net profit margin*asset turnover*financial leverage = (net income/turnover)*(net sales/total assets) * (total assets/total capital)the company can increase the equity margin if it has.-
1. Generate a higher net profit margin.
2. Use assets effectively to generate more sales
3. High financial leverage
Components of DuPont analysis
3 factors are considered for this analysis;
1. Profit margin-this is a very basic ratio of profitability. It is calculated by dividing the net profit by the total revenue. This is similar to the profit generated after deducting all expenses. The main factors remain to derive a way to keep it growing by maintaining a healthy profit margin and reducing the costs that affect Roe, price increases, etc.
For example; Company X has annual net profit of Rs1000 and annual sales of Rs10000. So, net profit is calculated as follows
Net profit margin=net profit/total revenue=1000/10000=10%
2. Total assets turnover-this ratio indicates the efficiency of the company when using its assets. It is calculated by dividing the income by the average asset. This ratio varies from industry to industry, but it helps to compare companies in the same industry. If the company's asset turnover increases, this will positively affect the company’s ROE.
For example; Company X has an income of Rs10000 and an average asset of Rs200. So, the turnover of assets is as follows
Asset turnover=revenue/average asset = 1000/200=5
3. Financial leverage-this refers to the amount of debt used to finance assets. Companies should strike a balance on debt usage. Debt should be used to fund the operation and growth of the company. However, the use of excessive leverage to push up eggs can prove harmful to the health of the company. For example; Company X has an average asset of Rs1000 and equity of Rs400. Therefore, the leverage of the company is
Financial leverage=average assets/average shares=1000/400=2.5
DuPont analysis example
Let's analyse the return on equity of companies-both A and B companies are in the electronics industry and have the same ROE of 45%. The ratio of the two companies is as follows-even though the two companies have the same ROE, but the business of the company is quite different.
Ratio | Company A | Company B |
Profit Margin | 30% | 15% |
Asset Turnover | 0.5 | 6 |
Financial Leverage | 3 | 0.5 |
Company a can generate higher sales while maintaining the low cost of goods, which can be seen from its high profit margins.
Company B, on the other hand, sells products with low margins, but the very high asset turnover indicates that the company is doing a lot of sales. In addition, Company B has very low financial leverage, so it appears to be low risk.
Thus, this analysis compares it with similar ones. This helps investors measure the risks associated with each company's business model. DuPont analysis interpretation
This gives a wider view of the company's return on capital. It highlights the strength of the company and identifies areas where there is a reach for improvement. If shareholders are dissatisfied with a low ROE, the company says that with the help of the DuPont analytical formula, they can assess whether a low ROE is due to a low profit rate, low asset turnover or low leverage.
When the management of the company finds a weak area, it is possible to take measures to correct it. Low ROE may not always be a concern for the company as it may also happen for normal business operations. For example, ROE may go down due to accelerated declines in the first year.
The DuPont equation can be broken down to have even deeper insight when net income is divided into EBIT margin, tax burden, and interest burden.
Equity return = EBIT margin x interest burden X tax burden x asset turnover x financial leverage
Roe = (EBIT/sales) x (EBT/EBIT) x (net income/EBT) x (sales/total assets)x (total assets/capital)DuPont ROE formula
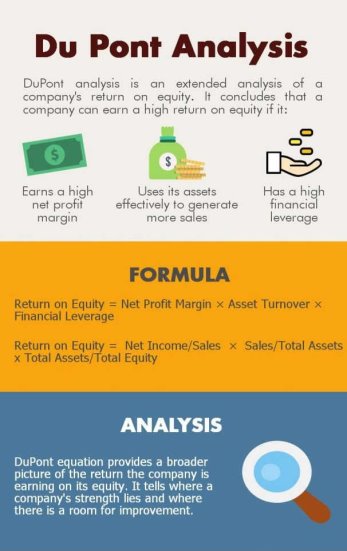
Fig 4
There are some changes to the calculation part when calculating ROE under the two approaches. Let us understand the differences in calculations. Basically, in this analysis, the above three components are considered for calculation.
A simple ROE will help you understand the return generated by the company on its capital. But the reason behind it (good or bad) is understood by DuPont's analysis.
In a simple eg, we calculate
ROE=net income/total capital
However, when calculating DuPont ROE, including a few more factors, calculate as follows,
DuPont ROE= (net income/net sales)*(net sales/total assets)*(total assets/total capital)
An example of a deeper decomposition of ROE is shown in the DuPont chart below.
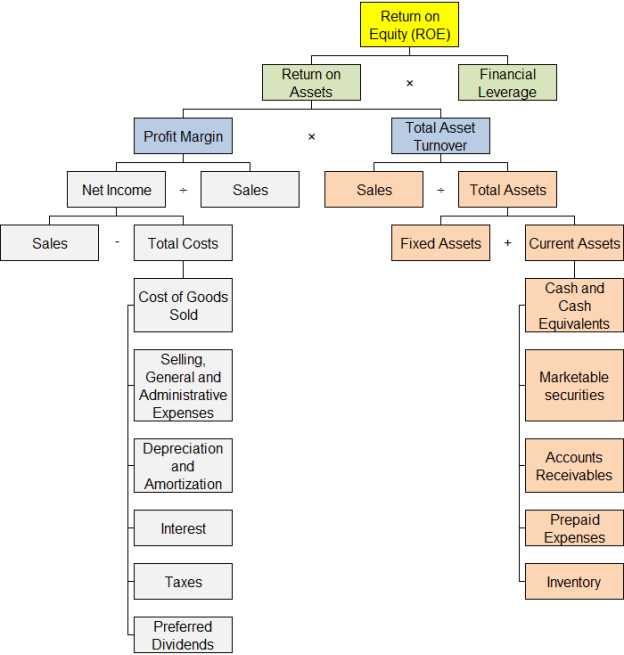
Fig 5
It is important to understand that the ingredients affect the ROE.
DuPont, as mentioned above, has many advantages, but everything also has its own shortcomings.
This analysis uses accounting data from financial statements for analysis and can be manipulated by management to hide inconsistencies.
This is only useful for comparisons between companies under the same industry.
3-step and 5-step DuPont analysis
The above 3 steps are calculated as follows
ROE= (net income/net sales)*(net sales/total assets)*(total assets/total capital)
Or
(Profit margin*total)/ (asset turnover*equity multiplier)
But the 5-step DuPont analysis、
ROE= (net income/income before tax)*(net sales/total assets)*(total
Total assets/equity)*(profit before tax/EBIT)*(EBIT / net sales)
=Tax burden * asset turnover*share multiplier*interest expense*operating profit margin.
DuPont analysis can be applied to zero debt companies?
After learning the new concept of DuPont, we must wonder whether this analysis is also carried out in the debt-free company. Whether this analysis has the same usefulness for a debt-free company?
DuPont analysis is equally useful when analysing a debt-free company. The above formula remains an equivalent, with only one exception-the financial leverage component is taken as 1, and therefore the rest remains an equivalent. Therefore, DuPont analysis can be performed in all kinds of companies.

Capital gearing
- The term ‘capital gearing’ or ‘leverage’ noremally refers to thr proportion of relationship between equity share capital including reserve and surplus to preference share capital and other fixed interest bearing fund or loans
- It is the proportion between the fixed interest or dividend bearing fund and non fixed interest or dividend bearing funds.
- Equity share capital includes equity share capital and all reserve and surplus items that belong to shareholder’s . Fixed interest bearing fund includes debenture , preference share capital and other long term loans .
The capital gearing ratio is the ratio of capital with fixed returns (i.e. preferred stock capital plus long-term liabilities) and capital with variable returns (i.e. common stock capital).
The total capital of the company consists of three main segments: Shares, Preferred Stock capital and long-term loans. Share-holders (i.e., common shareholders) are paid dividends, which vary annually depending on the amount of profit. Returns a variable that common shareholders can see everywhere. On the other hand, both preferred shareholders and long-term lenders are paid a fixed rate of return regardless of the level of the company's profits. The funding is being advanced everywhere seen fixed returns.
Formula:
The formula for capital gearing ratio is as follows:
Capital gearing ratio=common shareholders ' equity/fixed expenses bearing fund gearing level
The gear level arrives by representing the capital with a fixed return (CWFR) as a percentage of the adopted capital. Companies where CWFR exceeds 60% of the total capital employed are said to be high geared. Companies where CWFR is between 30% to 50% of the total capital are said to be medium-sized geared. Companies where CWFR is below 25% of the total capital employed are said to be low-geared. It is said that companies that do not have CWFR do not show up or are fully capital-funded.
A slight reduction in RoCE in a high geared company can cause a large reduction in Roe. On the other hand, even a slight improvement in ROCE for such a company can lead to a significant increase in ROCE.
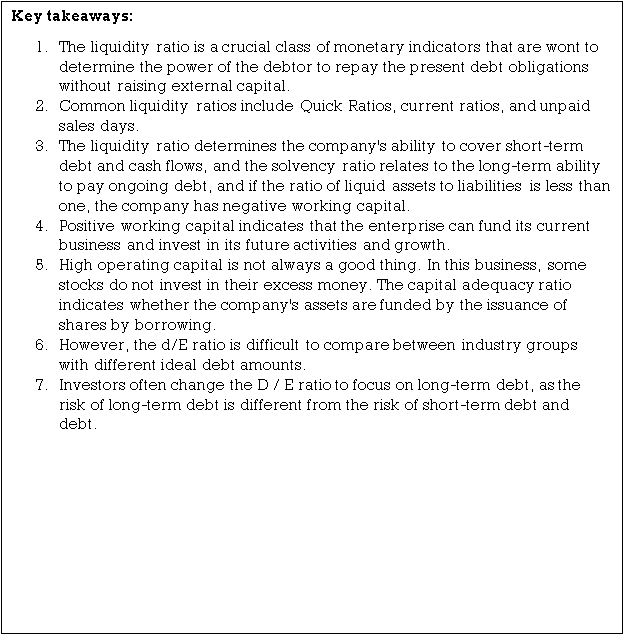
- Current Ratio
1. Current ratio
Quick ratio measures a company's ability to meet its obligations using current assets. If a company is in financial difficulty and unable to pay its debt, it can convert its assets into cash and use that money to settle its pending debt more easily.
Common current ratios include quick ratio, cash ratio, and current ratio. The current ratio is used by banks, creditors, and suppliers to determine if a customer has the ability to meet its financial obligations when it is due.
Current ratio = Current assets / Current liabilities
2. Liquid Ratio
Liquidity ratio | Formula |
Current ratio | Current Assets/Current Liabilities |
Quick ratio | (Cash + Short-term Marketable Securities + Receivables)/Current Liabilities |
Cash ratio | (Cash + Marketable Securities)/Current Liabilities |
Cash conversion cycle | DIO + DSO - DPO |
A liquidity ratio is a financial ratio that measures a company's ability to use its current assets to repay its short-term financial obligations, or current liabilities. The most common liquidity ratios are the current ratio, rapid ratio, cash ratio and cash conversion cycle. The high current ratio, fast ratio and cash ratio and low cash conversion cycle indicate a good liquidity position.
1. Current ratio
Quick ratio measures a company's ability to meet its obligations using current assets. If a company is in financial difficulty and unable to pay its debt, it can convert its assets into cash and use that money to settle its pending debt more easily.
Common current ratios include quick ratio, cash ratio, and current ratio. The current ratio is used by banks, creditors, and suppliers to determine if a customer has the ability to meet its financial obligations when it is due.
Current ratio = Current assets / Current liabilities
2. Fast ratio
Quick ratio= (cash+ accounts receivable + marketable securities) / current liabilities
The quick ratio may be a tougher test of liquidity than the present ratio. Both are similar in the sense that current assets are the numerator and current liabilities are the denominator.
However, the fast ratio only considers certain current assets. It considers more liquid assets such as cash, accounts receivable, and marketable securities. This leaves liquid assets such as inventory and upfront costs because the two are less liquid. So the quick ratio is more of a real test of a company's ability to hide its short-term obligations.
3. Cash ratio
Cash ratio= (cash+securities) / current liabilities
The cash ratio takes the test of liquidity further. This ratio takes into account only the most liquid assets of the company–cash and marketable securities. They are the assets most readily available to a company to pay short-term debt.
In terms of how rigorous the liquidity test is, you can see the current ratio, the quick ratio, and the cash ratio as easy, medium, and difficult.
4. Cashing cycle
The cash conversion cycle (also known as the net operating cycle) calculates the net number of days a company's cash is tied to. In addition to the date it takes to a company when selling its inventory i.e. day inventory balance (DIO), the day it takes to collect cash from receivables. The shorter the cash turnover cycle is the better. Flow analysis should include trend analysis and cross-sectional analysis. Trend analysis involves comparing the liquidity ratio of past and current periods, while cross-sectional analysis involves comparing companies and competitors at a certain point in time.
3. Stock Working Capital Ratio
Working capital ratio is a ratio that helps to assess the financial performance and soundness of a company, where a ratio of less than 1 indicates the possibility of future financial or liquidity problems to the company and is calculated by dividing the total current assets of the company by the total current liabilities. Formula
Working capital ratio=current assets÷current liabilities
Generally speaking, it can be interpreted as:
If this ratio is around 1.2 to 1.8, this is generally said to be a balanced ratio, and the company is assumed to be in a healthy state of paying off the debt.
If it is less than 1-it is commonly known as negative working capital, which means that the company cannot pay its debt. Consistently negative working capital can also lead to bankruptcy. (A detailed description is given in a later segment)
If this ratio is greater than 2, the company may have idle funds in excess that are not well used. The opportunity cost of idle funds is also high, so it should not be.
However, these ratios generally vary by type of industry and don't necessarily make sense.
4. Proprietary Ratio
This ratio indicates the percentage of total assets of the company, which is financed by the funds of the owners. The unique ratio is also known as the capital adequacy ratio. It helps to determine the financial strength of the company & helps creditors to assess the ratio of shareholder funds adopted from the total assets of the company.
The word "owner" is a synonym for “owner of the business", and the owner's funds, in this case, are only those funds that belong to the owner/shareholder of the business. Owners 'funds are also known as owners' Funds, shareholders ' funds, net assets, etc.
Owner's fund or shareholder's fund=share capital+reserves and surplus
Total assets = includes total assets according to the balance sheet
5. Debt Equity Ratio
Leverage ratio shows the relative percentage of shareholders ' equity and debt won’t to finance a company's assets. Low debt to capital adequacy ratio indicates that debt holders are at lower risk because they have fewer claims on the company's assets. A debt to a capital ratio of 5 means that the debt holder has 5 times more claims on the asset than the equity holder.
High debt to capital adequacy ratio usually means that companies are aggressive in growing their debt and financing, often resulting in volatile profits.
It is also referred to as debt/equity ratio, debt equity ratio, and D/E ratio.
Formula
Y Charts calculation: debt to capital= (long-term debt+current portion of long-term debt)/total shareholders ' equity
Note:
Some sources calculate debt to capital as total debt/shareholders 'equity, and some sources calculate shareholders' equity at book value rather than market value.
Y Charts calculates shareholders ' equity at book value, not market value. For debt, use (long-term debt+current portion of long-term debt) instead of total debt.

It is the ratio of net profit to sales and is also expressed as a percentage. It indicates the amount of turnover left for shareholders after all expenses and expenses have been met. The higher the ratio, the more profitable it is and the higher the return to shareholders.
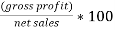
- Gross Profit Ratio
It is the ratio of gross profit to sales and is expressed in percentages. It is also called turnover. It reveals the amount of gross profit for each rupee on sale. It is very important and important, because it is possible to check the earning capacity of the business by taking the margin between the cost of the goods and the sale.
The higher the ratio, the larger the margin, which is why it is also called the margin ratio. Management is always interested in high margins to cover operating expenses and sufficient returns of the owner's funds. It is very useful as a test of profitability and management efficiency. A gross interest rate of 20% to 30% may be considered normal.
Gross margin=gross margin / turnover×100.
Net sales=total sales-inward return-cash discount is possible.
2. Expenses Ratio
Cost ratio:
(a) Fixed cost to total cost ratio:
This indicates the idle capacity in the organization. But if this ratio increases gradually, without corresponding to the increase in fixed assets, then the problem should be analysed and carefully examined.
Ratio of fixed costs to total costs=fixed costs/total costs
(B) Material consumption-to-sales ratio and wage-to-sales ratio:
These indicate the ratio of material and wages to total sales. The higher the ratio is the smaller the margin of profit is.
(i)Material Consumption to sales ratio=material consumption/sales
(II) Wage-to-sales ratio = wage-to-sales ratio
(C) Ratio of sales to office and management, sales and distribution costs;
This is due to the fact that we believe that the rate of affairs, management, sales and logistics costs of sales.
Material consumption (I) ratio of sales to office and administrative expenses= Office and administrative expenses/sales
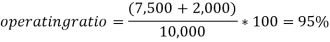
(D) Operating ratio:
This is the ratio of operating costs or operating costs to sales. It may be represented as a percentage and reveals the amount of sales required to cover the cost of the goods sold and the operating costs. The lower the ratio is the higher the profitability and the better the management efficiency. 80% to 90% may be considered normal.
Operating ratio=cost of goods sold+operating expenses/turnover.
3. Operating Ratio
This is the ratio of operating costs or operating costs to sales. It may be represented as a percentage and reveals the amount of sales required to cover the cost of the goods sold and the operating costs. The lower the ratio is the higher the profitability and the better the management efficiency. 80% to 90% may be considered normal.
Operating ratio=cost of goods sold+operating expenses/turnover
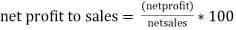
4. Net Profit Ratio
It is the ratio of net profit to sales and is also expressed as a percentage. It indicates the amount of turnover left for shareholders after all expenses and expenses have been met. The higher the ratio, the more profitable it is and the higher the return to shareholders. 5% to 10% may be considered normal. It is a very useful tool to control production costs, as well as to increase sales.
Net profit margin = net profit/turnover×100.
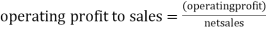
5. Net Operating Profit Ratio
This is a modified version of net profit to sales. Here, non-operating income or expenses should be adjusted with net profit to confirm the operating net profit amount. It shows the amount of profit earned for each rupee of sales after dividing sales into net operating income. It is also represented as a percentage.
Operating profit margin=operating profit / net sales×100
6. Stock Turnover Ratio
Inventory turnover is a percentage of the number of times a company sold and exchanged inventory during a specific time period. After that, the company can divide the number of days in the period by inventory rotation to calculate the number of days it takes to sell inventory at hand. Inventory rotation month calculation is a better decision for pricing, Manufacturing, Marketing and new purchases. Inventory rotation formula and calculation
Inventory turnover=sales/average inventory
Where
Average stock=(start Stock+end stock) / 2
Companies calculate inventory turnover:
It is done by calculating the average stock and dividing the sum of the starting and ending stocks by two.
Divide sales by average inventory.
Another method involves using the cost of goods sold (COGS) instead of sales. Because sales include mark-up that exceeds costs, to improve the accuracy of inventory turnover calculations, analysts split sales by cost-average inventory instead of sales, resulting in an inventory turnover. In both situations, the average stock will help to remove the effects of seasonality
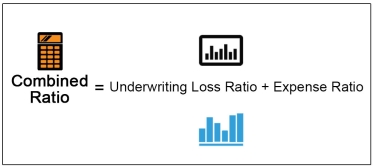
Combined ratio—the sum of two ratios, calculated by dividing the losses incurred and the loss adjustment expense (LAE) by the earned premium (calendar year loss rate) and all other expenses by the written or earned premium (i.e., trade-based or statutory base expense ratio). When applied to the overall results of a company, the combined ratio is also referred to as composite or statutory ratio. Used in both insurance and reinsurance, the combined ratio below 100 percent represents underwriting profits.
- Return on Capital employed (Including Long Term Borrowings)
Adopted capital refers to the quantity of capital investment a business uses to work and provides an indicator of how a corporation is investing that cash .
Capitals adopted are often defined in several contexts, but it generally refers to the capital employed by a corporation to get profit. This figure is usually utilized in the return on capital (ROCE) ratio to live a company's profitability and efficiency of capital use.
Formula
This metric are often calculated in two ways:
Adopted capital=total assets and current liabilities
Where
Total assets is that the sum of the value of all assets.
Current liabilities are liabilities that are paid within a year.
Or,
Employed capital=fixed assets + capital
Where
Fixed assets, also referred to as capital assets, are purchased for long-term use and are essential assets within the operation of the corporate.
Examples are properties, plants, and equipment (PP&E).
Working capital is that the capital available for daily operations and is calculated as current assets minus current liabilities.
2. Return on proprietor’s Fund (Shareholders Fund and Preference Capital)
This ratio indicates the percentage of total assets of the company, which is financed by the funds of the owners. The unique ratio is also known as the capital adequacy ratio. It helps to determine the financial strength of the company & helps creditors to assess the ratio of shareholder funds adopted from the total assets of the company.
The word "owner" is a synonym for “owner of the business", and the owner's funds, in this case, are only those funds that belong to the owner/shareholder of the business. Owners 'funds are also known as owners' Funds, shareholders ' funds, net assets, etc.
Owner's fund or shareholder's fund=share capital +reserves and surplus
Total assets = includes total assets according to the balance sheet

3. Return on Equity Capital
The return on equity (ROE) is a measure of the company's annual profit margin (net profit) divided by the value of the total shareholders ' equity, expressed as a percentage (for example, 12%). Alternatively, ROE can be derived by dividing the company's dividend growth rate by the revenue retention rate (1 payout ratio).
The return on equity is a two-part ratio in its derivation because it brings together the Income Statement and balance sheet, net profit or profit compared with shareholders ' equity this figure represents the total return on equity and shows the ability of a company to turn equity investment into profit. Put another way, it measures the profit of each dollar from shareholders ' equity.
Share rate of return formula
Below is the Roe equation:
ROE=net income/shareholders ' equity
ROE provides a simple indicator for assessing return on investment. By comparing the company’s ROE to the industry average, something may be identified about the company's competitive advantage. Roe may also provide insight into how company management is using financing from equity to grow a business.
A sustainable and increasing ROE over time could mean companies are better at generating shareholder value because they know how to reinvest revenue wisely, in order to increase productivity and profits. In contrast, a drop in ROE could mean that management is making poor decisions about reinvesting capital into unproductive assets.
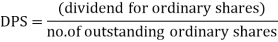
4. Dividend Payout Ratio
Dividend payout ratio is the ratio of the company's net income to the total dividend paid to shareholders. This is the percentage of profits paid to shareholders in dividends. The amount that is not paid to shareholders is held by the company to repay the debt or reinvest in its core business. It is sometimes simply called “payout ratio".'
Dividend payout ratio provides an indicator of how much money a company is returning to shareholders it is a calculation formula and calculation of dividend payout ratio
The payout ratio can be calculated as the annual dividend divided by earnings per share, or equally the dividend divided by net income (as shown below).
Dividend Payout Ratio= Dividends Paid
Net Income
Dividend Payout Ratio= 1−Retention Ratio
Alternatively, the dividend payout ratio can also be calculated as:
Retention Ratio= EPS
EPS−DPS
Where:
EPS=Earnings per share
DPS=Dividends per share
5. Debt Service Ratio
Debt service coverage rates apply to businesses, governments, and personal finance. In the context of corporate finance, the debt service coverage ratio (DSCR) is a measure of a company's available cash flow to pay its current debt obligations. The DSCR shows investors whether a company has enough income to pay its debt. In the context of government finance, DSCR is the amount of export income required by a country to meet annual interest and principal payments on external debt. In a personal financial context, it is the ratio used by bank lenders to determine income property loans. DSCR expressions and calculations
The calculation formula for the debt service coverage rate requires net operating income and therefore the total debt repayment of the entity. Net operating income is the company's revenue minus operating expenses and does not include taxes and interest payments. This is often thought to be equivalent to earnings before interest and tax (EBIT).
DSCR= Total debt service
____________________
Net operating income
Where
Operating income = revenue-COE
COE=constant operating expenses
Total debt=current debt
6. Debtors Turnover
A debtor's turnover rate of 6 times means that on average; the debtor buys and recalls 6 times a year. So, we can assume that 6 times a year means once every two months, and this is only an average collection period of 60 days.
Debtor turnover=net credit turnover: average debtor
Net credit sales: Debtors+bill receivables
Standard norm of proportions
The higher the ratio, the position of the company in collecting arrears means the effectiveness of the collection department, and vice versa .rd norm of proportions
7. Creditors Turnover
It shows the effectiveness of the company in taking advantage of the credit period allowed by the creditor during the time of credit purchase.
Credit turnover=credit purchase: average creditor
Or
Credit purchases:
Handprint+general store
Standard norm of proportions
The fewer ratios are better, which means that the company's position in liquidity management will enjoy more credit periods from creditors and vice versa.
Creditor rate= 365 days/52 weeks/12 months
Creditor turnover
Standard norm of proportions
The greater duration is better than company liquidity management in availing creditors and reverse credit periods.
Practical Questions:
Problem 1:
The company's balance sheet for December 31 is as follows:
Liabilities | Rs | Assets | Rs |
Share capital | 2,00,000 | Land and building | 1.,40,000 |
Profit & loss account | 30,000 | Plant and machinery | 3,50,000 |
General reserve | 40,000 | Stock | 2,00,000 |
12% debenture | 4,20,000 | Sundry debtor | 1,00,000 |
Sundry creditor | 1,00,000 | Bills receivable | 10,000 |
Bills payable | 50,000 | Cash at bank | 40,000 |
| 8,40,000 |
| 8,40,000 |
Calculate :-
- Current ratio
- Quick ratio
- Inventory to working capital
- Debt to equity ratio
- Proprietary ratio
- Capital gearing ratio
- Current assets to fixed assets
Solutions :
- Current ratio =

 =2.33:1
2. Quick ratio =

3. Inventory to working capital =
Working capital= current assets – current liabilities
Rs 3,50,000 - Rs 1,50,000= Rs 2,00,000
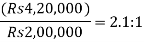
4. Debt to equity ratio=
(or)
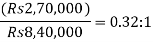
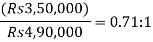
5. Proprietary ratio=
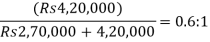
6. Capital gearing ratio =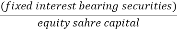
7. Current assets to fixed assets = 
Problem 2:
From the following items listed in the trading and profit and loss accounts of the corporation. Working out, business concerns occupancy rate:
Trading account of a account LTD.
For the period ending December 21
Dr. Cr.
Expenses | Rs | Income | Rs |
To opening stock | 1,400 | By net sales | 10,000 |
To purchase | 6,400 | By closing stock. | 600 |
To direct expenses | 300 |
|
|
To gross profit | 2,500 |
|
|
| 10,600 |
| 10,600 |
Profit and loss account of a company LTD.
For the period ending December 31
Dr. Cr.
Expenses | Rs | Income | Rs |
To operating expenses |
| By gross profit | 2,500 |
| 1,600 |
|
|
b. Selling and distribution expenses | 300 |
|
|
To financial expenses | 100 |
|
|
To net profit | 500 |
|
|
| 2,500 |
| 2,500 |
Solution:

Cost of good sold | Rs |
Opening stock | 1,400 |
Purchases | 6,400 |
Direct expenses | 300 |
| 8,100 |
Less closing stock | 600 |
Cost of good sold | 7,500 |
Operating expenses | Rs |
| 1,600 |
b. Selling and distribution expenses | 300 |
c. Financial expenses | 100 |
Operating expenses | 2,000 |
Problem 3:
Below is a summary profit and loss account of Taj Products Ltd. Published January 31-4:
Profit and loss account
| Rs |
| Rs |
Opening stock of market | 99,500 | Sales | 8,50,0000 |
Purchase of material | 3,20,000 | Stock of material (closing) | 89,000 |
Direct wages | 2,25,000 | Stock of finished goods ( closing ) | 60,0000 |
Manufacturing expenses | 14,250 | Non- operating income interest | 3,0000 |
Selling & distribution |
| Profit on sale of shares | 6,000 |
Expenses | 30,000 |
|
|
Administrative expenses | 1,50,000 |
|
|
Finance charges | 15,000 |
|
|
Non- operating expenses |
|
|
|
Loss on scale of assets | 4,000 |
|
|
Net profit | 1,50,000 |
|
|
| 10,08,000 |
| 10,08,000 |
Work out following ratios:-
- Gross profit ratio
- Net profit ratio
- Operating ratio
- Cost ratios( to cost of production)
- Material consumed ratio
- Labour cost ratio
- Production overhead cost ratio
Solution
Gross sales (a) |
| 8,50,000 |
Less: cost of good sold: | Rs |
|
Opening stock of material | 99,500 |
|
Add: material purchased | 3,20,000 |
|
| 4,19,500 |
|
Less: stock of material (closing) | 89,000 |
|
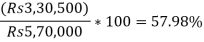
Material consumed ; (b) | 3,30,500 |
|
Direct wages | 2,25,000 |
|
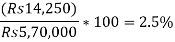
Manufacturing expenses | 14,250 |
|
Cost of production | 5,70,000 |
|
Less: closing stock of finished products | 60,000 |
|
Cost of good sold |
|
|
Gross profit (e) |
|
|
Less: administrative expenses | 1,50,000 | 5,10,000 |
Selling and distribution | 30,000 | 1,80,000 |
Net operating profit before interest and taxation |
| 1,60,000 |
Add: non- operating income (g) |
|
|
Interest | 3,000 |
|
Profit on sales of shares | 6,000 | 9,000 |
|
| 1,69,000 |
Less: loss on sale of assets | 4,000 |
|
Finance charges | 15,000 | 19,000 |
Income before taxation |
| 1,50,000 |
- Gross profit ratio=
2. Net profit ratio= 
3. 
4. i. Material consumed ratio=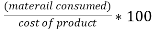
Ii. productive overheard ratio= 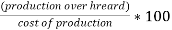
Problem 4
You need to calculate from the following balance sheet and additional information:
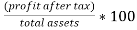
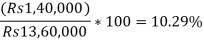
(i)Total Return on resources
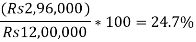
(ii)Return on employment capital
(iii) Shareholder fund return
Balance sheet as on 31st Dec
| Rs |
| Rs |
Share capital (Rs10) | 8,00,000 | Fixed assets | 10,00,000 |
Reserve | 2,00,000 | Current assets | 3,60,000 |
8% debenture | 2,00,000 |
|
|
Creditors | 1,60,000 |
|
|
| 13,60,000 |
| 13,60,000 |
Net operating profit before tax is Rs 2,80,000. Assume tax rate at 50% . Dividend declared amount to Rs 1,20,000
Solution :-
- Return on total resources =
Ii. return on capital employed = 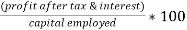
Iii. return on shareholder’s fund= 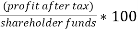
Problem 5:
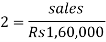
The company has Rs capital. 10, 00,000; its turnover is 3 times the capital, and the margin of turnover is 6%. What is the return on investment?
Solution :-
Capital turnover ratio= 
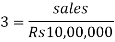
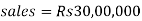
Rate of return on investment = 

Gross profit =6% of Rs 30,00,000
Rs= 1,80,000
Problem 6:
The following information is given by Ram & company about the year that ended 31st December:
Cash sales | Rs 80,000 |
Credit sales | Rs 2,00,000 |
Return inward | Rs 10,000 |
Opening stock | Rs 25,000 |
Closing stock | Rs 30,000 |
Gross profit ratio is 25% |
|
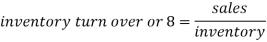
Find out Inventory Turnover.
Solution:
Inventory Turnover=
Net Sales=Rs 80,000+Rs 2,00,000-Rs 10,000
Rs 270,000
Cost Of Goods Sold =Sales-Gross Profit
=Rs 2,70,000-(25% of Rs 2,70,000)
=Rs 2,70,000-Rs 67,500
=Rs 2,02,500
Average Inventory =
=Rs 27,500
Inventory Turnover =Rs. 2,020,500/Rs. 27,500=7.36 Times
Significance:
- High inventory turnover is better than low ratio. A high rate means good inventory management and insufficient investment indications. This adversely affects the ability of the company to meet customer demand.
- Low inventory turnover is dangerous. This is an indicator of excess inventory, more than an investment in inventory. The low ratio may be the result of stock of inferior quality goods, un-saleable and absolute goods. The low ratio reflects the dull thing that suggests that some procedures must be carried out to push up sales.
Problem 7:
The following is the profit and loss account of burn Corporation.
| Rs |
| Rs |
To opening Stock: |
|
|
|
Materials | 60,000 | By Sales | 12,70,000 |
Finished Goods | 80,000 | By Closing Stock: |
|
|
| Materials | 70,000 |
To Purchase (Raw Materials) | 6,00,000 | Finished Goods | 1,00,000 |
To Wages | 3,00,000 |
|
|
To Factory Expenses | 1,00,000 |
|
|
To Other Expenses | 2,00,000 |
|
|
To Net Profit | 1,00,000 |
|
|
| 14,40,000 |
| 14,40,000 |
You are required to calculate the following:
(i) Stock Turnover
(ii) Raw Materials Turnover
(iii) Average Material Holding (B.Com. Bhopal, Agra, Madurai)
Solution:
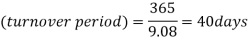
(i) Stock Turnover=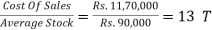 imes
imes
(ii) Raw Materials Turnover=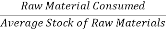
 Times
Times
(iii) Average material holding =
Working :-
- Cost of sales = total cost +opening stock of finished goods-closing stock of finished goods
=Rs 11,90,000+Rs80,000-Rs 1,00,000=Rs 11,70,000
2. Average stock =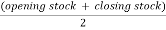
Average stock of finished goods = 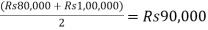
Average stock of raw material = 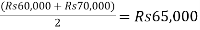
3. Raw material consumed = opening stock + purchase – closing stock
= Rs 60,000+rupees. 6, 00,000 yen 5, 90,000
Problem 8:
Calculate the debtor's rate from the following details:
- The opening balance of the debtor Rs. 10,000
- Credit sales during the annual Rs. 20,000
Solution :
The following components are needed to find debtor velocity :
- Net sales= gross sales-(sales return + discount on sales)
Rs 20,000-(Rs 1,000+Rs 50)
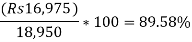
Rs 18.950
2. Net debtors on closing = opening debtor
Add : credit sales
Less: cash collection
Less: sales return
Less: sales discount
Rs 10,000+ Rs 20,000-(Rs 5,000+Rs 1,000 +Rs 50)=Rs 23,950
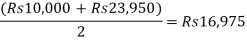
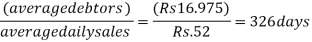
3. Average debtors = 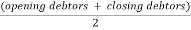
4. Average daily sales (credit) =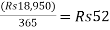
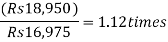
- Debtor turnover (time) =

2. Collection period = 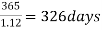
3. Debtors turnover (percentage) =
4. Collection period ( days) = debtors turnover ( percentage) *365 =89.58*365=326 days
(or) 5. Collection period
Note:
Accounts receivable of bills from the buyer of fixed assets should be excluded.
Bad loans and bad debts and their provisions are not deducted from the total debtor to avoid the impression that more receivables have been recovered.
Significance:
A turnover of 8 means that the debtor is converted into cash 8 times a year. The average payback period of 1.5 months means that the debtor is collected in 45 days. The ratio of the average payback period measures the quality of the debtor, since it indicates the rapidity or slowness of their collection possibilities. The shorter the average is payback period, the better the quality of the debtor. The higher the turnover rate , the shorter the average payback period, the better the trade credit management and the better the liquidity of the debtor. That is, a high turnover and a short payback period mean a quick payment of the debtor. On the other hand, the low turnover rate and a long payback period reflect the delay in the debtor's payment.
Problem 9:
The capital of the company is as follows:
| Rs |
9% preference shares of Rs 10 each | 3,00,000 |
Equity shares of Rs 10 each | 8,00,000 |
| 11,00,000 |
The accountant has ascertained the following information
Profit after tax at 60% Rs 2,70,000
Depreciation Rs 60,000
Equity dividend paid 20%
Market price of equity share Rs 40
You are required to state the following , showing the necessary workings :
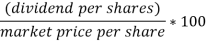
- Dividend yield on the equity shares :
b. Dividend coverage ratio:
- Preference shares=
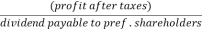
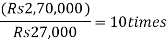
(Rs 27,000 is 9% of Rs 3,00,000)
Ii. 
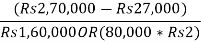
c. earning for equity shares
d. price earning ratio : = 

= 13.168 times
The sale returns Rs. 1,000
Sale Rs discount. 50
Cash collected from debtors during Rs 5,000 a year
Bad loans Rs. 500
10% problem 10 in NPL disposal:
Problem 10:
Assume that the company has Rs owner equity. 1, 00,000. The ratio of the company is as follows:
Current debt to total debt 0.40
Total debt to owner equity 0.60
Fixed assets to owner’s equity 0.60
Total assets turnover 2 times
Inventory turnover 8 times
Complete the following balance sheet, given the information above .
Equities | Rs | Assets | Rs |
Current debt | ------ | Cash | ----- |
Long- term debt | ------ | Inventory | ----- |
Total debt’s | ------ | Total current assets | ----- |
Owner equity | ------ | Fixed assets | ----- |
Total equity | ------ | Total assets | ----- |
Solution :-
Equities | Rs | Assets | Rs |
Current debt | 24,000 | Cash | 60,000 |
Long- term debt | 36,000 | Inventory | 40,000 |
Total debt’s | 60,000 | Total current assets | 1,00,000 |
Owner equity | 1,00,000 | Fixed assets | 60,000 |
Total equity | 1,60,000 | Total assets | 1,60,000 |
Working :
- Total debt = 0.6* owners equity
=0.60* Rs 1,00,000
= 60,000
2. fixed assets =.6* owners equity
=0.60* Rs 1,00,000
= 60,000
3. total equity = total debt + owner’s equity
Rs 60,000 + Rs 1,00,000
=Rs 1,60,000
4. total assets = current assets + fixed assets ( must be equal to
=Rs 60,000) fixed assets = Rs 60,000
Current assets = Rs 1,60,000-Rs 60,000= Rs 1,00,000
5. sales = assets turnover or 2 =
Sales = Rs 1,60,000*2= 3,20,000
6. inventory:
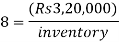
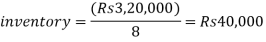
7. cash = current assets – inventory

8. current debt= 0.40* total debt =0.40*Rs 60,000=Rs 24,000
9. long- term debt= total debt – current debt = Rs 60,000- Rs 24,000=Rs 36,000
Problem 11:
Prepare your transactions, profit and loss accounts and balance sheets with the following ratios and more information:
Gross profit ratio 25%
Net profit ratio 20%
Stock turnover ratio 10
Net profit/ capital 1/5
Capital to total liabilities ½
Fixed assets/ capital 5/4
Fixed assets / total current liabilities 5/7
Fixed assets Rs 10,00,000
Closing stock Rs 1,00,000
Solution :
Trading and profit and loss account
| Rs |
| Rs |
To opening stock | 20,000 | By sales | 8,00,000 |
To purchase ( balancing figure) | 6,80,000 | By closing stock | 1,00,000 |
To gross profit | 2,00,000 |
| 9,00,000 |
| 9,00,000 | By gross profit | 2,00,000 |
To expenses ( balancing figure) | 40,000 |
|
|
To net profit | 1,60,000 |
|
|
| 2,00,000 |
| 2,00,000 |
Balance sheet as of….
Liabilities | Rs | Assets | Rs |
Capital | 6,40,000 | Fixed assets | 10,00,000 |
Net profit | 1,60,000 | Closing stock | 1,00,000 |
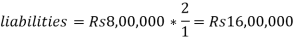
Liabilities | 16,00,000 | Current assets | 13,00,000 |
| 24,00,000 |
| 24,00,000 |
Working :
- Capital =

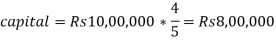
2. liabilities = capital ½ of total liabilities
3. net profit = 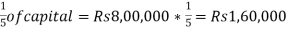
4. net profit =20% of sales = Rs 1,60,000
So, sales =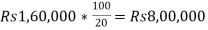
5. gross profit =25% of sales =25% of Rs 8,00,000=Rs 2,00,000
6. opening stock :
Stock turnover =10
Cost of sales =Rs 8,00,000-Rs 2,00,000=Rs 6,00,000
Average inventory =Rs 60,000
Opening stock= Rs 60,000*2=Rs 1,20,000-Rs 1,00,000=Rs 20,000
7. current assets :
Fixed assets/total current assets =5/7
Current assets =Rs 10,00,000* =Rs 14,00,000
Other current assets = current assets -stock
Rs 14,00,000-Rs 1,00,000
Rs 13,00,000
Problem 12:
Extract from financial accounts of X, Y and Z Inc. Is:
| Year1 | Year 2 | ||
Assets Rs | Liabilities Rs | Assets Rs | Liabilities Rs | |
Stock | 10,000 |
| 20,000 |
|
Debtors | 30,000 |
| 30,000 |
|
Payment in advance | 2,000 |
| - |
|
Cash in hand | 20,000 |
| 15,000 |
|
Sundry debtors |
| 25,000 |
| 30,000 |
Acceptance |
| 15,000 |
| 12,000 |
Bank overdraft |
| - |
| 5,000 |
| 62,000 | 40,000 | 65,000 | 47,000 |
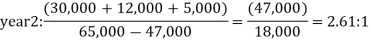
Sale amounted to Rs 3,50,000 in the first year and Rs 3,00,000 in the second year. You are required to comment on the solvency position of the concern with the help of accounting ratios.
Solutions
Short – term solvency analysis
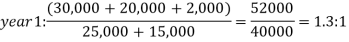
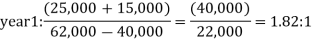
- Current ratio=

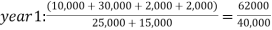 =1.55:1
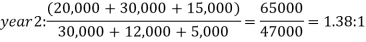
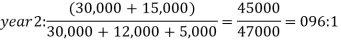
2. liquid or quick ratio = 
3. inventory turnover ratio=
4. inventory current asset ratio =
Year1 – 
Year 2- 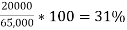
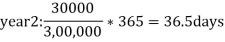
5. average collection period = 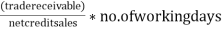

Long- term solvency analysis
- Debt equity ratio=

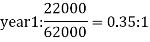
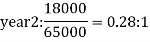
2. proprietary ratio is =
Problem 13:
Here is a summary balance sheet of concerns for December 31:
Balance sheet as on 31st December
Liabilities | Rs | Assets | Rs |
6% preference share |
| Goodwill | 20,000 |
Capital | 1,50,000 | Land & building | 2,50,000 |
Equity share capital | 2,50,000 | Machinery | 1,75,000 |
General reserve | 20,000 | Furniture | 10,000 |
Profit and loss | 15,000 | Stock | 90,000 |
5% debenture | 1,00,000 | Sundry debtors | 21,000 |
Sundry creditor | 28,000 | Cash at bank | 5,000 |
Bills payable | 12,000 | Preliminary expenses | 4,000 |
| 5,75,000 |
| 5,75,000 |
Other information – total sales Rs 4,00,000 :20% of which is made on credit . Gross profit and net profit (after tax) for the year ended amount to Rs 80,000 and Rs 20,000 respectively.
Comment on financial condition of the concern


Working
Stock Debenture Cash at bank |
Rs 90,000 21,000 5,000 1,16,000 |
2. current /liquid liabilities :
Sundry creditors Bills payable |
28,000 12,000 40,000 |
3. liquid asset :
Sundry debtor Cash at bank |
Rs 21,000 5,000 26,000 |
4. fixed asset :
Land and building Machinery Furniture |
Rs 2,50,000 1,75,0000 10,000 4,35,000 |
5. proprietor’s fund:
Equity share capital Preference share capital General reserve Profit & loss A/c
Less: Goodwill Rs 20,000 Preliminary expenses 4,000
|
2,50,000 1,50,000 20,000 15,000 4,35,000
24,000 4,11,0000 |
6. total debts/ outside liabilities : 5% debenture Current liabilities |
1,00,000 40,000 1,40,000 |
7. shareholder’s equity Proprietor’s equity -preference share capital =Rs 4,11,000-Rs 1,50,000 |
2,61,000 |
8. total assets: Total fixed asset + total current asset Rs 4,35,000+Rs 1,16,000 |
5,51,000 |
Comments:
1. Liquidity and solvency positions:
The current ratio is 2.9. It means a current asset of Rs.2.90 is available for each rupee of current liability. The position is satisfactory based on the current ratio. However, the liquid ratio is 0.65:1. This means that most of the liquid assets make up stocks, and stocks are moving slowly. Therefore, the position of liquidity is not satisfactory.
2. Credit conditions:
The collection system is at fault because the debtor enjoys the credit facility for 96 days, which is beyond the normal period. The performance of the debt collection sector is poor.
3. Profitability:
Gross margin is 20%, which is a healthy sign. But the ratio of net profit is only 5%. This means that the operating costs are high.
4. Investment structure:
The debt equity ratio is 0.34: 1. This means that the company is not dependent on external liabilities. The position is satisfactory. The capital gearing ratio is also satisfactory. However, the fixed asset to business owner ratio reveals that the entire fixed asset is not purchased by the owner's interest. This means that the company depends on external liabilities. It is undesirable.
5. Return of owner's fund:
5% of sales is net profit and is available for owners. A low-return state is undesirable.
Equity turnover and sales to fixed assets are showing signs of unhealthy. Fixed assets are not used properly. That's a sign of a lower deal. The economic situation of the company is not healthy. The company can increase the return on investment by increasing production.
References:
- Https://www.yourarticlelibrary.com/accounting/financial-statements/meaning-financial-statements/financial-statement-analysis-meaning-objectives-and-limitations-firm/66775
- Https://www.accountingnotes.net/cost-accounting/financial-statements-analysis/financial-statements-analysis-objectives-and-procedure-types-limitations-and-tools/17042
- Https://courses.lumenlearning.com/boundless-finance/chapter/overview-of-ratio-analysis/#:~:text=Classification,activity%2C%20debt%2C%20and%20market.
- Https://bbamantra.com/ratio-analysis/
- Https://www.myaccountingcourse.com/financial-ratios/dupont-analysis
- Https://corporatefinanceinstitute.com/resources/knowledge/finance/dupont-analysis/
- Http://www.accountingexplanation.com/proprietory_ratio.htm
- Https://www.tradegecko.com/inventory-management/inventory-turnover-formula#:~:text=Also%20known%20as%20inventory%20turns,(COGS)%20by%20average%20inventory.
- Https://www.wallstreetmojo.com/stock-turnover-ratio-formula/
- Https://bansi203.files.wordpress.com/2016/07/problems-and-solutions-ratio-analysis-_-finance-assignment.pdf


