UNIT II
Absorption Costing and Marginal Costing, Cost Volume and Profit Analysis
Meaning of absorption costing
Absorption costing
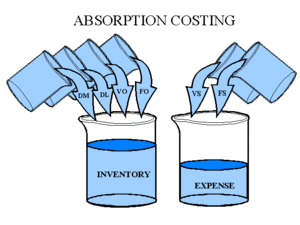
Absorption costing is also known as total costing or total costing or traditional costing. It's a technique of cost confirmation. With this method, both fixed and variable costs are charged to the product or process operation. Therefore, the cost of a product is determined by considering both fixed and variable costs.
With this technique, the cost per unit remains the same only if the output levels are the same. However, as production levels change, so does the cost per unit, as there is fixed costs that remain constant. Changes in cost per unit due to changes in production volume of absorption costing methods cause problems for management in management decision-making.
Absorption costing is useful when you have only one product, no inventory, and overhead recovery is based on normal capacity rather than actual activity level. Two distinguishing features of absorption costing are that fixed factory costs are included in (i) unit price and (ii) inventory value.
Confirmation of profit in absorption costing:
This costing method uses the following performers to check profits:
INCOME STATEMENT
Sales | Rs | Rs |
Less: Cost of Goods Manufactured: Direct Materials Direct Labour |
Xxx Xxx | Xxx |
Factory Overheads: Variable Fixed (at actual production basis) |
Xxx Xxx |
|
Xxx | ||
Problem 1:
The following data is related to XYZ Company.
Normal capacity 40,000 units per month
Variable cost Rs per unit. 6.6.
The actual production volume is 44,000
Sales 40,000 units @ Rupee 15 per unit
Fixed manufacturing overhead Rs. 1,000,000 or per month Rs 2.50 per unit with normal capacity.
Solution:
INCOME STATEMENT
Sales (40,000 × Rs.15) | Rs
| Rs 6,00,000 | |
Less: Cost of goods manufactured: Variable cost @ Rs. 6 per unit for 44,000 units. Fixed manufacturing overheads @ Rs. 2.50 for 44,000 units |
2,64,000 1,10,000 | ||
| 3,74,000 34,000 | ||
Less: Closing inventory (4,000/44,000) ×Rs. 3,74,000 | |||
| 3,40,000 | ||
Less: 0verabsorption of fixed manufacturing overheads (Rs. 1,10,000 – Rs. 1,00,000) |
10,000 |
| |
Gross Profit Less: Other fixed expenses Net Income |
| 3,30,000 | |
2,70,000 2,40,000 | |||
30.000 | |||
Benefits of Absorption Costing:
The main benefits of absorption costing are:
- We properly recognize the importance of including fixed manufacturing costs in determining product costs and developing appropriate pricing policies. In fact, all costs associated with production (fixed and variable) must be charged to the unit manufactured. Prices based on absorption costing ensure that all costs are covered. If the full amount is basic, the price is well regulated.
- Compared to variable costing, the correct profit calculation is displayed when production is done for future sales (such as seasonal sales).
This helps to adhere to the concept of incurred and matching, which requires matching revenue and cost for a particular time period.
Iii. Recognized by various agencies as FASB (US), ASC (UK) and ASB (India) for the purpose of preparing external reports and valuing inventory.
Iv. Avoid cost separation into fixed and variable elements that cannot be done easily and accurately.
v. Disclose inefficient or efficient use of production resources by indicating under absorption or over absorption of factory overhead
Vi. Correct allocation and allocation of fixed factory overhead helps managers become more responsible for the costs and services provided to the center / department.
Vii. Useful for calculating gross profit and net profit separately in the income statement.
Absorption costing limits:
The main limits of absorption costing are:
1. Difficulty in comparing and managing costs:
The absorption cost depends on the output level. Therefore, different unit prices are obtained for each output level. Increased production usually results in lower unit prices, and lower production results in higher costs per unit due to the presence of fixed costs. This makes it difficult to compare and manage costs.
2. Not useful for management decisions:
Absorption costing makes administrative decisions such as choosing the right product mix, buying or manufacturing, accepting export orders, choosing alternatives, the minimum price fixed during a recession, the number of units, etc. Selling products to get the desired profit is one of the examples of above.
3. Costs have dropped due to fixed costs included in inventory valuation.
In absorption costing, end-of-term inventory is valued at manufacturing costs, including fixed costs, so some of the fixed costs are carried forward to the next period.
4. Include fixed costs in unjustified costs:
Many accountants argue that fixed manufacturing, management, sales and distribution overheads are term costs and should not be included in the cost of the product as they do not generate future profits.
5. Allocation of fixed overhead by any method:
The effectiveness of product costs with this approach depends on the correct allocation of overhead costs. But in reality, many overhead costs are allocated using any method, and ultimately product costs are inaccurate and unreliable.
6. Not useful for flexible budget preparation:
There is no distinction between fixed and variable costs in absorption costing. You cannot make a flexible budget without this distinction.
Introduction to marginal costing
Preface
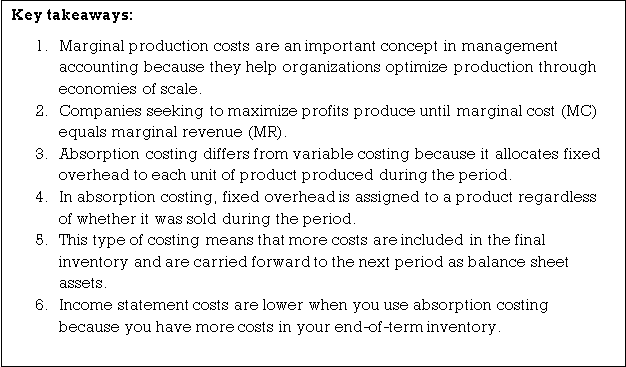
Marginal costs aren't a costing method like costing jobs, batches, or contracts. It's actually a technology costing that only considers variable manufacturing costs when determining cost of products sold. It also can be wont to evaluate inventory. In fact, this system is predicated on the subsequent basic principles. The total costs are often divided into fixed and variable. Although total fixed costs remain constant in the least levels in production, variable costs still change counting on the extent of production. Will increase if there's production When production decreases, it increases and reduces incremental cost method helps supply Relevant information to assist management make decisions in several areas ahead folks. Allocate all manufacturing costs to the merchandise , whether the merchandise is fixed or variable. This approach is known as Absorption Costing / Total Costing. However, only variable costs are relevant to deciding. This is referred to as marginal / variable cost.
Marginal cost: The term incremental cost refers to the number at a specific production volume. If the assembly volume is modified by 1 unit, the entire cost are going to be charged. Therefore, it is Additional or additional cost of additional output units. Marginal costs show that there's certainly some change in production wherever there's a change. Changes in total cost it's associated with fluctuations in variable costs. Fixed costs are treated as a period it costs money and is transferred to the P & L account. This is a costing system that treats only fluctuating manufacturing costs as product costs. Fixed manufacturing overhead is taken into account period cost.
Simple steps to know the above theory:
- As the output increases, the traditional cost per unit decreases. On the contrary, within the case of output
- As it decreases, the value per unit increases.
Example: When a factory produces 1000 units at a complete cost of Rs.3,000 and increases production by one the cost goes up to Rs.3,002, and therefore the incremental cost of additional output is Rs.2. (3002-3000). If there are multiple output increases, dividing the entire rise by the entire output increase Shows the typical incremental cost per unit.
Example: The output has increased from 1000 units to 1020 units, and therefore the total cost to supply these units is Rs.1,045, average incremental cost per unit is Rs.2.25. (That is, additional cost / additional unit = 45/20 = Rs.2.25)
Assumption:
- Variable costs change in direct proportion to the extent of activity
- Sales unit price remains constant
- No change thanks to inventory
Marginal cost:
- Marginal costs are often defined as "confirmation by distinguishing between fixed and variable costs."
- Costs, marginal costs, and therefore the impact on profits of changes in production volume or sort of production. "
- The costs of the costing procedure are divided into fixed and variable costs. According to J. Batty, the incremental cost is "the costing method is
- Cost behaviour thanks to changes in production volume. This definition focuses on confirmation. In addition to marginal costs, the impact of changes in production volume and kinds of production volume on corporate profits.
- In other words, incremental costs are often defined as a way for presenting fluctuating cost data. Costs and glued costs are displayed separately for management decisions. Got to be clearly understood
- The incremental cost isn't a costing method like process costing or job costing. Rather it's just Methods or techniques for analyzing cost information for management guidance
Marginal cost characteristics
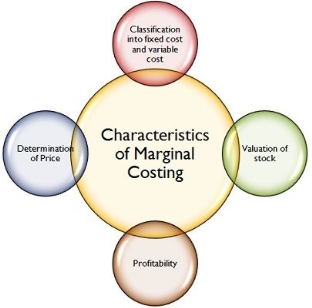
(1) All elements of cost are classified into fixed costs and variable costs.
(2) Incremental cost may be a method of cost management and deciding.
(3) Variable costs are billed as manufacturing costs.
(4) Inventories of work-in-process and finished products are evaluated supported variable costs.
(5) Profit is calculated by subtracting fixed costs from contributions. In other words, it's the surplus of the asking price Marginal cost of sales.
(6) Profitability of varied levels of activity is decided by cost volume profit analysis
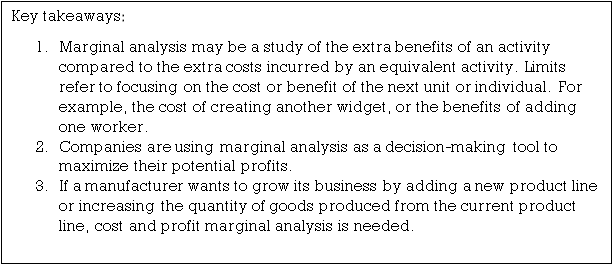
Marginal cost as a tool of decisions making
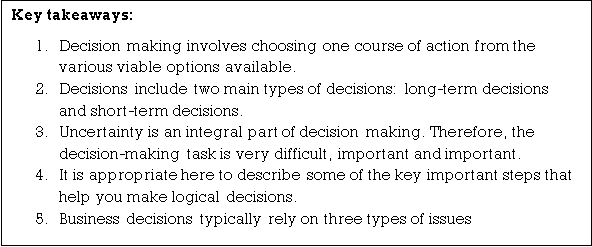
Decision making involves choosing one course of action from the various viable options available. Many quantitative and qualitative aspects need to be taken into account in decision making. The manager chooses the course of action he considers most effective in achieving his goals, solve a problem. Decision making is an integral part of all management functions such as planning, organization, coordination and management. All decisions are futuristic in nature and involve management predicting what is likely to happen, but that is highly uncertain. The term "cost" has multiple nuances. The meaning is different in various situations. Cost calculators play a key role in decision making by scrutinizing each situation, deciding what type of cost concept to use, and making accurate and relevant data available to management “Will play. “
Decisions include two main types of decisions: long-term decisions and short-term decisions.
Short-term decisions are usually special in nature. The specificity of information for decision making depends on the specific circumstances that require the decision. Here, such information is referred to as "related data." Short-term decisions are affected almost within a year. Such short-term operational decisions can include many special, non-regular decisions, such as decisions and purchases. Sell or process; accept or reject orders and other decisions.
Due to long-term decisions, management needs to look beyond this year. The time value of money and the rate of return on investment are key considerations in the long run.
Determining the period. Uncertainty is an integral part of decision making. Therefore, the decision-making task is very difficult, important and important.
A business decision is the act of making a decision about something, a position, an opinion, or a judgment that will be reached after some consideration. Business decision-making is the process of choosing from several options, products, or ideas and taking action.
Decision-making steps:
It is appropriate here to describe some of the key important steps that help you make logical decisions.
1. Problem Definition and Clarification: The first step is to define the problem clearly and accurately for decision making so that the quantitative data associated with the solution can be determined. You need to identify possible alternative solutions to your problem. The more alternative solutions you consider the more complex the problem can be. Then a suitable scanning device will help remove the unattractive choices.
2. Data collection and analysis: If the decision maker feels the need in this regard, he can ask for more information. In fact, many decisions are improvised by obtaining more information, and it is usually possible to obtain such information.
3. Problem analysis: Every option has its own strengths and weaknesses. Decision makers need to make decisions based on the strength of the problem. To determine the maximum net benefit, you need to observe the problem from different perspectives.
4. Confirm alternative actions: The decision maker identifies the course of alternative actions. Select possibilities by calculating different cost structures and revenues under each option
5. Evaluation of each option: There are two types of aspects.
- Quantitative and qualitative aspects. The decision maker observes all the benefits and limitations of the various aspects and gets the best option to strengthen the company.
6. Alternative Choices: After defining, collecting, analyzing, checking, and evaluating various alternatives, decision makers can choose alternatives and get started.
7. Evaluation of Results: After making a decision, the decision maker should ask for an evaluation of the results on a regular basis. This will help him correct his mistakes, correct his goals and make better predictions for the future. In this regard, many techniques are used for decision making as follows:
a) Marginal cost
b) Break-even point analysis
c) Difference cost analysis
Management decision-making issues:
Business decisions typically rely on three types of issues:
1. Crisis: Crisis problems are serious problems that require immediate attention.
2. Non-crisis: Non-crisis problems that need to be resolved
At the same time, it has the characteristics of crisis importance and immediacy.
3. Opportunity Issues: Opportunity issues are situations that, if appropriate measures are taken, are likely to bring significant benefits to the organization.
Marginal costing Vs absorption costing
Absorption costing
Absorption costing is also known as total costing or total costing or traditional costing. It's a technique of cost confirmation. With this method, both fixed and variable costs are charged to the product or process operation. Therefore, the cost of a product is determined by considering both fixed and variable costs.
Distinction between Absorption Costing and Marginal Costing
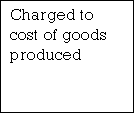 The distinction in these two techniques are illustrated by the following diagrams
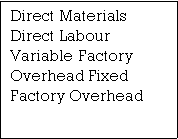
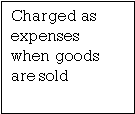


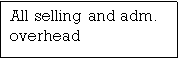

Fig. 1 Absorption Costing Approach


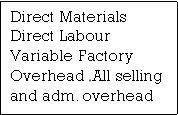
Fig Marginal Costing Approach
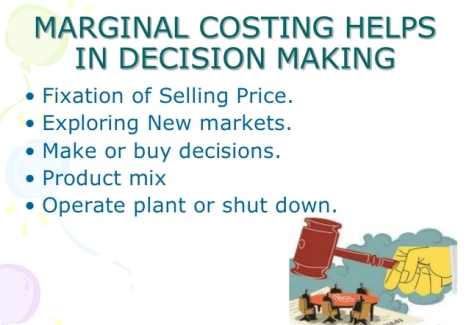
Application of marginal cost
Marginal cost is a very useful cost calculation method and has great potential for management in various fields. Administrative tasks and decision-making processes regarding the application of marginal costs.
- Cost Control: One of the key challenges facing management is managing costs. In today's competitive environment, rising selling prices to improve profit margins it is dangerous because it can lead to loss of market share. Another way to improve profits is to reduce costs. Cost management, Cost control aims to ensure that costs do not rise above current levels. Marginal cost techniques help with this task by separating variable and fixed costs. Fixed costs remain Variable costs vary depending on production, regardless of production. Certain fixed cost items cannot be managed at the middle or subordinate level. In these situations, it is advisable to focus on variable costs for cost control purposes. Since then, separation of costs between fixed and variable costs is done at marginal costs and concentration. It is a variable cost rather than a fixed cost, which allows unnecessary efforts to manage the fixed cost.
- Profit Planning: Another important use of marginal costs is in the area of profit planning. A plan, commonly known as a budget or operational plan, may be defined as a future plan. Operations to achieve defined profit targets. Marginal cost methods help generate the data you need For profit planning and decision making. For example, calculating profits when there is a change in Impact on profit if there is a change in product composition, selling price, and change in profit if there is one of the products Decisions regarding changes in sales structure if there are discontinuances or new product introductions. Some of the areas of profit planning that can generate the information needed by the limits Cost for decision making. Therefore, the separation of fixed and variable costs is very convenient.
- Key Factor Analysis: Management should consider the following when planning. When various resources are constrained. These constraints are limiting factors or the main budget factors described in the "Budget and Budget Management" topic. These important factors could be raw material availability, skilled worker availability, machine time availability, or market Product demand. Marginal costs help management determine the optimal production plan in the following ways. Use scarce resources in the most profitable way, thereby optimizing your profits. For example
Ingredients are an important factor, their availability is limited to a certain quantity, and the company we manufacture three products, A, B and C. In such cases, the marginal cost method helps prepare a statement indicating the amount of contribution per kg of material. Products with the highest yields Contribution per kg of raw material is prioritized and produced as much as possible. After that, other products are picked up in order of priority. Therefore, the resulting product mix is Best profit in a given situation
- Decision Making: Management decision making is a very important function of any organization decision. The creation should be based on relevant information. Through the marginal cost method Information on cost behaviour is provided in the form of fixed and variable costs. The Separation of costs between fixed and variable helps administrators predict cost behaviour various options. Therefore, it makes decisions easier. Some decisions
In some decisions, the resulting income is the deciding factor, while the basis for comparative cost analysis. Marginal costs help generate both types of information, so the decision is as follows. It's not intuitive, it's rational and factual. Some of the key areas of decision making is listed below:
- Decision or purchase decision
- Approval or rejection of export proposal
- Fluctuations in selling price
- Variations in product composition
- Changes in sales composition
- Key factor analysis
- Evaluation of various alternatives for improving profits
Department closure / continuation
Marginal costing - Advantages and limitations of marginal costing
Marginal cost benefits
(1) Cost-volume-profit relationship data required for the purpose of profit planning is Normal accounting statement. Therefore, the administrator does not have to work with two separate data sets to associate one with the other.
(2) Profit for a certain period of time is not affected by changes in absorption of fixed costs due to the building or reduce inventory. Others remain the same (eg selling price, cost, selling composition), profits move in the same direction as sales when using direct costing.
(3) Manufacturing costs and income statements in direct cost format follow management's ideas.
Strictly more than the absorption cost form of these statements. Because of this, management finds it Easy to understand and use direct cost reports.
(4) The impact of fixed costs on profits is emphasized in the total amount of fixed costs during that period. It will be displayed on the income statement.
5) Marginal income figures are for products, regions, customer classes, and Other segments of the business without obscuring the results due to the allocation of joint fixed costs.
(6) Marginal costs are in effective planning for cost management such as standard costs and flexible budgets.
(7) Marginal costs not only provide a better and more logical basis for fixing selling prices. Bid on contracts when your business is sluggish.
(8) Last but not least, the break-even point can only be determined based on marginal costs.
Marginal cost limit
The marginal cost calculation method has the following restrictions.
(1) In marginal costs, costs are classified into fixed costs and variable costs. Separate costs into fixed and fixed Variables are pretty difficult and can't be done exactly.
(2) Marginal cost is based on the premise that the behaviour of cost can be expressed by a straight line. This means fixed costs remain fully fixed for a period of time at various levels, and variable costs vary linearly.
The pattern, or change, is proportional to the change in volume. In real life, fixed costs tend to fluctuate. At various levels of production, especially if additional plants and equipment are introduced, therefore variable costs may not change at the same rate as volume
(3) Under the marginal cost method, fixed costs are not included in the value of finished product inventory. And work in process. There are fixed costs, so these also need to be part of the cost of the product. Due to this elimination of fixed costs from finished inventory and work in process, inventory is Modest. This affects the income statement and balance sheet results. Therefore, the profit is contracted unnecessarily.
(4) In the marginal cost system, monthly business reports are not realistic or useful as follows Absorption costing system. This is because this system has different marginal contributions and benefits with changes in sales. If sales occur occasionally, profits will fluctuate from period to period.
(5) Marginal costs do not provide complete information. For example, it could be due to increased production and sales Extensive use of existing machines or expansion of resources or replacement of labor Mechanical force. The small contribution of the P / V ratio cannot derive this reason.
(6) Under the marginal cost system, the difficulties associated with the allocation and calculation below Over absorption of fixed overhead is eliminated, but the problem remains as long as it is below. There are concerns about absorption or over absorption of fluctuating overhead.
(7) Marginal costs may be useful for short-term evaluation of profitability, but long-term profits. It is determined correctly only on a full cost basis.
(8) Marginal cost does not provide a basis for performance evaluation. Limit Contribution data do not reveal many of the benefits provided by ANOVA. The difference in efficiency reflects the efficient and inefficient use of plants, machinery and labor and this kind of thing. In the marginal cost analysis, the valuation is insufficient.
(9) Marginal cost analysis assumes that the selling price per unit remains the same at different levels. Production, but these can change in real life and have unrealistic consequences.
(10) What is the impact of fixed costs on products in an era of advances in automation and technology? Much more than variable cost as a result, fewer systems do not consider fixed costs. It is effective because it does not take into account a significant portion of the cost.
(11) The selling price according to the marginal cost method is fixed based on the contribution. This may not be the case. This is possible in the case of a "cost plus contract". Therefore, the above restrictions have a fixed cost. It is just as important in certain cases.
Cost Volume and Profit Analysis

Break-even analysis is additionally referred to as cost-volume profit analysis. Break-even point analysis is a relationship between asking price, sales volume, fixed costs, variable costs, and profits at various level activity. Break-even analysis may be a widely used technique for studying the cost-volume-profit relationship narrow
Here, the entire cost is adequate to the entire asking price. The broader interpretation refers to the analytical system. Determines expected profits for all levels of activity. It describes the connection between production costs, Production volume and sales value.
Here, CVP analysis is additionally commonly performed, but it's not accurate, but it's called "break-even point analysis". The difference between the 2 terms is extremely narrow. CVP analysis includes full range Break-even analysis is one among the techniques utilized in this process. But as mentioned the above break-even point analysis techniques are so popular in CVP analysis research that the 2 terms are used as a synonym. For the needs of this investigation, we also these two terms to know the concept of break-even analysis, it's helpful to understand the following specific basic terms listed below application
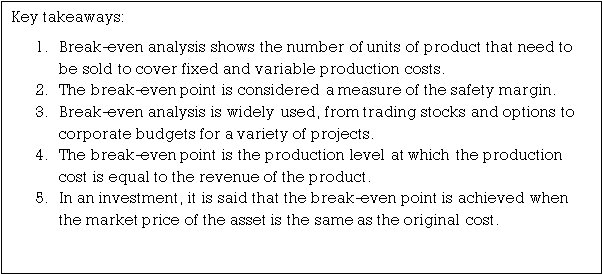
- You’ll use break-even analysis to work out your company's break-even point (BEP).
- The break-even point is that the level of activity where total revenue is adequate to total cost. At this level, the corporate doesn't make a profit
1. Contribution
This is a more than the asking price that exceeds the variable cost also called "gross profit". The amount of profit (loss) is often confirmed by deducting fixed costs from contributions. In other words, it had been fixed Costs and benefits correspond to contributions. It is often expressed by the subsequent formula.
Contribution = Selling Price – Variable Cost or Contribution = Fixed Cost + Profit = Contribution – Fixed Cost
Profit / Volume ratio (P / V ratio)
This term is important for studying the profitability and profit ratio of operating a business.
Establish a relationship between contribution and sales. The ratio can be displayed in the following format Percentage too. The expression can be expressed as:
This ratio can also be found by comparing changes Contribution to changes in sales or changes in profits due to changes in sales. Increased contribution. Fixed costs are assumed to be constant at all production levels, which mean increased profits.
Therefore,
P/V Ratio (or, C/S ratio) = Contribution S𝑎𝑙𝑒𝑠 = C S or, P/V Ratio = Sales−Variable Cost S𝑎𝑙𝑒𝑠 = S−V S or, 1- Variable Cost S𝑎𝑙𝑒
This ratio is also known as the "contribution / sales" ratio. This ratio can also be found by comparing changes Contribution to changes in sales or changes in profits due to changes in sales increased contribution. Fixed costs are assumed to be constant at all production levels, which mean increased profits.
Therefore, Thus, P/V Ratio = Change in Contribution by Change in S𝑎𝑙𝑒𝑠 or, P/V Ratio = Change in Profit (or Loss) Change in S𝑎𝑙𝑒
The characteristics of the P / V ratio are as follows.
(I) Helps administrators see the total amount of contribution to a particular sale.
(II) The selling price and the variable cost per unit are constant or constant as long as they are constant. It fluctuates at the same rate.
(III) Not affected by changes in activity level. In other words, the PV ratio of the product. The amount of activity is the same whether it is 1,000 units or 10,000 units.
(IV) Fixed costs are not considered at all, so the ratio is also unaffected by fluctuations in fixed costs while calculating the PV ratio. For multi-product organizations, PV ratios are very important for management to decide which one to find. The product is more profitable. Management is trying to increase the value of this ratio by reducing variable costs or by raising the selling price.
3. Break-even point: A point that indicates the level of output or sales by dividing the total cost and sales price evenly. There is no profit or loss, it is considered a break-even point. At this point, business income exactly equal to that spending. If production is boosted beyond this level, profits will be generated in the business. And if it decreases from this level, the loss will be incurred by the business. Here it is appropriate to understand the different concepts of marginal costs and break-even points. Go further. This is explained below.
It's neither a profit nor a loss. Therefore, at the break-even point, the contribution is equal to the fixed cost.
Contribution = Fixed cost (1) Break-even point (in units) = Fixed Cost Contribution per unit (2) Break-even point (in amount) = Fixed Cost Contribution per unit x Selling Price per unit Or, = Fixed Cost Total Contribution x Total Sales Or, = Fixed Cost 1− Variable Cost per unit Selling price per unit = Fixed Cost P/V Ratio
Sales at break-even point = break-even point x selling price per unit
At the break-even point, the desired profit is zero. When calculating production or sales
You need to add a fixed amount of "desired profit" or "target profit" "desired profit" or "target profit" The cost of the above formula. For example:
(1) No. Of units at Desired Profit = Fixed Cost+Desired Profit Contribution per unit (2) Sales for a Desired Profit = Fixed Cost+Desired Profit P/V Ratio
(2) Sales at break-even point = break-even point x selling price per unit
(3) At the break-even point, the desired profit is zero. When calculating production or sales
(4) You need to add a fixed amount of "desired profit" or "target profit" "desired profit" or "target profit"
(5) The cost of the above formula. For example:
Break-even point analysis: Relationship between selling price, sales volume, fixed costs, variable costs, and profits at various levels activity application.
- You can use break-even analysis to determine your company's break-even point (BEP).
- The break-even point is the level of activity where total revenue is equal to total cost.
- At this level, the company does not make a profit
Break-even point analysis assumptions
- Related range
- The relevant range is the range of activities for which fixed costs remain fixed in total.
- Variable costs per unit remain constant
- Fixed costs
- Total fixed costs are assumed to be constant in total Variable cost
- Total variable costs increase because the number of units produced increases Sales
- Total revenue increases as the number of units produced increases Safety range


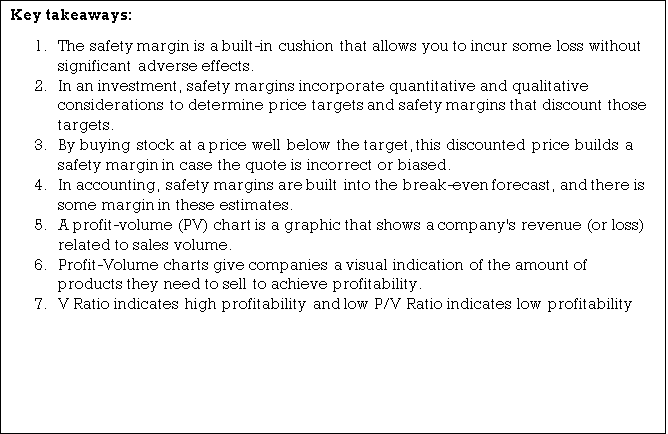
Graphic presentation Margin of safety –Key factor
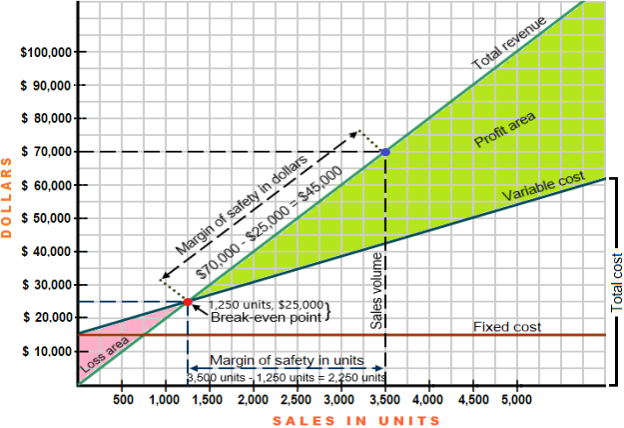
In the CVP graph above, the red dots represent the break-even point for sales of $ 1,250 units or $ 25,000. The blue dots represent the total sales volume of 3,500 units or $ 70,000. The safety margin is shown as the difference between the total sales volume and the sales volume required at the break-even point shown in both dollars and units.
The safety margin can be calculated for one month, one quarter, or one year. However, monthly or quarterly calculations do not make sense if sales fluctuate significantly from season to season. In these situations, you need to use annual data to calculate the safety margin.
If you know the safety margin and one of the other two equation elements, you can easily calculate the third element. Consider Examples 3 and 4.
Problem 2:
Break-even sales and calculation of actual sales given a safety margin
The break-even point for Best Inc. Was $ 65,000 in the first quarter of 2016. If the safety margin is $ 45,000, we will calculate the actual sales for the first quarter.
Solution
Safety Margin = Actual Sales-Break-even Sales
$ 45,000 = Actual Sales – $ 65,000
Actual sales = $ 45,000 + $ 65,000
Actual sales = $ 110,000
Problem 3:
Calculate break-even sales given actual sales and a safety margin
Fine Distributors is a trading company. It provides the following data:
Actual sales: $ 75,000
Safety Margin: $ 15,000
Calculates break-even sales for Fine Distributors
Solution
Safety Margin = Actual Sales-Break-even Sales
$ 15,000 = $ 75,000 – Break-even sales
Break-even sales = $ 75,000 – $ 15,000
Break-even sales = $ 60,000
Determining safety margins for SMEs
Kumar Hathiramani and Pak Melwani have opened a soup restaurant named Soup Nutsy in Canada. Today, Soup Nutsy has numerous successful branches in many cities, offering a variety of delicious soups, amazing quality and excellent customer service.
Owners Hathiramani and Melwani reported the following data on the first branch of the restaurant in the first year of operation.
Annual sales: $ 900,000
Net income: $ 210,000
Price per meal: $ 6
Cost per meal: $ 2
From the above information, you can determine the safety margin of Soup Nutsy in three steps. The first step is to calculate the annual variable and fixed costs of the restaurant. The second step calculates the break-even point and the third step calculates the safety margin in dollars and percentages.
Step 1: Calculate variable and fixed costs
Soup Nutsy has a variable cost of $ 2 per meal and a price of $ 6 per meal. Therefore, the ratio of variable costs to sales is 2/6 or 1/3. According to this relationship, the total variable cost is $ 300,000 (= $ 900,000 x 1/3).
The annual fixed cost can be calculated using the following equation approach:
Variable costs + fixed costs + profit = sale
$ 900,000 = $ 300,000 + fixed costs + $ 210,000
$ 900,000 = 300,000 + fixed costs + $ 210,000
Fixed costs = $ 900,000 – $ 300,000 – $ 210,000
Fixed cost = $ 390,000
Step 2: Calculate break-even point
Now that we know the fixed cost figures, we can express the break-even point Soup Nutsy in dollars and units as follows:
Break-even point of unit = fixed cost / unit contribution margin
= $ 390,000 / $ 4 *
= 97,500 units
* Unit contribution margin:
= Per unit sales price – per unit of variable cost
= $ 6 – $ 2
= $ 4
Break-even point in dollars = break-even point in units x asking price per unit
= 97,500 × $ 6
= $ 585,000
Step 3: Calculate safety margin
Safety Margin (MOS) ($) = $ 900,000 – 585,000
= $ 315,000
MOS ratio = $ 315,000 / $ 900,000
= 0.35
MOS percentage = MOS ratio x 100
= 0.35 × 100
= 35%
Safety Margin
The safety margin is the difference between actual sales and break-even sales. As we discussed
At the break-even point, there's no profit or loss. Therefore, every company is interested in always being present
It is above the break-even point as much as possible. The safety margin explains exactly this and more the better the safety margin, the better. The safety margin is calculated as follows:
Safety Margin = Actual Sales-Break-even sales. The safety margin also can be expressed as a percentage amount of sales Safety range
- Shows business health
- High Safety Margin – BEP is well below actual sales
- The safety margin is a measure of the amount of sales that a company can lose before it suffers a loss.
- This will be expressed as variety of units or a percentage of sales
- Shows business health
- High Safety Margin – BEP is well below actual sales
- The safety margin is a measure of the amount of sales that a company can lose before it suffers a loss.
- This will be expressed as variety of units or a percentage of sales
- Shows the health of the business
- High Safety Margin – BEP is well below actual sales
- The safety margin is a measure of the amount of sales that a company can lose before it suffers a loss.
- This will be expressed as variety of units or a percentage of sales
You can improve your safety margin in the following ways:
(A) Raise the selling price
(B) Reduction of variable costs
(C) Selection of product composition for items with a larger PN ratio
(D) Reduction of fixed costs
(E) Increase output
Formulae:
Margin of safety = Sales – BEP sales
Margin of safety = Sales – fixed cost/ PV ratio
Margin of safety = Sales x PV ratio – Fixed cost / PV ratio
Margin of safety = Contribution – Fixed cost/ PV ratio
Margin of safety = Profit / PV ratio
Cost volume profit analysis
Cost Volume Profit Analysis (CVP) is a systematic way to look at the relationships between changes. Total sales, costs, net income production and changes in other words it is an analysis of the relationships that exist between cost, sales, output, and the resulting profits. It provides information on the following:
2. Volume-related cost behaviour
3. Volume of production or sales where the business is the break-even point
4. Sensitivity to profits due to fluctuations in production
5. Profit amount against expected sales volume
6. Volume of production and sales at target profit level. Therefore, cost-volume-profit analysis can be defined as a management tool that shows the relationship between them. Various elements of profit planning: cost (both fixed and variable), selling price, and Such an analysis can help financial managers in the following ways:
- It helps him predict profits fairly accurately.
- You can check the cost based on this relationship, which helps you to set a flexible budget. Sales and profits at different levels of activity.
- It also helps him evaluate performance for business management purposes.
- Predicting the impact of different price structures will help you develop pricing policy Cost and profit.
- Helps determine the amount of overhead charged for different levels of operation.
- Overhead is usually pre-determined based on the production volume selected
Therefore, cost-volume-profit analysis is an important medium for management to gain insights. Impact of fluctuations in costs (both fixed and variable) and sales (both both fixed and variable) on profits Value) and make the right decisions. The following research is essential to understand the relationship between cost, volume, and profit.
(1) Marginal cost calculation formula
(2) Break-even point analysis
(3) Profit volume ratio (or) PN ratio
(4) Profit graph
(5) Main factors
(6) Sales composition
Purpose of cost volume profit analysis.
The key objectives of cost volume profit analysis are:
- The principle of marginal cost is used. Management can establish what will happen to the financial results at a particular level.
- The activity or volume fluctuates. It is useful for determining the break-even point and the output level required to obtain the desired profit.
The P / V ratio functions as a measure of efficiency for each product, factory, sales area, etc. Management to select the most profitable business.
7. Helps predict the level of sales needed to maintain a constant profit at different levels of the price.
Basic Equation Profit
- Sales – Total cost Profit = Sales – (Variable cost + Fixed cost
- Profit = Sales – Variable cost – Fixed cost
- Profit + Fixed cost = Sales – Variable cost
- Sales – Variable cost = Fixed cost + profit
- Sales – Variable cost = Contribution
- Contribution =Fixed cost + profit
- Contribution – Fixed cost = Profit
Marginal Cost Equation Contribution is the difference between the sales an marginal cost. Thus, contribution is calculated by the following formula:
- Contribution = Sales – Variable cost
- Or, C = S - V………..
(i) Profit = Contribution – Fixed cost
- Or, P = C - F, or, C = F + P……….
(ii) Therefore, contribution may be said to be equal to Fixed Cost-plus Profit (loss).
Contribution contributes towards the recovery of fixed costs and the balance is profit.
Equating (i) and (ii), we get, S - V = F + P……..
(iii) Sales – Variable cost = Fixed cost + profit At Break-even point, there is neither profit nor loss (i.e., Total cost = Total Sales) so that P = 0 (zero)
- S - V = F + P……..(iii)
- Or, S - V = F + 0 or, S = F + V………
(iv) So, Sales = Fixed Cost + Variable Cost (at B.E.P.) or, Sales = Total Cost (at B.E.P.)
The concept of contribution is extremely helpful in the study of Break-even analysis and managerial decision making. Profit Volume Ratio (P/V) Symbolically, P/V Ratio (or, C/S ratio) is expressed as follows:
- P/V Ratio (or, C/S ratio) =
- Contribution S𝑎𝑙𝑒𝑠 = C S For determining different requirements, different formulae are available:
(a) P/V Ratio = Sales−Variable Cost S𝑎𝑙𝑒𝑠 = S−V S or, 1- Variable Cost S𝑎𝑙𝑒𝑠 (b) P/V Ratio = Fixed Cost Profit (or loss) S𝑎𝑙𝑒𝑠 = F+P (or L) S (c) P/V Ratio = Change in Contribution Change in S𝑎𝑙𝑒𝑠 (d) P/V Ratio = Change in Profit (or Loss) Change in S𝑎𝑙𝑒
 P/V Ratio indicates the rate at which profit is being earned. A high P/V Ratio indicates high profitability and low P/V Ratio indicates low profitability.
Problem 4:
Everest Snow Company manufactures "Everest Snow" for 10,000 rupees per month and sells it directly to consumers. 1.25 Per bottle. The company's normal production capacity is 20,000 bottles of snow per month.
Below is an analysis of the cost of 10,000 bottles.
| Rs |
Direct Material | 1,000 |
Direct Labour | 2,475 |
Power | 140 |
Jars | 600 |
Lise. Supplies | 430 |
Fixed Expenses of manufacturing, selling and administration | 7,955 |
Total | Rs. 12,600 |
The company received an offer to export under another brand name of 120,000 bottles of snow, 10,000 bottles per month for 75 Paisa bottles.
Write a short report on the adequacy of accepting the offer or anything else.
Solution:
Marginal Cost Statement | ||||
| Per Unit | Present Capacity 50% | Proposed another 50% capacity @ 75 paise per unit | Total 100% capacity |
Sales (units) Sales (Value) Less : Marginal Cost : Direct Material Direct Labour Power Mise.Supplies Jars |
Rs
0.1000 0.2475 0.0140 0.0430 0.0600 | 10,000 Rs
1,000 2,475 140 430 600 | 10,000 Rs
1,000 2.475 140 430 600 | 20,000 Rs
2,000 4,950 280 860 1,200 |
0.4645 | 4,645 | 4,645 | 9,290 | |
Contribution Fixed Cost | 0.7845 | 7,855 7,955 | 2,855 _ | 10,710 7.955 |
Profit/Loss |
| (-)100 | 2,855 | 2,755 |
At the current activity level, 10,000 units, Rs will be lost. The variable cost is only Re, but 100. 0.4645. Against the selling price of Rs. 1.25 per unit. The reason is that the total cost per unit (including fixed costs) is Rs. 1.26 per unit.
However, if an additional 10,000 units are sold, it will be converted into a loss of Rs. For a profit of 100 rupees. The additional offer of 10,000 units is 2,755, even though there are only 75 Paisa’s per unit.
This is due to the fact that additional sales make a contribution to Rs. 2,855, or (Rs. 0.75-0.4645 or 0.2855 per unit). He should accept the offer as the additional sale makes a contribution and does not include additional fixed costs.
However, before making a final decision, the following points need to be further considered:
- Export costs, if any
- Risk or re-import of the same goods into the domestic market, and the occurrence of competition with itself.
- Impact of lower export prices on the domestic market.
- Alternative use of surplus capacity.
Problem 5:
Cycle Company Ltd. The price structure of the cycle created by is as follows:
| Per Cycle Rs |
Materials | 60 |
Labour | 20 |
Variable Overheads | 20 |
| 100 |
Fixed Overheads | 50 |
Profit | 50 |
Selling Price | 200 |
It is based on the production of a cycle of 10,000 rupees per year.
The company expects to lower selling prices due to competition, but wants to maintain gross profit.
What level of production do you need to reach if: So how many cycles do you need to run to get the same amount of profit?
- Reduced the selling price will be by 10%.
- The selling price will be reduced by 20%.
Solution:
Fixed Overheads = Rs. 50 per cycle
Present Profit = Rs. 50 per cycle
Total No, of Cycles = 1lakh
Fixed Costs = 50 × 1 = Rs 50 lakh
Total Present Profit = Rs 50 lakhs
Desired Sales =
Fixed Cost + Profit / (P/V Ratio) = Fixed Cost+ Profit/Contribution per unit
(a) If the selling price is reduced by 10%
New Selling price = 200-10% = 200-20 = Rs 180
Hence, = 50,00,000 + 50,00,000 /180-100
= 1,00,000/80 = 1,25,000 cycles
(b) If the selling price is reduced by 20%
New Selling Price = 200-20% = 200-40 = 160
Problem 6:
The manufacturer found in his workshop that the cost of creating part number 0.51 was Rs. 8.00 each, the same is on the market with Rs. 6.50 guaranteed continuous supply. Suggest creating or buying this component.
Please also state your opinion in case the supplier cuts the price from Rupees. 6.50 And rupees 5.50. The cost data is as follows:
|
|
Materials | 3.00 |
Direct labour | 2.00 |
Other Variable Expenses | 1.00 |
Depreciation and other Fixed Expenses | 2.00 |
8.00 | |
Solution:
There is a fixed cost whether or not this part is manufactured, so the decision depends on the marginal cost of manufacturing the part, which is calculated as follows:
Marginal Cost of Component 0.51 (per unit) | Rs |
Material | 3.00 |
Direct Labour | 2,00 |
Other Variable Expenses | 1.00 |
| 6.00 |
If the marginal cost of creating a component is lower than the purchase price, it is advisable to create the component itself. This is because every component created makes some contribution to the company. However, if the marginal cost is higher than the purchase price, it is better to buy it externally than to make the parts.
In the above example, if the purchase price is Rs. 6.50, it is not recommended to purchase components from outside. We should rather make our own components, as every component manufactured gives a 50-pay contribution. However, do not manufacture the component if it is available in Rs. 5.50 from the outside. In that case, it is better to buy than to make.
Problem 7:
LMN Ltd. Purchases 20,000 bells annually from external Rs suppliers. 5 each. Management feels that these are manufactured, not purchased. A machine that costs Rs. 50,000 is required for in-factory production. The annual production capacity of this machine is 30,000 and the life is 5 years.
The following additional information is available:
Material cost per bell Rs 2,00
Labour cost per bell Rs 1,00
Variable overheads 100% of labour cost
(A) Bells must continue to be purchased from external suppliers or manufactured at the factory.
(B) The company must accept an order to supply 5000 bells to the market at a selling price Rs. 4.50 per unit?
Marginal cost of manufacture per bell | Rs |
Material Labour Variable Overheads (100% of Direct Labour) | 2.00 1.00 1.00 |
4.00 |
Additional fixed manufacturing costs p.a.
Depreciation (50,000 x 1/5) = Rs. 10,000
This is because the marginal cost of manufacturing a bell is lower than the price of the supplier's Rs. There are 5, Rs savings (Rs. 5-4) one for each bell if the bell is manufactured in the factory. However, there is an additional fixed cost of Rs for manufacturing 10,000 p.a. Therefore, the total savings should be compared to this additional cost.
Therefore, the company must accept orders to manufacture bells in the factory and supply 5000 bells in Rs. 4.50 each.
(a) Total savings (contribution) for 20,000 bells = Rs 20,000 × 1.00 =Rs 20,000
Less: addition fixed cost = RS 10,000
Profit (Net Savings) = Rs. 10,000
Thus, it is advisable to manufacture these bells within the factory.
(b) If the company accepts the order to supply 5000 bells at Rs 4.50 per unit, it will result into an additional contribution (profit) of Rs. 2,500 as calculated below:
Selling price per unit Rs. 4.50
Marginal cost per unit Rs. 4.00
Contribution per unit Rs 0.50
Total contribution on 5000 bells RS 5000×0.50 = Rs 2,500
Total Net savings (a+b) Rs 10,000 + 2,500 = Rs. 12,500
Problem 8:
In factories that produce two types of goods, the limiting factor is the availability of labor. The following information shows which products are more profitable:
| Product A Cost per unit | Product B Cost per unit |
Materials | 5.00 | 5.00 |
Labour : 6 Hours @ Re, 0.50 3 Hours @ Re. 0.50 | 3.00 |
1.50 |
Overheads : Fixed – 50% of labour Variable Total Cost Selling Price Profit Total Production for the month | 1.50 1.50 11.0 14.00 3.00 500 | 0.75 1.50 8.75 11.0 2.25 600 |
The maximum capacity per month is 4800 hours. Please provide evidence to support your answer.
Solution:
|
|
| Product A (per unit) Rs | Product B (per unit) RS | |||
Selling price |
|
| 14.00 | 11.00 | |||
Less: Variable Cost: | A Rs | B Rs |
|
| |||
Materials | 5.00 | 5.00 |
|
| |||
Labour | 3.00 | 1.50 |
|
| |||
Overheads | 1.50 | 1.50 |
|
| |||
|
|
|
|
| |||
Contribution per unit
Labour Hours requires per unit
Contribution per hour
Hence, product B is more profitable (because of more contribution per hour |
|
| 9.50 4.50 6 hours
4.50/6
0.75 | 8.00 3.00 3 hours
3.00/3
1.00 | |||
Proof | |||||||
| Product A | Product B
| |||||
Maximum Capacity per month | 4800 hours | 4800 hours | |||||
Labour hours required per unit | 6 hours | 3 hours | |||||
Maximum Capacity in units | 4800/6 = 800 | 4800/3 = 1600 | |||||
| Rs | Rs | |||||
Materials | 4,000 | 8,000 | |||||
Labour @ Rs 0.50 per hour for 4800 hours | 2,400 | 2,400 | |||||
Overheads : Fixed – 50% of labour Variable @ Rs 1.50 per unit
Total Cost Sales
Profit |
1,200 1,200
8,800 (800 × 14) 11,200 2,400 |
1,200 2,400
14,000 (1600 × 11) 17,600 3,600 | |||||
Problem 9:
To provide a clear indication to management, we provide the following information:
(A) Marginal production cost and contribution per unit.
(B) Total contributions and benefits from each of the following mixtures:
Mixtures for sale:
- 100 units of product A and 200 units of B.
- 150 units of product A and 150 units of B.
- 200 units of product A100 B.
Solution:
|
|
| Product A (per unit) Rs | Product B (per unit) RS | |||
Selling price |
|
| 14.00 | 11.00 | |||
Less: Variable Cost: | A Rs | B Rs |
|
| |||
Materials | 5.00 | 5.00 |
|
| |||
Labour | 3.00 | 1.50 |
|
| |||
Overheads | 1.50 | 1.50 |
|
| |||
|
|
|
|
| |||
Contribution per unit
Labour Hours requires per unit
Contribution per hour
Hence, product B is more profitable (because of more contribution per hour |
|
| 9.50 4.50 6 hours
4.50/6
0.75 | 8.00 3.00 3 hours
3.00/3
1.00 | |||
Proof | |||||||
| Product A | Product B
| |||||
Maximum Capacity per month | 4800 hours | 4800 hours | |||||
Labour hours required per unit | 6 hours | 3 hours | |||||
Maximum Capacity in units | 4800/6 = 800 | 4800/3 = 1600 | |||||
| Rs | Rs | |||||
Materials | 4,000 | 8,000 | |||||
Labour @ Rs 0.50 per hour for 4800 hours | 2,400 | 2,400 | |||||
Overheads : Fixed – 50% of labour Variable @ Rs 1.50 per unit
Total Cost Sales
Profit |
1,200 1,200
8,800 (800 × 14) 11,200 2,400 |
1,200 2,400
14,000 (1600 × 11) 17,600 3,600 | |||||
Sales composition (c), that is, 200 units A and 100 units B, is the most profitable and therefore more profitable.
Problem 10:
The following data is available from company records.
Rs
Sales 60,000
Variable Cost 30,000
Fixed Cost 15,000
You need to do the following:
(A) At this level, calculate the P / V ratio, break-even point, and safety margin.
(B) Calculate the impact of a 10% increase in selling price.
(C) Calculate the impact of a 10% drop in selling prices.
Solution:
(a) P/V Ratio = Contribution / Sales × 100
Contribution = Sales – Variable Cost
= RS 60,000 – 30,000
P/V Ratio = 30,000/60,000 × 100 = 50%
Break – Even Point = Fixed Cost/P/V Ratio
= 15,000 ×100 /50 = Rs 30,000
Margin of Safety = Present Sales – Sales at B.E.P.
= Rs 60,000 – Rs 30,000 = Rs 30,000
(b) Effects of 10% increase in Sales Price :
Sales + Rs 60,000 + 10% = Rs 66,000
P/V Ratio = Contribution / Sales ×100
= 66,000 – 30,000 / 66,000 × 100 = 36,000/66,000 × = 54.5%
Break - Even Point = Fixed Cost/P/V Ratio = Fixed Cost / Total Contribution × Total Sales
= 15,000/36,000 × 66,000 = Rs 27,500
Margin of Safety = Actual Sales – Sales T B.E.P.
= 66,000 – 27,500 = Rs 38,500
(c) Effects of 10% decrease in Sales Price :
Sales = Rs 60,000 – 10% = Rs 54,000
P/V Ratio = Contribution/Sales × 100
= 54,000 – 30,000/ 54,000 × 100 = 24,000 / 54,000 × 100 = 44.44%
Break – Even Point = Fixed Cost/Total Contribution × Sales
= 15,000/24,000 × 54,000 = Rs 33,750
Margin of Safety = Actual Sales – Sales at B.E.P.
= 54,000 – 33,750 = Rs. 20,250
Problem 11:
Product "A" can be manufactured on either Machine X or Machine Y. Machine X can produce 50 units of "A" per hour, and Machine Y can produce 100 units per hour. The total machine time available is 2000 hours per year.
Consider the following cost data to determine a profitable manufacturing method.
Per Unit of Product ‘A’
Machine X Machine Y
Rs Rs
Direct material 8 10
Direct wages 12 12
Variable Overheads 4 4
Fixed Overheads 5 5
Total 29 31
Selling Price 30
Problem 12:
The factory, which manufactures plastic buckets, operates with a production capacity of 40% and produces 10,000 buckets annually.
Rs
Material 10
Labour Cost 3
Overhead 5 ( 60% Fixed)
The current cost breakdown for a bucket is as follows:
His selling price is rupees 20 per bucket.
If it is decided to operate the factory at 50% capacity, the selling price will drop by 3%. At 90% capacity, the selling price is reduced by 5%, as is the price of the material.
You need to calculate the profit with 50% and 90% capacity, and also the break-even point of capacity production.
Solution:
Output at 40% Capacity = 10,000 units
Therefore, Output at 50% Capacity = 10,000 × 50/40 = 12,500 units
And Output at 90% capacity = 10,000 × 90 /40 = 22,500 units
Profitability Statement at 50% and 90% Capacities | ||||
| 50% Capacity | 90% Capacity | ||
| Per unit Rs | Total Rs | Per unit Rs | Total Rs |
(a) Sales | 19.40 (20 - 3×20/100) | 2,42.500 | 1900 (20-5×20/100) | 4,27,500 |
(b)Variable Cost: Materials
Wages Variable Overhead(40% of Rs 5) Total Variable Cost |
10.00
3.00 2.00
|
1,25.00
37.500 25.000
|
9.50 (10-5×10/100) 3.00 2.00
|
2,13,750
67.500 45,000
|
15.00 | 1,87.500 | 14.50 | 3,26,250 | |
(c) Contribution (a-B) | 4.40 | 55,000 | 4.5001,01,250 |
|
(d) Fixed Overheads (60% of Rs 5) i.e., (10,000×3) |
| 30,000 |
| 30,00 |
(e) Profit (c-d) |
| 25,000 |
| 71.250 |
Fixed Expenses
Break-Even Point = Fixed Expenses/Contribution per unit
B.E.P., at 59% Capacity = 30,000/4.40 = 6.818 units
B.E.P., at 90% Capacity = 30,000/4.50 = 6.667 units
Problem 13:
Management at one company believes that product B, one of the three main lines, is less profitable than the other two lines, and as a result, no special efforts have been made to increase sales.
The selling prices and costs for these products are as follows:
Product | Selling Price | Direct Material |
Dept. X | Direct Labour Dept. Y |
Dept. Z |
| Rs | Rs | Rs | Rs | Rs |
A | 50 | 10 | 4 | 2 | 2 |
B | 40 | 6 | 2 | 4 | 2 |
C | 45 | 8 | 2 | 2 | 4 |
The overhead costs of each department per rupee for direct labor are as follows:
Product | Selling Price | Direct Material |
Dept. X | Direct Labour Dept. Y |
Dept. Z |
| Rs | Rs | Rs | Rs | Rs |
A | 50 | 10 | 4 | 2 | 2 |
B | 40 | 6 | 2 | 4 | 2 |
C | 45 | 8 | 2 | 2 | 4 |
What advice would you give management about the profitability of Product B? Please give a reason.
Solution:
Comparative Profitability Statement | ||||||
| Product A | Product B | Product C | |||
| Rs | Rs | Rs | Rs | Rs | Rs |
Selling Price |
| 50.00 |
| 40.00 |
| 45.00 |
Less: Marginal Cost |
|
|
|
|
|
|
Direct Material | 10.00 |
| 6.00 |
| 8.00 |
|
Direct Labour | 8.00 |
| 8.00 |
| 8.00 |
|
Variable Overhead: Dept. X Dept. Y Dept. Z |
5.00 1.00 2.00
|
26.00 |
2.50 2.00 2.00 |
20.50 |
2.50 1.00 4.00 |
23.50 |
Contribution |
| 24.00 |
| 19.50 |
| 21.50 |
P/V Ratio |
24.00/50 × 100 | 48% |
19.50/40 × 100 | 48.75% |
21.50/44×100 | 47.77% |
Conclusion:
Product B has the highest P / V ratio, making it the most profitable product line.
Problem 14:
The following data is relevant to the companies that manufacture the three products A, B, and C.
A B C
Production (units) 2000 2400 3000
Cost per unit Rs RS Rs
Material 5 8 12
Labour 2 4 3
Variable Overhead 1 2 1
Fixed Overhead 6 5 6
14 19 22
Selling price per unit 20 25 30
Profit per unit 6 6 8
The production manager proposes to discontinue one production line. We promise to double the existing production of the remaining two lines. Do I need to advise management if the proposal is accepted and, if so, which production line should be shut down?
Solution:
Calculation of Fixed Cost |
| Rs. | |||
Product A: | 2000 units @ Rs. 6 per unit | 12,000 | |||
Product B: | 2400 units@ Rs. 5 per unit | 12,000 | |||
Product C : | 3000 units @ Rs. 6 per unit | 18,000 | |||
Total |
| 42,000 | |||
Marginal Cost Statement | |||||
| Product A Rs. | B Rs. | C Rs. | ||
Selling Price (per unit) | 20 | 25 | 30 | ||
Less: Marginal/Variable Cost Material Labour Variable Overhead |
5 2 1 |
8 4 2 |
12 3 1 | ||
| 8 | 14 | 16 | ||
Contribution (per unit) | 12 | 11 | 14 | ||
(a) If the product A is discontinued, the production of B and C will be double:
Production of B 2400 × 2 = 4800 units
Production of C 3000 × 2 = 6000 units
Contribution Rs
Product B 4800 × 11 = 52,00
Product C 6000 × 14 = 84,000
Total Contribution 1,36,800
Less: Fixed Cost 42,000
Profit 94,800
(b) If the product B is discontinued, the product of A and C will be double:
Production of A 2000 × 2 = 4000 units
Production of C 3000 × 2 = 6000 units
Contribution Rs
Product A 4000 × 12 = 48,000
Product C 6000 × 14 = 84,000
Total Contribution 1,32,000
Less: Fixed Cost : 42,000
Profit 90,000
(c) If product C is discontinued, the production of A and B will double:
Production of A = 2000 × 2 = 4000 units
Production of B = 2400 × 2 = 4800 units
Contribution Rs
Product A = 4000 × 12 = 48,000
Product B = 4800 × 11 = 52,800
Total Contribution 1,00,800
Less: Fixed Cost 42,000
Profit 58,000
(d) If the existing production of three products is continued:
Contribution Rs
Product A = 2000 × 12 = 24,000
Product B = 4800 × 11 = 52,800
Product C = 3000 × 14 = 42,000
Total Contribution 92,400
Less: Fixed Cost 42,000
Profit 50,400
From the above analysis, it is clear that discontinuing product A will maximize profits, so management recommends discontinuing product A and doubling production of products B and C.
Problem 15:
Certified accountant practice now uses re. The taxi fare for the client's work is 0.90 per kilometre. He is considering buying two other options, a new small car or an old large car.
The estimated cost figures are as follows:
Items | New Small Car Rs | Old Bigger Car Rs |
Purchase Price | 35,000 | 20,000 |
Sale Price, after 5 years | 19,000 | 12,000 |
Repairs & Servicing(per annum) | 1,000 | 1,200 |
Taxes & Insurance, per annum | 1,700 | 700 |
Petrol Consumption, per litre | 10 km | 7 km |
Petrol price Rs 3.50 per litre |
|
|
He estimates that he will run 10,000km every year. Which of the three options will be cheaper? What should the decision be if his practice expands and he has to do 19,000 km a year? How many kilometres per year do the cost of the two cases reach the break-even point? What is the reason? Ignore interest and income tax.
Solution:
Comparative Cost Statement | |||
| New Small Car Rs | Old Bigger Car Rs | Taxi
Rs |
Purchase Price | 35,000 | 20,000 |
|
Less: Sales Price (after 5yrs) | 19,000 | 12,000 |
|
Depreciation for 5yrs | 16,000 |
|
|
Depreciation for One yrs | 32,000 |
|
|
Repaired and Serving | 1,000 |
|
|
Taxes & Insurances | 1,700 |
|
|
Fixed Cost, per annum | 5,900 |
|
|
Variable Cost per annum: (i) Petrol for 10,000km. New Small Car @ Rs 3.50 for 7 km Old Big Car @ Rs 3.50 for 7 km
(ii) Petrol for 19,000 km. Total Cost (Fixed + Variable) For 10,000 km. For 19,000 km |
3,500 |
|
|
6,650 | 9,500 |
| |
9,400
12,550 | 8,500
13,000 |
9,000 (10,000 × 0.90) 17,100 (19,000 × 0.90) | |
Conclusion:
In the current practice, which requires 10,000 km, older heavy vehicles are the cheapest because the annual cost is Rs. The lowest of the three options is 8,500. But if his practice expands to 19,000 km, the new compact car will be the cheapest and the annual cost will be Rs. 12,550.
Calculation of Km where the cost of two cars is the break-even point:
- Variable cost of a new 10,000km compact car. Rs. 3,500
- Variable cost of new small cars per km. = (3,500 / 10,000) = Re. 0.35
- Variable cost of 10,000km old large car. = Rs. 5,000
- Variable cost of large vehicles per km. = 5,000 / 10,000 = Re. 0.50
- Difference between variable costs of two cars = 0.50 – 0.35 = Re. 0.15
- The difference between the fixed costs of two cars = rupees. 5,900 – 3,500 = Rupees 2,400
- Therefore, break-even point = difference in fixed costs / difference in variable costs per km = 2,400 / 15 × 100 = 16,000 km
Proof:
At 16,000 km, the total cost of the two cars is:
| New Car Rs | Old Car Rs | ||
Fixed Cost |
| 5,900 |
| 3,500 |
Variable Cost | (16.00 × 0.35) | 5,600 | (16,000× 0.50) | 8,000 |
Total Cost |
| 11,500 |
| 11,500 |
References:
- Https://www.slideshare.net/kiran2512/marginal-costing-concepts#:~:text=%EF%83%98%20Definition%20%3A%2D%20Marginal%20Costing,the%20relationship%20between%20profit%20%26%20volume.
- Https://businessjargons.com/marginal-costing.html
- Https://www.projecttopics.org/marginal-costing-essential-tool-decision-making-manufacturing-company.html
- Https://papers.ssrn.com/sol3/papers.cfm?abstract_id=2417024
- Https://link.springer.com/chapter/10.1007/978-1-349-90655-0_14#:~:text=Marginal%20costing%20is%20a%20very,of%20potential%20products%20to%20manufacture.
- 6. Https://www.investopedia.com/terms/a/absorbed
- Cost.asphttps://en.wikipedia.org/wiki/Break-even_(economics)


