Unit 1
Human Resources and Economic Development
In ordinary sense, human resource refers the population of the country but in economics, the healthy, educated, and skilled manpower is known as human resource. So, human resource is that the process of improving quality and efficiency of the people.
According to the National planning commission, “Human resource is that the knowledge, skill, efficiency and physical and brain to do work inherent within the people of the country”.
Role of Human Resources in Economic Development
Human resources play the important role in overall development of a country. Capital, natural resources, also as other productive resources remain inactive within the nature. Human resources are necessary to mobilize them. Nepal has sufficient natural resources and utilization of those resources in necessary for economic development. The role of human resource is often explained with the help of following points.
1. Utilization of Natural resources:
Human resources are necessary for the utilization of natural resources like mineral, water, forest etc. Utilization of these resources is necessary for economic development. Thus, only human resources mobilize and utilize them properly.
2. Compensate the deficiency of natural resources:
The utilization of human resource compensates the deficiency of natural resources. Many countries are poor in natural resources like Japan, Hong Kong, Singapore etc. but they're able to achieve high economic growth by properly utilizing human resource.
3. Utilization of physical capital:
Only the existence of physical capital can’t do anything for economic development. They should be properly utilized. To, operate machinery & equipment and to run factories and industries is impossible without the involvement of human resource.
4. Increase in production:
The human resources of a country help to increase within the production of various goods and services. By using skilled human resources, a country can produce the variety of goods and services having high quality.
5. Changes in technology:
Human resources of a country can bring the new technology. Advance technology is necessary to bring development in country.
6. Reform in tradition cultural and attitude:
The traditional culture, values, intestines and attitude are inimical to the development of developing countries including world. The educated manpower reforms the traditional cultural and attitude.
7. Increase in managerial capacity and entrepreneurship
Human resources increase the managerial capacity and entrepreneurship. It leads to innovation. The new production technique, new market and new technology are developed. This increases the production and national income.
8. Development of agriculture and industry:
The modern and superior technologies should be use for the modernization of agriculture and rapid industrializations. This is often made possible only by human resource. Theodore Schultz observes "It is just not possible to have the fruits of a modern agriculture and therefore the abundance of recent industry without making large investment in human being.
9. Remove economic background:
Human resource helps on to remove the economic backwardness. It increases labour efficiently and specialization. It increases labour mobility from which the executing resources are often made more productivity. The development of human resources increases the knowledge of natural resources. New production technique, market and opportunities of economic activities. The human resource also helps within the proper utilization of imported capital. These all lead to the rise in production, employment opportunities and levels of living of people.
Introduction
The Human Development Index (HDI) may be a statistic developed and compiled by the United Nations to measure and various countries' levels of social and economic development. It’s composed of four principal areas of interest: mean years of schooling expected years of schooling, life expectancy at birth, and gross value per capita. This index may be a tool used to follow changes in development levels over time and to compare the event levels of various countries.
Understanding the Human Development Index (HDI)
The Human Development Index (HDI) was established to place emphasis on individuals, more precisely on their opportunities to realize satisfying work and lives. Evaluating a country's potential for individual human development provides a supplementary metric for evaluating a country's level of development besides considering standard economic process statistics, like gross domestic product (GDP).
This index also can be wont to examine the various policy choices of nations; if, for instance, two countries have approximately an equivalent gross national income (GNI) per capita, then it can help to evaluate why they produce widely disparate human development outcomes. Proponents of the HDI hope it are often wont to stimulate such productive public policy debate.
Definition:
The Human Development Index (HDI) may be a statistical tool won’t to measure a country's overall achievement in its social and economic dimensions. The social and economic dimensions of a country are based on the health of people, their level of education attainment and their standard of living.
HOW IS THE HDI MEASURED?
The HDI may be a summary measurement of basic achievement levels in human development. The computed HDI of a country is a mean of indexes of every of the life aspects that are examined: knowledge and understanding, a long and healthy life, and an acceptable standard of living. Each of the four components is normalized to scale between 0 and 1, and then the mean of the three components is calculated.
The health aspect of the HDI is measured by the life expectancy, as calculated at the time of birth, in each country, normalized in order that this component is equal to 0 when life expectancy is 20 and equal to 1 when life expectancy is 85.
Education is measured on two levels: the mean years of schooling for residents of a country and therefore the expected years of schooling that a child has at the average age for starting school. These are each separately normalized in order that 15 mean years of schooling equals one, and 18 years of expected schooling equals one, and an easy mean of the 2 is calculated.
The metric chosen to represent the quality of living is GNI per capita based on purchasing power parity (PPP), a standard metric wont to reflect average income. The quality of living is normalized in order that it's adequate to 1 when GNI per capita is $75,000 and adequate to 0 when GNI per capita is $100. The ultimate Human Development Index score for every country is calculated as a geometric mean of the three components by taking the cube root of the product of the normalized component scores.
Limitations of the index
The HDI may be a simplification and an admittedly limited evaluation of human development. The HDI doesn't specifically reflect quality-of-life factors, like empowerment movements or overall feelings of security. In recognition of those facts, the Human Development Report Office (HDRO) provides additional composite indices to evaluate other life aspects, including inequality issues like gender disparity or racial inequality. Examination and evaluation of a country's HDI are best done in concert with examining these and other factors, like the country's rate of economic growth, expansion of employment opportunities, and therefore the success of initiatives undertaken to enhance the general quality of life within a country.
Several economists have raised the criticism of the HDI that it's essentially redundant as results of the high correlations between the HDI, its components, and simpler measures of income per capita. GNI per capita (or even GDP per capita) correlates very highly with both the overall HDI and therefore the other two components in both values and rankings. Given these strong and consistent correlations, it might be simpler and clearer to only compare per capita GNI across countries than to spend time and resources collecting data for the extra components that provide little or no additional information to the general index.
Indeed, a fundamental principle of the composite index design is to not include multiple additional components that are strongly correlated during a way that means that they could reflect the same underlying phenomenon. This is to prevent inefficient double counting and to avoid introducing additional sources of potential errors within the data.
In the case of HDI, the inclusion of the components is problematic because it's easily plausible that higher average incomes directly cause both more investment in formal education and better health and longevity, and definitions and measurement of years of schooling and life expectancy can vary widely from country to country.
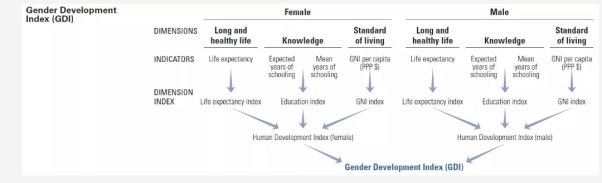
1.3.1 Gender Development Index
The GDI measures gender gaps in human development achievements by accounting for disparities between women and men in three basic dimensions of human development—health, knowledge and living standards using equivalent component indicators as within the HDI. The GDI is that the ratio of the HDIs calculated separately for females and males using the same methodology as within the HDI. It’s a direct measure of gender gap showing the female HDI as a percentage of the male HDI. For more details on computation see Technical Notes.
The GDI is calculated for 166 countries. Countries are grouped into five groups based on the absolute deviation from gender parity in HDI values. This suggests that grouping takes equally into consideration gender gaps favouring males, also as those favouring females.
The GDI shows how much women are lagging behind their male counterparts and the way much women need to catch up within each dimension of human development. It's useful for understanding the real gender gap in human development achievements and is informative to design policy tools to shut the gap.
The Gender Related Development Index (GDI) is an index designed to measure gender equality.
GDI together with the Gender Empowerment Measure (GEM) were introduced in 1995 within the Human Development Report written by the United Nations Development Program. The aim of those measurements was to feature a gender-sensitive dimension to the Human Development Index (HDI). The first measurement that they created as a result was the Gender-related Development Index (GDI). The GDI is defined as a "distribution-sensitive measure that accounts for the human development impact of existing gender gaps within the three components of the HDI" (Kaleen 243). Distribution sensitive means the GDI takes into account not only the averaged or general level of well-being and wealth within a given country, but focuses also on how this wealth and well-being is distributed between different groups within society. The HDI and the GDI (as well because the GEM) were created to rival the more traditional general income-based measures of development like gross domestic product (GDP) and gross national product (GNP).
Definition and Calculation
The GDI is usually considered a "gender-sensitive extension of the HDI" (Kaleen 245). It addresses gender-gaps in life expectancy, education, and incomes. It uses an "inequality aversion" penalty, which creates a development score penalty for gender gaps in any of the categories of the Human Development Index which include life expectancy, adult literacy, school enrolment, and logarithmic transformations of per-capita income. In terms of life expectancy, the GDI assumes that women will live an average of 5 years longer than men. Additionally, in terms of income, the GDI considers income-gaps in terms of actual earned income. The GDI cannot be used independently from the Human Development Index (HDI) score then, it can't be used on its own as an indicator of gender-gaps. Only the gap between the HDI and therefore the GDI can actually be accurately considered; the GDI on its own isn't an independent measure of gender-gaps.
How is GDI constructed?
In HDI, the life expectancy index at birth of a country is calculated. But within the case of GDI, life expectancy at birth for both male and feminine are calculated. After determining life expectancy at birth for male and female, these are combined during a way that ‘penalizes’ differences in achievement between men and women. The index thus obtained is called ‘equally distributed life expectancy index’.
The formula of this index is:
Equally distributed index = {[female population share (female index 1- ɛ)] + [male population share (male index 1- ɛ)]}
ɛ measures the inequality aversion. Within the GDI, ɛ is assumed to be equal to 2. If e = 0 then GDI equals HDI. As e tends to infinity gender inequality widens.
The calculation procedure of GDI involves the subsequent four steps:
(i) Calculating the Equally Distributed Life Index:
Out of 102.9 crore Indian population in 2001 census, male members (53.2 crore) exceeded female members. Life expectancies at birth for Indian women and men were 66.9 years and 63.9 years. Thus,
(ii) Calculating the Equally Distributed Education Index:
First, the adult literacy rates for ladies and men are determined. Secondly, the combined primary, secondary and tertiary gross enrolment ratios for ladies and men are calculated.
Now we'll calculate the education index for both women and men. To do this, two-thirds weight to the adult literacy index and one-third weight to the gross enrolment index are assigned to get both female and male education indices.
Education index = 2/3 (adult literacy index) + 1/3 (gross enrolment index)
Female education index = 2/3 (0.537) + 1/3 (0.753) = 0.551
Male education index = 2/3 (0.753) + 1/3 (0.660) = 0.722
(iii) Calculating the Equally Distributed Income Index:
(iv)Combining the female and male income indices, we calculate equally distributed income index:
CONTROVERSIES OF GDI
- General debates
In the years since its creation in 1995, much debate has arisen surrounding the reliability, and usefulness of the Gender Development Index (GDI) in making adequate comparisons between different countries and in promoting gender-sensitive development. The GDI is especially criticized for being often mistakenly interpreted as an independent measure of gender-gaps when it's not, in fact, intended to be interpreted therein way, because it can only be utilized in combination with the scores from the Human Development Index, but not on its own. Additionally, the info that's needed so as to calculate the GDI isn't always readily available in many countries, making the measure very hard to calculate uniformly and internationally. There's also worry that the combination of so many different developmental influences in one measurement could result in muddled results which perhaps the GDI (and the GEM) actually hide more than they reveal.
- Debates surrounding the life expectancy adjustment
More specifically, there has been tons of debate over the life-expectancy component of the Gender-related Development Index (GDI). As was mentioned previously, the GDI life expectancy section is adjusted to assume that ladies will live, normally, five years longer than men. This provision has been debated, and it's been argued that if the GDI was really looking to promote true equality, it might strive to attain the same life-expectancy for women and men, despite what could be considered a biological advantage or not. However, this might seem paradoxical in terms of policy implications, because, theoretically, this might only be achieved through providing preferential treatment to males, effectively discriminating against females. Furthermore, it's been argued that the GDI doesn't account for sex-selective abortion, meaning that the penalty levied against a country for gender inequality is less because it affects less of the population (see Sen, Missing Women).
- Debates surrounding income gaps
Another area of debate surrounding the Gender-related Development Index (GDI) is within the area of income gaps. The GDI considers income-gaps in terms of actual earned income. This has been said to be problematic because often, men may make more money than women, but their income is shared. Additionally, the GDI has been criticized because it doesn't consider the value of care work also as other work performed within the informal sector (such as cleaning, cooking, housework, and childcare). Another criticism of the GDI is that it only takes gender into account as a factor for inequality, it doesn't, however, consider inequality among class, region or race, which might be very significant. Another criticism with the income-gap portion of the GDI is that it's heavily dependent on gross domestic product (GDP) and gross national product (GNP). For most countries, the earned-income gap accounts for more than 90% of the gender penalty.
1.3.2 Gender Inequality Index
The gender inequality index (GII) provides insights into gender disparities in health, empowerment and the labour market. Unlike the human development index (HDI), however, higher values in the GII indicate worse achievements.
The Gender Inequality Index is a composite measure reflecting inequality in achievements between The GII is a composite measure, reflecting inequality in achievements between women and men in three dimensions: reproductive health, empowerment and the labour market.
- The health dimension is measured by the maternal mortality ratio and the adolescent fertility rate.
- The empowerment dimension is measured by the share of parliamentary seats held by each gender, and by secondary and higher education attainment levels.
- The labour dimension is measured by women's participation in the workforce.
The GII varies between 0 (when women and men fare equally) and 1 (when men or women fare poorly compared to the other in all dimensions). It is designed to reveal the extent to which national human development achievements are eroded by gender inequality, and to provide empirical foundations for policy analysis and advocacy efforts.
This index includes maternal mortality rates (from UNESCO) and women's parliamentary representation. The Gender Inequality Index (GII) attempts to deal with some of these limitations by adding three new dimensions which reflect women's reproductive health status, empowerment and labour market participation in comparison to men. It also excludes income which is seen to be less relevant in developing countries. The desegregation of data ensures that high achievement in one dimension does not compensate for low achievement in another dimension. The GII value increases as gender inequalities increase. One of the major advantages of the index is seen to be the ability for it to capture the linkages across different dimensions for example schooling and access to work. The GII does not however capture other relevant dimensions such as time-use, access to assets, domestic violence, and local-level empowerment.
Gender inequality remains a major barrier to human development. Girls and women have made major strides since 1990, but they have not yet gained gender equity. The disadvantages facing women and girls are a major source of inequality. All too often, women and girls are discriminated against in health, education, political representation, labour market, etc.—with negative consequences for development of their capabilities and their freedom of choice.
The GII is an inequality index. It measures gender inequalities in three important aspects of human development—reproductive health, measured by maternal mortality ratio and adolescent birth rates; empowerment, measured by proportion of parliamentary seats occupied by females and proportion of adult females and males aged 25 years and older with at least some secondary education; and economic status, expressed as labour market participation and measured by labour force participation rate of female and male populations aged 15 years and older. The GII is built on the same framework as the IHDI—to better expose differences in the distribution of achievements between women and men. It measures the human development costs of gender inequality. Thus, the higher the GII value the more disparities between females and males and the more loss to human development.
The GII sheds new light on the position of women in 162 countries; it yields insights in gender gaps in major areas of human development. The component indicators highlight areas in need of critical policy intervention and it stimulates proactive thinking and public policy to overcome systematic disadvantages of women.

1.3.3 Human Poverty Index
The Human Poverty Index (HPI) was first introduced into the Human Development Report by the United Nations Development Programme (UNDP) in 1997 in an effort to bring together during a composite index the various features of deprivation within the quality of life to reach an aggregate judgment on the extent of poverty during a community.
That is, if human development is seen as enlarging choices and expanding freedoms to enjoy a decent standard of living, freedom, dignity, self-respect and therefore the respect of others, then measures of poverty should check out the deprivation of those freedoms.
Therefore the HPI looks at deprivations within the three basic dimensions captured within the Human Development Index: a long and healthy life, as measured by the probability of not surviving past the age of 40; knowledge, or exclusion from it, as measured by the adult literacy rate; and an honest standard of living, or lack of essential services, as measured by the percentage of the population not using an improved water source and therefore the percentage of children underweight for his or her age.
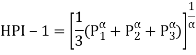
There are tree indicators of the human poverty index (HPI):
• Survival: the likeliness of death at a relatively early age and is represented by the probability of not surviving to ages 40 and 60 respectively for the HPI-1 and HPI-2.
• Knowledge: being excluded from the world of reading and communication and is measured by the percentage of adults who are illiterate.
• Decent standard of living: in particular, overall economic provisioning.
HOW TO CALCULATE HPI
For developing countries:
The formula for calculating it is:

P1: probability at birth of not surviving to age 40 (times 100)
P2: adult illiteracy rate
P3: arithmetic average of 3 characteristics:
- The percentage of the population without access to safe water
- The percentage of population without access to health services
- The percentage of malnourished children under five
a:3
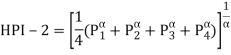
FOR SELECTED HIGH-INCOME OECD COUNTRIES (HPI-2)
The Human Development Reports website summarizes this as "A composite index measuring deprivations in the four basic dimensions captured in the human development index — a long and healthy life, knowledge and a decent standard of living — and also capturing social exclusion." The formula for calculating it is:

P1: probability at birth of not surviving to age 60 (times 100)
P2: adults lacking functional literacy skills
P3: population below income poverty line (50% of median adjusting household disposable income)
P4: rate of long-term unemployment (lasting 12 months or more)
a:3
1.3.4 Global Hunger Index
India ranked 101 out of 116 in the Global Hunger Index (GHI) for 2021 from 94 in the previous year, trailing behind Pakistan, Bangladesh and Nepal. The Global Hunger Index report termed the level of hunger in India as “serious”, which is better than its performance in 2000, when the levels of hunger were ‘alarming’.
Only 15 countries have fared worse than India. These include Papua New Guinea (102), Afghanistan (103), Nigeria (103), Congo (105), Mozambique (106), Sierra Leone (106), Timor-Leste (108), Haiti (109), Liberia (110), Madagascar (111), Democratic Republic of Congo (112), Chad (113), Central African Republic (114), Yemen (115) and Somalia (116). Eighteen countries, including China, Brazil and Kuwait, shared the top rank with a GHI score of less than five.
What is the Global Hunger Index and who releases this data?
The Global Hunger Index is published annually by Concern Worldwide, Ireland’s largest aid and humanitarian agency and Welthungerhilfe, one of the largest private aid organisations in Germany. The two are “dedicated to tackling poverty and suffering in the world’s poorest countries. The first GHI report was published in 2006 and the index is intended to be “a tool designed to comprehensively measure and track hunger at global, regional, and national levels".
The GHI assesses a country’s performance on four component indicators:
Undernourishment: the share of the population that is undernourished (that is, whose caloric intake is insufficient);
Child wasting: the share of children under the age of five who are wasted (that is, who have low weight for their height, reflecting acute undernutrition);
Child stunting: the share of children under the age of five who are stunted (that is, who have low height for their age, reflecting chronic undernutrition); and
Child mortality: the mortality rate of children under the age of five (in part, a reflection of the fatal mix of inadequate nutrition and unhealthy environments).
The GHI determines hunger on a 100-point scale, where 0 is the best possible score (no hunger) and 100 is the worst. Each country’s GHI score is classified by severity, from low to extremely alarming.
How did India score?
In the 2021 Global Hunger Index, India ranked 101 out of the 116 countries with a score of 27.5, India has a level of hunger that is 'serious'. According to the report, 15.3 per cent of the country's population is undernourished, while 17.3% of children under the age of five are wasted, and 34.7 per cent of children under the age of 5 are stunted. 3.4 per cent of children die before their fifth birthday. India has the highest child wasting rate of all countries covered in the index.
"Since 2000, India has made substantial progress, but there are still areas of concern, particularly regarding child nutrition. India’s GHI score has decreased from a 2000 GHI score of 38.8 points considered alarming to a 2021 GHI score of 27.5 considered serious. The proportion of undernourished in the population and the under-five child mortality rate are now at relatively low levels. While child stunting has seen a significant decrease from 54.2 percent in 1998–1999 to 34.7 percent in 2016–2018 it is still considered very high. At 17.3 percent according to the latest data India has the highest child wasting rate of all countries covered in the GHI. This rate is slightly higher than it was in 1998–1999, when it was 17.1 percent," said the report.
Why is the government so upset with this ranking?
Upset over the low rankings, the government alleged the publishing agencies didn't do their due diligence before releasing the report. The government has questioned the undernourishment data provided by the Food and Agriculture Organisation, which it says is based on a ‘four question’ telephone poll. Point to note: This is also the only indicator in the report that has shown a deterioration in India, the other three have either improved or remained unchanged. According to FAO’s data, which is used in the Index, the prevalence of undernourishment in India rose from 14% in 2017-2019 to 15.3% in 2018-2020. The government has alleged that a “selective approach" has been "adopted by the publishing agencies to deliberately lower India’s rank on the GHI 2021”.
Secondly, the government has said the index disregarded the effort made to feed people during the pandemic. This is because the poll failed to ask if the respondent received food support from the government.
Thirdly, the government argued that the index should have relied on height and weight to assess undernourishment.
Fourth, the Ministry of Women and Child Development also said that it is not possible to evaluate the extent of malnutrition for the period before 2018 as there were no growth monitoring devices available at angan wadis until they were introduced under the Poshan Abhiyaan. In fact, real-time data from the government’s POSHAN portal shows that only 3.9% of the children served by government programs are undernourished.
“The real time data of beneficiaries registered on the Anganwadi platform include 7.79 crore children aged between 6 months to 6 years as per real-time Poshan Tracker data [as on 16-10-2021]. Corresponding number of undernourished children reported on Poshan Tracker is 30.27 lakh which comes to only 3.9%,” the Ministry pf Women and child development was quoted as saying by newspaper.
References:
- Bhole, L.M., impacts of Monetary Policy, Himalaya Publishing House, New Delhi.
- Kayndepatil, G.V, Agricultural Economies: Theory & Policy, Chaitanya Publi. Nasi
- Ann Larkin Hansen, The Organic Farming Manual, Storey Publishing, North Adams.
Unit 1
Human Resources and Economic Development
In ordinary sense, human resource refers the population of the country but in economics, the healthy, educated, and skilled manpower is known as human resource. So, human resource is that the process of improving quality and efficiency of the people.
According to the National planning commission, “Human resource is that the knowledge, skill, efficiency and physical and brain to do work inherent within the people of the country”.
Role of Human Resources in Economic Development
Human resources play the important role in overall development of a country. Capital, natural resources, also as other productive resources remain inactive within the nature. Human resources are necessary to mobilize them. Nepal has sufficient natural resources and utilization of those resources in necessary for economic development. The role of human resource is often explained with the help of following points.
1. Utilization of Natural resources:
Human resources are necessary for the utilization of natural resources like mineral, water, forest etc. Utilization of these resources is necessary for economic development. Thus, only human resources mobilize and utilize them properly.
2. Compensate the deficiency of natural resources:
The utilization of human resource compensates the deficiency of natural resources. Many countries are poor in natural resources like Japan, Hong Kong, Singapore etc. but they're able to achieve high economic growth by properly utilizing human resource.
3. Utilization of physical capital:
Only the existence of physical capital can’t do anything for economic development. They should be properly utilized. To, operate machinery & equipment and to run factories and industries is impossible without the involvement of human resource.
4. Increase in production:
The human resources of a country help to increase within the production of various goods and services. By using skilled human resources, a country can produce the variety of goods and services having high quality.
5. Changes in technology:
Human resources of a country can bring the new technology. Advance technology is necessary to bring development in country.
6. Reform in tradition cultural and attitude:
The traditional culture, values, intestines and attitude are inimical to the development of developing countries including world. The educated manpower reforms the traditional cultural and attitude.
7. Increase in managerial capacity and entrepreneurship
Human resources increase the managerial capacity and entrepreneurship. It leads to innovation. The new production technique, new market and new technology are developed. This increases the production and national income.
8. Development of agriculture and industry:
The modern and superior technologies should be use for the modernization of agriculture and rapid industrializations. This is often made possible only by human resource. Theodore Schultz observes "It is just not possible to have the fruits of a modern agriculture and therefore the abundance of recent industry without making large investment in human being.
9. Remove economic background:
Human resource helps on to remove the economic backwardness. It increases labour efficiently and specialization. It increases labour mobility from which the executing resources are often made more productivity. The development of human resources increases the knowledge of natural resources. New production technique, market and opportunities of economic activities. The human resource also helps within the proper utilization of imported capital. These all lead to the rise in production, employment opportunities and levels of living of people.
Introduction
The Human Development Index (HDI) may be a statistic developed and compiled by the United Nations to measure and various countries' levels of social and economic development. It’s composed of four principal areas of interest: mean years of schooling expected years of schooling, life expectancy at birth, and gross value per capita. This index may be a tool used to follow changes in development levels over time and to compare the event levels of various countries.
Understanding the Human Development Index (HDI)
The Human Development Index (HDI) was established to place emphasis on individuals, more precisely on their opportunities to realize satisfying work and lives. Evaluating a country's potential for individual human development provides a supplementary metric for evaluating a country's level of development besides considering standard economic process statistics, like gross domestic product (GDP).
This index also can be wont to examine the various policy choices of nations; if, for instance, two countries have approximately an equivalent gross national income (GNI) per capita, then it can help to evaluate why they produce widely disparate human development outcomes. Proponents of the HDI hope it are often wont to stimulate such productive public policy debate.
Definition:
The Human Development Index (HDI) may be a statistical tool won’t to measure a country's overall achievement in its social and economic dimensions. The social and economic dimensions of a country are based on the health of people, their level of education attainment and their standard of living.
HOW IS THE HDI MEASURED?
The HDI may be a summary measurement of basic achievement levels in human development. The computed HDI of a country is a mean of indexes of every of the life aspects that are examined: knowledge and understanding, a long and healthy life, and an acceptable standard of living. Each of the four components is normalized to scale between 0 and 1, and then the mean of the three components is calculated.
The health aspect of the HDI is measured by the life expectancy, as calculated at the time of birth, in each country, normalized in order that this component is equal to 0 when life expectancy is 20 and equal to 1 when life expectancy is 85.
Education is measured on two levels: the mean years of schooling for residents of a country and therefore the expected years of schooling that a child has at the average age for starting school. These are each separately normalized in order that 15 mean years of schooling equals one, and 18 years of expected schooling equals one, and an easy mean of the 2 is calculated.
The metric chosen to represent the quality of living is GNI per capita based on purchasing power parity (PPP), a standard metric wont to reflect average income. The quality of living is normalized in order that it's adequate to 1 when GNI per capita is $75,000 and adequate to 0 when GNI per capita is $100. The ultimate Human Development Index score for every country is calculated as a geometric mean of the three components by taking the cube root of the product of the normalized component scores.
Limitations of the index
The HDI may be a simplification and an admittedly limited evaluation of human development. The HDI doesn't specifically reflect quality-of-life factors, like empowerment movements or overall feelings of security. In recognition of those facts, the Human Development Report Office (HDRO) provides additional composite indices to evaluate other life aspects, including inequality issues like gender disparity or racial inequality. Examination and evaluation of a country's HDI are best done in concert with examining these and other factors, like the country's rate of economic growth, expansion of employment opportunities, and therefore the success of initiatives undertaken to enhance the general quality of life within a country.
Several economists have raised the criticism of the HDI that it's essentially redundant as results of the high correlations between the HDI, its components, and simpler measures of income per capita. GNI per capita (or even GDP per capita) correlates very highly with both the overall HDI and therefore the other two components in both values and rankings. Given these strong and consistent correlations, it might be simpler and clearer to only compare per capita GNI across countries than to spend time and resources collecting data for the extra components that provide little or no additional information to the general index.
Indeed, a fundamental principle of the composite index design is to not include multiple additional components that are strongly correlated during a way that means that they could reflect the same underlying phenomenon. This is to prevent inefficient double counting and to avoid introducing additional sources of potential errors within the data.
In the case of HDI, the inclusion of the components is problematic because it's easily plausible that higher average incomes directly cause both more investment in formal education and better health and longevity, and definitions and measurement of years of schooling and life expectancy can vary widely from country to country.
1.3.1 Gender Development Index
The GDI measures gender gaps in human development achievements by accounting for disparities between women and men in three basic dimensions of human development—health, knowledge and living standards using equivalent component indicators as within the HDI. The GDI is that the ratio of the HDIs calculated separately for females and males using the same methodology as within the HDI. It’s a direct measure of gender gap showing the female HDI as a percentage of the male HDI. For more details on computation see Technical Notes.
The GDI is calculated for 166 countries. Countries are grouped into five groups based on the absolute deviation from gender parity in HDI values. This suggests that grouping takes equally into consideration gender gaps favouring males, also as those favouring females.
The GDI shows how much women are lagging behind their male counterparts and the way much women need to catch up within each dimension of human development. It's useful for understanding the real gender gap in human development achievements and is informative to design policy tools to shut the gap.

The Gender Related Development Index (GDI) is an index designed to measure gender equality.
GDI together with the Gender Empowerment Measure (GEM) were introduced in 1995 within the Human Development Report written by the United Nations Development Program. The aim of those measurements was to feature a gender-sensitive dimension to the Human Development Index (HDI). The first measurement that they created as a result was the Gender-related Development Index (GDI). The GDI is defined as a "distribution-sensitive measure that accounts for the human development impact of existing gender gaps within the three components of the HDI" (Kaleen 243). Distribution sensitive means the GDI takes into account not only the averaged or general level of well-being and wealth within a given country, but focuses also on how this wealth and well-being is distributed between different groups within society. The HDI and the GDI (as well because the GEM) were created to rival the more traditional general income-based measures of development like gross domestic product (GDP) and gross national product (GNP).
Definition and Calculation
The GDI is usually considered a "gender-sensitive extension of the HDI" (Kaleen 245). It addresses gender-gaps in life expectancy, education, and incomes. It uses an "inequality aversion" penalty, which creates a development score penalty for gender gaps in any of the categories of the Human Development Index which include life expectancy, adult literacy, school enrolment, and logarithmic transformations of per-capita income. In terms of life expectancy, the GDI assumes that women will live an average of 5 years longer than men. Additionally, in terms of income, the GDI considers income-gaps in terms of actual earned income. The GDI cannot be used independently from the Human Development Index (HDI) score then, it can't be used on its own as an indicator of gender-gaps. Only the gap between the HDI and therefore the GDI can actually be accurately considered; the GDI on its own isn't an independent measure of gender-gaps.
How is GDI constructed?
In HDI, the life expectancy index at birth of a country is calculated. But within the case of GDI, life expectancy at birth for both male and feminine are calculated. After determining life expectancy at birth for male and female, these are combined during a way that ‘penalizes’ differences in achievement between men and women. The index thus obtained is called ‘equally distributed life expectancy index’.
The formula of this index is:
Equally distributed index = {[female population share (female index 1- ɛ)] + [male population share (male index 1- ɛ)]}
ɛ measures the inequality aversion. Within the GDI, ɛ is assumed to be equal to 2. If e = 0 then GDI equals HDI. As e tends to infinity gender inequality widens.
The calculation procedure of GDI involves the subsequent four steps:
(i) Calculating the Equally Distributed Life Index:
Out of 102.9 crore Indian population in 2001 census, male members (53.2 crore) exceeded female members. Life expectancies at birth for Indian women and men were 66.9 years and 63.9 years. Thus,
(ii) Calculating the Equally Distributed Education Index:
First, the adult literacy rates for ladies and men are determined. Secondly, the combined primary, secondary and tertiary gross enrolment ratios for ladies and men are calculated.
Now we'll calculate the education index for both women and men. To do this, two-thirds weight to the adult literacy index and one-third weight to the gross enrolment index are assigned to get both female and male education indices.
Education index = 2/3 (adult literacy index) + 1/3 (gross enrolment index)
Female education index = 2/3 (0.537) + 1/3 (0.753) = 0.551
Male education index = 2/3 (0.753) + 1/3 (0.660) = 0.722
(iii) Calculating the Equally Distributed Income Index:
(iv)Combining the female and male income indices, we calculate equally distributed income index:
CONTROVERSIES OF GDI
- General debates
In the years since its creation in 1995, much debate has arisen surrounding the reliability, and usefulness of the Gender Development Index (GDI) in making adequate comparisons between different countries and in promoting gender-sensitive development. The GDI is especially criticized for being often mistakenly interpreted as an independent measure of gender-gaps when it's not, in fact, intended to be interpreted therein way, because it can only be utilized in combination with the scores from the Human Development Index, but not on its own. Additionally, the info that's needed so as to calculate the GDI isn't always readily available in many countries, making the measure very hard to calculate uniformly and internationally. There's also worry that the combination of so many different developmental influences in one measurement could result in muddled results which perhaps the GDI (and the GEM) actually hide more than they reveal.
- Debates surrounding the life expectancy adjustment
More specifically, there has been tons of debate over the life-expectancy component of the Gender-related Development Index (GDI). As was mentioned previously, the GDI life expectancy section is adjusted to assume that ladies will live, normally, five years longer than men. This provision has been debated, and it's been argued that if the GDI was really looking to promote true equality, it might strive to attain the same life-expectancy for women and men, despite what could be considered a biological advantage or not. However, this might seem paradoxical in terms of policy implications, because, theoretically, this might only be achieved through providing preferential treatment to males, effectively discriminating against females. Furthermore, it's been argued that the GDI doesn't account for sex-selective abortion, meaning that the penalty levied against a country for gender inequality is less because it affects less of the population (see Sen, Missing Women).
- Debates surrounding income gaps
Another area of debate surrounding the Gender-related Development Index (GDI) is within the area of income gaps. The GDI considers income-gaps in terms of actual earned income. This has been said to be problematic because often, men may make more money than women, but their income is shared. Additionally, the GDI has been criticized because it doesn't consider the value of care work also as other work performed within the informal sector (such as cleaning, cooking, housework, and childcare). Another criticism of the GDI is that it only takes gender into account as a factor for inequality, it doesn't, however, consider inequality among class, region or race, which might be very significant. Another criticism with the income-gap portion of the GDI is that it's heavily dependent on gross domestic product (GDP) and gross national product (GNP). For most countries, the earned-income gap accounts for more than 90% of the gender penalty.
1.3.2 Gender Inequality Index
The gender inequality index (GII) provides insights into gender disparities in health, empowerment and the labour market. Unlike the human development index (HDI), however, higher values in the GII indicate worse achievements.
The Gender Inequality Index is a composite measure reflecting inequality in achievements between The GII is a composite measure, reflecting inequality in achievements between women and men in three dimensions: reproductive health, empowerment and the labour market.
- The health dimension is measured by the maternal mortality ratio and the adolescent fertility rate.
- The empowerment dimension is measured by the share of parliamentary seats held by each gender, and by secondary and higher education attainment levels.
- The labour dimension is measured by women's participation in the workforce.
The GII varies between 0 (when women and men fare equally) and 1 (when men or women fare poorly compared to the other in all dimensions). It is designed to reveal the extent to which national human development achievements are eroded by gender inequality, and to provide empirical foundations for policy analysis and advocacy efforts.
This index includes maternal mortality rates (from UNESCO) and women's parliamentary representation. The Gender Inequality Index (GII) attempts to deal with some of these limitations by adding three new dimensions which reflect women's reproductive health status, empowerment and labour market participation in comparison to men. It also excludes income which is seen to be less relevant in developing countries. The desegregation of data ensures that high achievement in one dimension does not compensate for low achievement in another dimension. The GII value increases as gender inequalities increase. One of the major advantages of the index is seen to be the ability for it to capture the linkages across different dimensions for example schooling and access to work. The GII does not however capture other relevant dimensions such as time-use, access to assets, domestic violence, and local-level empowerment.
Gender inequality remains a major barrier to human development. Girls and women have made major strides since 1990, but they have not yet gained gender equity. The disadvantages facing women and girls are a major source of inequality. All too often, women and girls are discriminated against in health, education, political representation, labour market, etc.—with negative consequences for development of their capabilities and their freedom of choice.
The GII is an inequality index. It measures gender inequalities in three important aspects of human development—reproductive health, measured by maternal mortality ratio and adolescent birth rates; empowerment, measured by proportion of parliamentary seats occupied by females and proportion of adult females and males aged 25 years and older with at least some secondary education; and economic status, expressed as labour market participation and measured by labour force participation rate of female and male populations aged 15 years and older. The GII is built on the same framework as the IHDI—to better expose differences in the distribution of achievements between women and men. It measures the human development costs of gender inequality. Thus, the higher the GII value the more disparities between females and males and the more loss to human development.
The GII sheds new light on the position of women in 162 countries; it yields insights in gender gaps in major areas of human development. The component indicators highlight areas in need of critical policy intervention and it stimulates proactive thinking and public policy to overcome systematic disadvantages of women.

1.3.3 Human Poverty Index
The Human Poverty Index (HPI) was first introduced into the Human Development Report by the United Nations Development Programme (UNDP) in 1997 in an effort to bring together during a composite index the various features of deprivation within the quality of life to reach an aggregate judgment on the extent of poverty during a community.
That is, if human development is seen as enlarging choices and expanding freedoms to enjoy a decent standard of living, freedom, dignity, self-respect and therefore the respect of others, then measures of poverty should check out the deprivation of those freedoms.
Therefore the HPI looks at deprivations within the three basic dimensions captured within the Human Development Index: a long and healthy life, as measured by the probability of not surviving past the age of 40; knowledge, or exclusion from it, as measured by the adult literacy rate; and an honest standard of living, or lack of essential services, as measured by the percentage of the population not using an improved water source and therefore the percentage of children underweight for his or her age.
There are tree indicators of the human poverty index (HPI):
• Survival: the likeliness of death at a relatively early age and is represented by the probability of not surviving to ages 40 and 60 respectively for the HPI-1 and HPI-2.
• Knowledge: being excluded from the world of reading and communication and is measured by the percentage of adults who are illiterate.
• Decent standard of living: in particular, overall economic provisioning.
HOW TO CALCULATE HPI
For developing countries:
The formula for calculating it is:
P1: probability at birth of not surviving to age 40 (times 100)
P2: adult illiteracy rate
P3: arithmetic average of 3 characteristics:
- The percentage of the population without access to safe water
- The percentage of population without access to health services
- The percentage of malnourished children under five
a:3
FOR SELECTED HIGH-INCOME OECD COUNTRIES (HPI-2)
The Human Development Reports website summarizes this as "A composite index measuring deprivations in the four basic dimensions captured in the human development index — a long and healthy life, knowledge and a decent standard of living — and also capturing social exclusion." The formula for calculating it is:
P1: probability at birth of not surviving to age 60 (times 100)
P2: adults lacking functional literacy skills
P3: population below income poverty line (50% of median adjusting household disposable income)
P4: rate of long-term unemployment (lasting 12 months or more)
a:3
1.3.4 Global Hunger Index
India ranked 101 out of 116 in the Global Hunger Index (GHI) for 2021 from 94 in the previous year, trailing behind Pakistan, Bangladesh and Nepal. The Global Hunger Index report termed the level of hunger in India as “serious”, which is better than its performance in 2000, when the levels of hunger were ‘alarming’.
Only 15 countries have fared worse than India. These include Papua New Guinea (102), Afghanistan (103), Nigeria (103), Congo (105), Mozambique (106), Sierra Leone (106), Timor-Leste (108), Haiti (109), Liberia (110), Madagascar (111), Democratic Republic of Congo (112), Chad (113), Central African Republic (114), Yemen (115) and Somalia (116). Eighteen countries, including China, Brazil and Kuwait, shared the top rank with a GHI score of less than five.
What is the Global Hunger Index and who releases this data?
The Global Hunger Index is published annually by Concern Worldwide, Ireland’s largest aid and humanitarian agency and Welthungerhilfe, one of the largest private aid organisations in Germany. The two are “dedicated to tackling poverty and suffering in the world’s poorest countries. The first GHI report was published in 2006 and the index is intended to be “a tool designed to comprehensively measure and track hunger at global, regional, and national levels".
The GHI assesses a country’s performance on four component indicators:
Undernourishment: the share of the population that is undernourished (that is, whose caloric intake is insufficient);
Child wasting: the share of children under the age of five who are wasted (that is, who have low weight for their height, reflecting acute undernutrition);
Child stunting: the share of children under the age of five who are stunted (that is, who have low height for their age, reflecting chronic undernutrition); and
Child mortality: the mortality rate of children under the age of five (in part, a reflection of the fatal mix of inadequate nutrition and unhealthy environments).
The GHI determines hunger on a 100-point scale, where 0 is the best possible score (no hunger) and 100 is the worst. Each country’s GHI score is classified by severity, from low to extremely alarming.
How did India score?
In the 2021 Global Hunger Index, India ranked 101 out of the 116 countries with a score of 27.5, India has a level of hunger that is 'serious'. According to the report, 15.3 per cent of the country's population is undernourished, while 17.3% of children under the age of five are wasted, and 34.7 per cent of children under the age of 5 are stunted. 3.4 per cent of children die before their fifth birthday. India has the highest child wasting rate of all countries covered in the index.
"Since 2000, India has made substantial progress, but there are still areas of concern, particularly regarding child nutrition. India’s GHI score has decreased from a 2000 GHI score of 38.8 points considered alarming to a 2021 GHI score of 27.5 considered serious. The proportion of undernourished in the population and the under-five child mortality rate are now at relatively low levels. While child stunting has seen a significant decrease from 54.2 percent in 1998–1999 to 34.7 percent in 2016–2018 it is still considered very high. At 17.3 percent according to the latest data India has the highest child wasting rate of all countries covered in the GHI. This rate is slightly higher than it was in 1998–1999, when it was 17.1 percent," said the report.
Why is the government so upset with this ranking?
Upset over the low rankings, the government alleged the publishing agencies didn't do their due diligence before releasing the report. The government has questioned the undernourishment data provided by the Food and Agriculture Organisation, which it says is based on a ‘four question’ telephone poll. Point to note: This is also the only indicator in the report that has shown a deterioration in India, the other three have either improved or remained unchanged. According to FAO’s data, which is used in the Index, the prevalence of undernourishment in India rose from 14% in 2017-2019 to 15.3% in 2018-2020. The government has alleged that a “selective approach" has been "adopted by the publishing agencies to deliberately lower India’s rank on the GHI 2021”.
Secondly, the government has said the index disregarded the effort made to feed people during the pandemic. This is because the poll failed to ask if the respondent received food support from the government.
Thirdly, the government argued that the index should have relied on height and weight to assess undernourishment.
Fourth, the Ministry of Women and Child Development also said that it is not possible to evaluate the extent of malnutrition for the period before 2018 as there were no growth monitoring devices available at angan wadis until they were introduced under the Poshan Abhiyaan. In fact, real-time data from the government’s POSHAN portal shows that only 3.9% of the children served by government programs are undernourished.
“The real time data of beneficiaries registered on the Anganwadi platform include 7.79 crore children aged between 6 months to 6 years as per real-time Poshan Tracker data [as on 16-10-2021]. Corresponding number of undernourished children reported on Poshan Tracker is 30.27 lakh which comes to only 3.9%,” the Ministry pf Women and child development was quoted as saying by newspaper.
References:
- Bhole, L.M., impacts of Monetary Policy, Himalaya Publishing House, New Delhi.
- Kayndepatil, G.V, Agricultural Economies: Theory & Policy, Chaitanya Publi. Nasi
- Ann Larkin Hansen, The Organic Farming Manual, Storey Publishing, North Adams.
Unit 1
Human Resources and Economic Development
In ordinary sense, human resource refers the population of the country but in economics, the healthy, educated, and skilled manpower is known as human resource. So, human resource is that the process of improving quality and efficiency of the people.
According to the National planning commission, “Human resource is that the knowledge, skill, efficiency and physical and brain to do work inherent within the people of the country”.
Role of Human Resources in Economic Development
Human resources play the important role in overall development of a country. Capital, natural resources, also as other productive resources remain inactive within the nature. Human resources are necessary to mobilize them. Nepal has sufficient natural resources and utilization of those resources in necessary for economic development. The role of human resource is often explained with the help of following points.
1. Utilization of Natural resources:
Human resources are necessary for the utilization of natural resources like mineral, water, forest etc. Utilization of these resources is necessary for economic development. Thus, only human resources mobilize and utilize them properly.
2. Compensate the deficiency of natural resources:
The utilization of human resource compensates the deficiency of natural resources. Many countries are poor in natural resources like Japan, Hong Kong, Singapore etc. but they're able to achieve high economic growth by properly utilizing human resource.
3. Utilization of physical capital:
Only the existence of physical capital can’t do anything for economic development. They should be properly utilized. To, operate machinery & equipment and to run factories and industries is impossible without the involvement of human resource.
4. Increase in production:
The human resources of a country help to increase within the production of various goods and services. By using skilled human resources, a country can produce the variety of goods and services having high quality.
5. Changes in technology:
Human resources of a country can bring the new technology. Advance technology is necessary to bring development in country.
6. Reform in tradition cultural and attitude:
The traditional culture, values, intestines and attitude are inimical to the development of developing countries including world. The educated manpower reforms the traditional cultural and attitude.
7. Increase in managerial capacity and entrepreneurship
Human resources increase the managerial capacity and entrepreneurship. It leads to innovation. The new production technique, new market and new technology are developed. This increases the production and national income.
8. Development of agriculture and industry:
The modern and superior technologies should be use for the modernization of agriculture and rapid industrializations. This is often made possible only by human resource. Theodore Schultz observes "It is just not possible to have the fruits of a modern agriculture and therefore the abundance of recent industry without making large investment in human being.
9. Remove economic background:
Human resource helps on to remove the economic backwardness. It increases labour efficiently and specialization. It increases labour mobility from which the executing resources are often made more productivity. The development of human resources increases the knowledge of natural resources. New production technique, market and opportunities of economic activities. The human resource also helps within the proper utilization of imported capital. These all lead to the rise in production, employment opportunities and levels of living of people.
Introduction
The Human Development Index (HDI) may be a statistic developed and compiled by the United Nations to measure and various countries' levels of social and economic development. It’s composed of four principal areas of interest: mean years of schooling expected years of schooling, life expectancy at birth, and gross value per capita. This index may be a tool used to follow changes in development levels over time and to compare the event levels of various countries.
Understanding the Human Development Index (HDI)
The Human Development Index (HDI) was established to place emphasis on individuals, more precisely on their opportunities to realize satisfying work and lives. Evaluating a country's potential for individual human development provides a supplementary metric for evaluating a country's level of development besides considering standard economic process statistics, like gross domestic product (GDP).
This index also can be wont to examine the various policy choices of nations; if, for instance, two countries have approximately an equivalent gross national income (GNI) per capita, then it can help to evaluate why they produce widely disparate human development outcomes. Proponents of the HDI hope it are often wont to stimulate such productive public policy debate.
Definition:
The Human Development Index (HDI) may be a statistical tool won’t to measure a country's overall achievement in its social and economic dimensions. The social and economic dimensions of a country are based on the health of people, their level of education attainment and their standard of living.
HOW IS THE HDI MEASURED?
The HDI may be a summary measurement of basic achievement levels in human development. The computed HDI of a country is a mean of indexes of every of the life aspects that are examined: knowledge and understanding, a long and healthy life, and an acceptable standard of living. Each of the four components is normalized to scale between 0 and 1, and then the mean of the three components is calculated.
The health aspect of the HDI is measured by the life expectancy, as calculated at the time of birth, in each country, normalized in order that this component is equal to 0 when life expectancy is 20 and equal to 1 when life expectancy is 85.
Education is measured on two levels: the mean years of schooling for residents of a country and therefore the expected years of schooling that a child has at the average age for starting school. These are each separately normalized in order that 15 mean years of schooling equals one, and 18 years of expected schooling equals one, and an easy mean of the 2 is calculated.
The metric chosen to represent the quality of living is GNI per capita based on purchasing power parity (PPP), a standard metric wont to reflect average income. The quality of living is normalized in order that it's adequate to 1 when GNI per capita is $75,000 and adequate to 0 when GNI per capita is $100. The ultimate Human Development Index score for every country is calculated as a geometric mean of the three components by taking the cube root of the product of the normalized component scores.
Limitations of the index
The HDI may be a simplification and an admittedly limited evaluation of human development. The HDI doesn't specifically reflect quality-of-life factors, like empowerment movements or overall feelings of security. In recognition of those facts, the Human Development Report Office (HDRO) provides additional composite indices to evaluate other life aspects, including inequality issues like gender disparity or racial inequality. Examination and evaluation of a country's HDI are best done in concert with examining these and other factors, like the country's rate of economic growth, expansion of employment opportunities, and therefore the success of initiatives undertaken to enhance the general quality of life within a country.
Several economists have raised the criticism of the HDI that it's essentially redundant as results of the high correlations between the HDI, its components, and simpler measures of income per capita. GNI per capita (or even GDP per capita) correlates very highly with both the overall HDI and therefore the other two components in both values and rankings. Given these strong and consistent correlations, it might be simpler and clearer to only compare per capita GNI across countries than to spend time and resources collecting data for the extra components that provide little or no additional information to the general index.
Indeed, a fundamental principle of the composite index design is to not include multiple additional components that are strongly correlated during a way that means that they could reflect the same underlying phenomenon. This is to prevent inefficient double counting and to avoid introducing additional sources of potential errors within the data.
In the case of HDI, the inclusion of the components is problematic because it's easily plausible that higher average incomes directly cause both more investment in formal education and better health and longevity, and definitions and measurement of years of schooling and life expectancy can vary widely from country to country.
1.3.1 Gender Development Index
The GDI measures gender gaps in human development achievements by accounting for disparities between women and men in three basic dimensions of human development—health, knowledge and living standards using equivalent component indicators as within the HDI. The GDI is that the ratio of the HDIs calculated separately for females and males using the same methodology as within the HDI. It’s a direct measure of gender gap showing the female HDI as a percentage of the male HDI. For more details on computation see Technical Notes.
The GDI is calculated for 166 countries. Countries are grouped into five groups based on the absolute deviation from gender parity in HDI values. This suggests that grouping takes equally into consideration gender gaps favouring males, also as those favouring females.
The GDI shows how much women are lagging behind their male counterparts and the way much women need to catch up within each dimension of human development. It's useful for understanding the real gender gap in human development achievements and is informative to design policy tools to shut the gap.

The Gender Related Development Index (GDI) is an index designed to measure gender equality.
GDI together with the Gender Empowerment Measure (GEM) were introduced in 1995 within the Human Development Report written by the United Nations Development Program. The aim of those measurements was to feature a gender-sensitive dimension to the Human Development Index (HDI). The first measurement that they created as a result was the Gender-related Development Index (GDI). The GDI is defined as a "distribution-sensitive measure that accounts for the human development impact of existing gender gaps within the three components of the HDI" (Kaleen 243). Distribution sensitive means the GDI takes into account not only the averaged or general level of well-being and wealth within a given country, but focuses also on how this wealth and well-being is distributed between different groups within society. The HDI and the GDI (as well because the GEM) were created to rival the more traditional general income-based measures of development like gross domestic product (GDP) and gross national product (GNP).
Definition and Calculation
The GDI is usually considered a "gender-sensitive extension of the HDI" (Kaleen 245). It addresses gender-gaps in life expectancy, education, and incomes. It uses an "inequality aversion" penalty, which creates a development score penalty for gender gaps in any of the categories of the Human Development Index which include life expectancy, adult literacy, school enrolment, and logarithmic transformations of per-capita income. In terms of life expectancy, the GDI assumes that women will live an average of 5 years longer than men. Additionally, in terms of income, the GDI considers income-gaps in terms of actual earned income. The GDI cannot be used independently from the Human Development Index (HDI) score then, it can't be used on its own as an indicator of gender-gaps. Only the gap between the HDI and therefore the GDI can actually be accurately considered; the GDI on its own isn't an independent measure of gender-gaps.
How is GDI constructed?
In HDI, the life expectancy index at birth of a country is calculated. But within the case of GDI, life expectancy at birth for both male and feminine are calculated. After determining life expectancy at birth for male and female, these are combined during a way that ‘penalizes’ differences in achievement between men and women. The index thus obtained is called ‘equally distributed life expectancy index’.
The formula of this index is:
Equally distributed index = {[female population share (female index 1- ɛ)] + [male population share (male index 1- ɛ)]}
ɛ measures the inequality aversion. Within the GDI, ɛ is assumed to be equal to 2. If e = 0 then GDI equals HDI. As e tends to infinity gender inequality widens.
The calculation procedure of GDI involves the subsequent four steps:
(i) Calculating the Equally Distributed Life Index:
Out of 102.9 crore Indian population in 2001 census, male members (53.2 crore) exceeded female members. Life expectancies at birth for Indian women and men were 66.9 years and 63.9 years. Thus,
(ii) Calculating the Equally Distributed Education Index:
First, the adult literacy rates for ladies and men are determined. Secondly, the combined primary, secondary and tertiary gross enrolment ratios for ladies and men are calculated.
Now we'll calculate the education index for both women and men. To do this, two-thirds weight to the adult literacy index and one-third weight to the gross enrolment index are assigned to get both female and male education indices.
Education index = 2/3 (adult literacy index) + 1/3 (gross enrolment index)
Female education index = 2/3 (0.537) + 1/3 (0.753) = 0.551
Male education index = 2/3 (0.753) + 1/3 (0.660) = 0.722
(iii) Calculating the Equally Distributed Income Index:
(iv)Combining the female and male income indices, we calculate equally distributed income index:
CONTROVERSIES OF GDI
- General debates
In the years since its creation in 1995, much debate has arisen surrounding the reliability, and usefulness of the Gender Development Index (GDI) in making adequate comparisons between different countries and in promoting gender-sensitive development. The GDI is especially criticized for being often mistakenly interpreted as an independent measure of gender-gaps when it's not, in fact, intended to be interpreted therein way, because it can only be utilized in combination with the scores from the Human Development Index, but not on its own. Additionally, the info that's needed so as to calculate the GDI isn't always readily available in many countries, making the measure very hard to calculate uniformly and internationally. There's also worry that the combination of so many different developmental influences in one measurement could result in muddled results which perhaps the GDI (and the GEM) actually hide more than they reveal.
- Debates surrounding the life expectancy adjustment
More specifically, there has been tons of debate over the life-expectancy component of the Gender-related Development Index (GDI). As was mentioned previously, the GDI life expectancy section is adjusted to assume that ladies will live, normally, five years longer than men. This provision has been debated, and it's been argued that if the GDI was really looking to promote true equality, it might strive to attain the same life-expectancy for women and men, despite what could be considered a biological advantage or not. However, this might seem paradoxical in terms of policy implications, because, theoretically, this might only be achieved through providing preferential treatment to males, effectively discriminating against females. Furthermore, it's been argued that the GDI doesn't account for sex-selective abortion, meaning that the penalty levied against a country for gender inequality is less because it affects less of the population (see Sen, Missing Women).
- Debates surrounding income gaps
Another area of debate surrounding the Gender-related Development Index (GDI) is within the area of income gaps. The GDI considers income-gaps in terms of actual earned income. This has been said to be problematic because often, men may make more money than women, but their income is shared. Additionally, the GDI has been criticized because it doesn't consider the value of care work also as other work performed within the informal sector (such as cleaning, cooking, housework, and childcare). Another criticism of the GDI is that it only takes gender into account as a factor for inequality, it doesn't, however, consider inequality among class, region or race, which might be very significant. Another criticism with the income-gap portion of the GDI is that it's heavily dependent on gross domestic product (GDP) and gross national product (GNP). For most countries, the earned-income gap accounts for more than 90% of the gender penalty.
1.3.2 Gender Inequality Index
The gender inequality index (GII) provides insights into gender disparities in health, empowerment and the labour market. Unlike the human development index (HDI), however, higher values in the GII indicate worse achievements.
The Gender Inequality Index is a composite measure reflecting inequality in achievements between The GII is a composite measure, reflecting inequality in achievements between women and men in three dimensions: reproductive health, empowerment and the labour market.
- The health dimension is measured by the maternal mortality ratio and the adolescent fertility rate.
- The empowerment dimension is measured by the share of parliamentary seats held by each gender, and by secondary and higher education attainment levels.
- The labour dimension is measured by women's participation in the workforce.
The GII varies between 0 (when women and men fare equally) and 1 (when men or women fare poorly compared to the other in all dimensions). It is designed to reveal the extent to which national human development achievements are eroded by gender inequality, and to provide empirical foundations for policy analysis and advocacy efforts.
This index includes maternal mortality rates (from UNESCO) and women's parliamentary representation. The Gender Inequality Index (GII) attempts to deal with some of these limitations by adding three new dimensions which reflect women's reproductive health status, empowerment and labour market participation in comparison to men. It also excludes income which is seen to be less relevant in developing countries. The desegregation of data ensures that high achievement in one dimension does not compensate for low achievement in another dimension. The GII value increases as gender inequalities increase. One of the major advantages of the index is seen to be the ability for it to capture the linkages across different dimensions for example schooling and access to work. The GII does not however capture other relevant dimensions such as time-use, access to assets, domestic violence, and local-level empowerment.
Gender inequality remains a major barrier to human development. Girls and women have made major strides since 1990, but they have not yet gained gender equity. The disadvantages facing women and girls are a major source of inequality. All too often, women and girls are discriminated against in health, education, political representation, labour market, etc.—with negative consequences for development of their capabilities and their freedom of choice.
The GII is an inequality index. It measures gender inequalities in three important aspects of human development—reproductive health, measured by maternal mortality ratio and adolescent birth rates; empowerment, measured by proportion of parliamentary seats occupied by females and proportion of adult females and males aged 25 years and older with at least some secondary education; and economic status, expressed as labour market participation and measured by labour force participation rate of female and male populations aged 15 years and older. The GII is built on the same framework as the IHDI—to better expose differences in the distribution of achievements between women and men. It measures the human development costs of gender inequality. Thus, the higher the GII value the more disparities between females and males and the more loss to human development.
The GII sheds new light on the position of women in 162 countries; it yields insights in gender gaps in major areas of human development. The component indicators highlight areas in need of critical policy intervention and it stimulates proactive thinking and public policy to overcome systematic disadvantages of women.
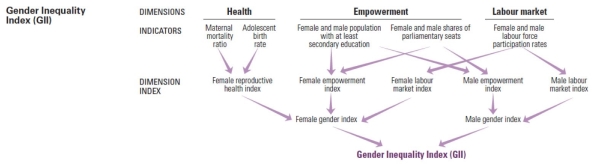
1.3.3 Human Poverty Index
The Human Poverty Index (HPI) was first introduced into the Human Development Report by the United Nations Development Programme (UNDP) in 1997 in an effort to bring together during a composite index the various features of deprivation within the quality of life to reach an aggregate judgment on the extent of poverty during a community.
That is, if human development is seen as enlarging choices and expanding freedoms to enjoy a decent standard of living, freedom, dignity, self-respect and therefore the respect of others, then measures of poverty should check out the deprivation of those freedoms.
Therefore the HPI looks at deprivations within the three basic dimensions captured within the Human Development Index: a long and healthy life, as measured by the probability of not surviving past the age of 40; knowledge, or exclusion from it, as measured by the adult literacy rate; and an honest standard of living, or lack of essential services, as measured by the percentage of the population not using an improved water source and therefore the percentage of children underweight for his or her age.
There are tree indicators of the human poverty index (HPI):
• Survival: the likeliness of death at a relatively early age and is represented by the probability of not surviving to ages 40 and 60 respectively for the HPI-1 and HPI-2.
• Knowledge: being excluded from the world of reading and communication and is measured by the percentage of adults who are illiterate.
• Decent standard of living: in particular, overall economic provisioning.
HOW TO CALCULATE HPI
For developing countries:
The formula for calculating it is:

P1: probability at birth of not surviving to age 40 (times 100)
P2: adult illiteracy rate
P3: arithmetic average of 3 characteristics:
- The percentage of the population without access to safe water
- The percentage of population without access to health services
- The percentage of malnourished children under five
a:3
FOR SELECTED HIGH-INCOME OECD COUNTRIES (HPI-2)
The Human Development Reports website summarizes this as "A composite index measuring deprivations in the four basic dimensions captured in the human development index — a long and healthy life, knowledge and a decent standard of living — and also capturing social exclusion." The formula for calculating it is:

P1: probability at birth of not surviving to age 60 (times 100)
P2: adults lacking functional literacy skills
P3: population below income poverty line (50% of median adjusting household disposable income)
P4: rate of long-term unemployment (lasting 12 months or more)
a:3
1.3.4 Global Hunger Index
India ranked 101 out of 116 in the Global Hunger Index (GHI) for 2021 from 94 in the previous year, trailing behind Pakistan, Bangladesh and Nepal. The Global Hunger Index report termed the level of hunger in India as “serious”, which is better than its performance in 2000, when the levels of hunger were ‘alarming’.
Only 15 countries have fared worse than India. These include Papua New Guinea (102), Afghanistan (103), Nigeria (103), Congo (105), Mozambique (106), Sierra Leone (106), Timor-Leste (108), Haiti (109), Liberia (110), Madagascar (111), Democratic Republic of Congo (112), Chad (113), Central African Republic (114), Yemen (115) and Somalia (116). Eighteen countries, including China, Brazil and Kuwait, shared the top rank with a GHI score of less than five.
What is the Global Hunger Index and who releases this data?
The Global Hunger Index is published annually by Concern Worldwide, Ireland’s largest aid and humanitarian agency and Welthungerhilfe, one of the largest private aid organisations in Germany. The two are “dedicated to tackling poverty and suffering in the world’s poorest countries. The first GHI report was published in 2006 and the index is intended to be “a tool designed to comprehensively measure and track hunger at global, regional, and national levels".
The GHI assesses a country’s performance on four component indicators:
Undernourishment: the share of the population that is undernourished (that is, whose caloric intake is insufficient);
Child wasting: the share of children under the age of five who are wasted (that is, who have low weight for their height, reflecting acute undernutrition);
Child stunting: the share of children under the age of five who are stunted (that is, who have low height for their age, reflecting chronic undernutrition); and
Child mortality: the mortality rate of children under the age of five (in part, a reflection of the fatal mix of inadequate nutrition and unhealthy environments).
The GHI determines hunger on a 100-point scale, where 0 is the best possible score (no hunger) and 100 is the worst. Each country’s GHI score is classified by severity, from low to extremely alarming.
How did India score?
In the 2021 Global Hunger Index, India ranked 101 out of the 116 countries with a score of 27.5, India has a level of hunger that is 'serious'. According to the report, 15.3 per cent of the country's population is undernourished, while 17.3% of children under the age of five are wasted, and 34.7 per cent of children under the age of 5 are stunted. 3.4 per cent of children die before their fifth birthday. India has the highest child wasting rate of all countries covered in the index.
"Since 2000, India has made substantial progress, but there are still areas of concern, particularly regarding child nutrition. India’s GHI score has decreased from a 2000 GHI score of 38.8 points considered alarming to a 2021 GHI score of 27.5 considered serious. The proportion of undernourished in the population and the under-five child mortality rate are now at relatively low levels. While child stunting has seen a significant decrease from 54.2 percent in 1998–1999 to 34.7 percent in 2016–2018 it is still considered very high. At 17.3 percent according to the latest data India has the highest child wasting rate of all countries covered in the GHI. This rate is slightly higher than it was in 1998–1999, when it was 17.1 percent," said the report.
Why is the government so upset with this ranking?
Upset over the low rankings, the government alleged the publishing agencies didn't do their due diligence before releasing the report. The government has questioned the undernourishment data provided by the Food and Agriculture Organisation, which it says is based on a ‘four question’ telephone poll. Point to note: This is also the only indicator in the report that has shown a deterioration in India, the other three have either improved or remained unchanged. According to FAO’s data, which is used in the Index, the prevalence of undernourishment in India rose from 14% in 2017-2019 to 15.3% in 2018-2020. The government has alleged that a “selective approach" has been "adopted by the publishing agencies to deliberately lower India’s rank on the GHI 2021”.
Secondly, the government has said the index disregarded the effort made to feed people during the pandemic. This is because the poll failed to ask if the respondent received food support from the government.
Thirdly, the government argued that the index should have relied on height and weight to assess undernourishment.
Fourth, the Ministry of Women and Child Development also said that it is not possible to evaluate the extent of malnutrition for the period before 2018 as there were no growth monitoring devices available at angan wadis until they were introduced under the Poshan Abhiyaan. In fact, real-time data from the government’s POSHAN portal shows that only 3.9% of the children served by government programs are undernourished.
“The real time data of beneficiaries registered on the Anganwadi platform include 7.79 crore children aged between 6 months to 6 years as per real-time Poshan Tracker data [as on 16-10-2021]. Corresponding number of undernourished children reported on Poshan Tracker is 30.27 lakh which comes to only 3.9%,” the Ministry pf Women and child development was quoted as saying by newspaper.
References:
- Bhole, L.M., impacts of Monetary Policy, Himalaya Publishing House, New Delhi.
- Kayndepatil, G.V, Agricultural Economies: Theory & Policy, Chaitanya Publi. Nasi
- Ann Larkin Hansen, The Organic Farming Manual, Storey Publishing, North Adams.


