UNIT 4
Index numbers
The value of money does not remain same over the time. A rise in the price levels means a fall in the value of money and a fall in the price level means a rise in the value of money. Thus index number is a statistical device that measures the relative change in the level of price from one time period to another.
Definition
“Index numbers are quantitative measures of growth of prices, production, inventory and other quantities of economic interest” ………Ronald
An index number measures how much a variable changes over the time. Index number is calculated by finding the ratio of current value to a base value.
Features of index number
Price index number
Price index, measure of relative price changes, consisting of a series of numbers arranged so that a comparison between the values for any two periods or places will show the average change in prices between periods or the average difference in prices between places. Price indexes were first developed to measure changes in the cost of living in order to determine the wage increases necessary to maintain a constant standard of living. They continue to be used extensively to estimate changes in prices over time and are also used to measure differences in costs among different areas or countries
Price relatives
One of the simplest examples of an index number is a price relative, which is the ratio of the price of a single commodity in a given period to its price in another period called the base period or reference period. Here we assume prices to be constant for any one period. If they are not, an appropriate average for the same can be taken to make this assumption valid.
If po and pi denote the commodity prices during the base period and given period respectively, then by definition
Poi = Price relative = pi/po
and is generally expressed as a percentage by multiplying by 100. i.e. price relative = pi/po x 100 More generally if piand pjj are prices of a commodity during periods i and j respectively, the price relative in period j with respect to period i is defined as pj/pi and is denoted by pij..
Properties of price relatives
If pi pj pk,… denote prices in periods i, j, k respectively, the following properties exist for the associated price relatives.
1) Identity Property Pii = 1
It is also evident as Pii = pi/pi = 1 or 100%
This states that the price relative for a given period with respect to the same period is 1 or 100%.
2) Time Reversal Property Pij . Pji = 1 or Pij = 1/Pji
As Pij . Pji = (pi/pj) . (pj/pi) = 1
This states that if two periods are interchanged, the corresponding price relatives are reciprocals of each other. So price relatives follow time reversal property.
3) Cyclical or Circular Property According to this Pij. Pjk. Pki = 1
As Pij. Pjk. Pki = Pi/Pj. Pj/Pk. Pk/Pi = 1
Modified Cyclical or Circular Property Pij. Pjk = Pik
Key takeaways –
The construction of the price index involves the following problems
- Fixed base method in which the base year remains fixed
- Chain base method in which base year goes on changing. Ex -2000 base year for 2001, 2001 base year for 2002, and so on
2. Selection of commodities – selection of commodities is one of the problems in constructing index number. As all commodities are not included, only representative commodities are selected keeping in mind the purpose and type of index number.
The following points are considered while selecting commodities
3. Collection of prices – the next problem is the collection of prices. Problems are from where the prices to be collected, which price to select wholesale or retail, whether to include taxes in the price. the following points should be considered while collecting prices
4. Selection of averages – Fourth problem is to choose a suitable average. Theoretically, geometric mean is the best for this purpose. But, in practice, arithmetic mean is used because it is easier to follow.
5. Selection of weights – commodities included in the calculation of index numbers are not of equal importance. Therefore proper weight should be assigned to the commodities for accurate index numbers. Weight should be unbiased and be rationale. For ex – price of books should be given more weightage while preparing index numbers for teachers rather than for workers.
6. Purpose of index numbers – the important point in the construction of index numbers is the objective of index numbers. Before preparing index numbers, it is important to be clear about the purpose of the index numbers. Different index numbers are prepared with a specific purpose.
Key takeaways –
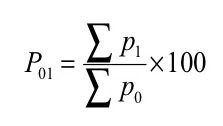
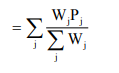
Where, P01 = Index number
P 1= Total of the current year’s prices of all commodities
P 0= Total of the base year’s prices of all commodities
Examples 1–
Commodity | Price in base year 2005 | Price in current year 2010 |
A | 10 | 20 |
B | 15 | 25 |
C | 40 | 60 |
D | 25 | 40 |
Solution
Commodity | Price in base year 2005 | Price in current year 2010 |
A | 10 | 20 |
B | 15 | 25 |
C | 40 | 60 |
D | 25 | 40 |
|
|
|


Index number ( P01 ) = 
P01 = (145/90)*100 = 161.11
It means the price in 2010 were 61% more than the price in 2005
Example 2
Find the index number from the data given below
Commodities | Units | Price in 2007 | Price in 2008 |
Sugar | Quintal | 2200 | 3200 |
Milk | Quintal | 18 | 20 |
Oil | Liter | 68 | 71 |
Wheat | Quintal | 900 | 1000 |
Clothing | Meter | 50 | 60 |
|
|
|
|
Solution
Commodities | Units | Price in 2007 | Price in 2008 |
Sugar | Quintal | 2200 | 3200 |
Milk | Quintal | 18 | 20 |
Oil | Liter | 68 | 71 |
Wheat | Quintal | 900 | 1000 |
Clothing | Meter | 50 | 60 |
|
|
|
|


Index number ( P01 ) = 
P01 = (4351/3236)*100 = 134.45
It means the price in 2008 were 34% more than the price in 2007
Example 3 –
Construct the price index for 2003, taking the year 2000 as base year
Commodities | Price in 2000 | Price in 2003 |
A | 60 | 80 |
B | 50 | 60 |
C | 70 | 100 |
D | 120 | 160 |
E | 100 | 150 |
|
|
|
Solution
Commodities | Price in 2000 - P 0 | Price in 2003 - P 1 |
A | 60 | 80 |
B | 50 | 60 |
C | 70 | 100 |
D | 120 | 160 |
E | 100 | 150 |
|
|
|


Index number ( P01 ) = 
P01 = (550/400)*100 = 137.5
Therefore there is an increase of 37.5% in the prices in 2003 as against 2000.
Example 4-
Compute the price index for the years 2001, 2002, 2003, 2004 taking 2000 as base year
Year | 2000 | 2001 | 2002 | 2003 | 2004 |
Price | 120 | 144 | 168 | 204 | 216 |
Solution
Price index for different years
2000 | (120/120)*100 = 100 |
2001 | (144/120)*100 = 120 |
2002 | (168/120)*100 = 140 |
2003 | (204/120)*100 = 170 |
2004 | (216/120)*100 = 180 |
Example 5 –
Prepare simple aggregative price index
Commodities | Price in 1995 - P 0 | Price in 2003 - P 1 |
Wheat | 100 | 140 |
Rice | 200 | 250 |
Pulses | 250 | 350 |
Sugar | 14 | 20 |
Oil | 40 | 50 |
Solution
Commodities | Price in 1995 - P 0 | Price in 2003 - P 1 |
Wheat | 100 | 140 |
Rice | 200 | 250 |
Pulses | 250 | 350 |
Sugar | 14 | 20 |
Oil | 40 | 50 |
|
|
|


Simple aggregative index number = (810/604)*100 = 134.1
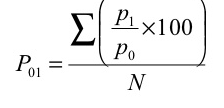
2. Simple average of relative method - in this method, index number is equal to the sum of price relatives divided by the number of items.

Where, N= number of items
Example 1 –
Commodity | Base year | Current year |
A | 10 | 20 |
B | 15 | 25 |
C | 40 | 60 |
D | 25 | 40 |
|
|
|
Solution
Commodity | Base year | Current year | Price relatives |
A | 10 | 20 | (20/10)*100 = 200 |
B | 15 | 25 | (25/15)*100 =166.7 |
C | 40 | 60 | (60/40)*100 =150 |
D | 25 | 40 | (40/25)*100 =160 |
N = 4 |
|
|
|


Index number = 676.7/4 = 169.2
Example 2 –
Construct the index number for the year 2010
Commodities | Price (2009) | Price(2010) |
P | 6 | 10 |
Q | 12 | 2 |
R | 4 | 6 |
S | 10 | 12 |
T | 8 | 12 |
|
|
|
Solution
Commodities | Price (2009) | Price(2010) | Price relative |
P | 6 | 10 | 166.67 |
Q | 12 | 2 | 16.67 |
R | 4 | 6 | 150 |
S | 10 | 12 | 120 |
T | 8 | 12 | 150 |
N = 5 |
|
| 603.34 |
Index number = 603.34/4 = 120.68
Example 3 –
Using simple average of price relative method find price index for 2001, taking 1996 as base year for the following data
Commodity | Wheat | Rice | Sugar | Ghee | Tea |
Price in 1996 | 12 | 20 | 12 | 40 | 80 |
Price in 2001 | 16 | 25 | 16 | 60 | 96 |
Solution
Commodities | Price (2009) | Price(2010) | Price relative |
Wheat | 12 | 16 | (16/12)*100 = 133.33 |
Rice | 20 | 25 | (25/20)*100 = 125 |
Sugar | 12 | 16 | 133.33 |
Ghee | 40 | 60 | 150 |
Tea | 80 | 96 | 120 |
N = 5 |
|
| 661.66 |

 =661.66 = 132.33
5
Therefore Price Index for 2001, taking 1996 as base year, = 132.33
Example 4 –
Using simple average of price relative method find price index for 2010, taking 2009 as base year for the following data
Commodities | Price (2009) | Price(2010) |
A | 60 | 80 |
B | 50 | 60 |
C | 60 | 72 |
D | 50 | 75 |
E | 25 | 37 .5 |
F | 20 | 30 |
Solution
Commodities | Price (2009) | Price(2010) | Price relatives |
A | 60 | 80 | 133.33 |
B | 50 | 60 | 120 |
C | 60 | 72 | 120 |
D | 50 | 75 | 150 |
E | 25 | 37 .5 | 150 |
F | 20 | 30 | 150 |
N = 6 |
|
| 823.33 |
= 823.33/6 = 137.22
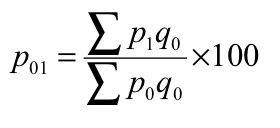
3. Weighted aggregative method – in this method, according to the relative importance, different weights are assigned to the items. Many formulas developed to estimate index numbers on the basis of weights.
Some of the formulas given below

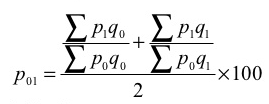


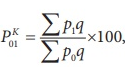
Where q refers to quantity of some period, not necessarily of the mean of the base year and current year.
Example 1 –
Commodity | Base year | Current year | ||
PO | QO | P1 | Q1 | |
A | 10 | 5 | 20 | 2 |
B | 15 | 4 | 25 | 8 |
C | 40 | 2 | 60 | 6 |
D | 25 | 3 | 40 | 4 |
Solution
Commodity | Base year | Current year |
|
|
|
| ||
PO | QO | P1 | Q1 | Poqo | P1qo | Poq1 | P1q1 | |
A | 10 | 5 | 20 | 2 | 50 | 100 | 20 | 40 |
B | 15 | 4 | 25 | 8 | 60 | 100 | 120 | 200 |
C | 40 | 2 | 60 | 6 | 80 | 120 | 240 | 360 |
D | 25 | 3 | 40 | 4 | 75 | 120 | 100 | 160 |
|
|
|
|
| 265 | 440 | 480 | 760 |

P 01 = (440/265)*100 = 166.04

P 01 = (760/480)*100 = 158.33

 P 01 = ((440/265) + (760/480)) *100 = 162
2

 P 01 = √ ((440/265) + (760/480)) *100 = 162.1
Example 2
Commodity | Base year | Current year | ||
PO | QO | P1 | Q1 | |
A | 15 | 500 | 20 | 600 |
B | 18 | 590 | 23 | 640 |
C | 22 | 450 | 24 | 500 |
Solution
Commodity | Base year | Current year |
|
|
|
| ||
PO | QO | P1 | Q1 | Poqo | P1qo | Poq1 | P1q1 | |
A | 15 | 500 | 20 | 600 | 7500 | 10000 | 9000 | 12000 |
B | 18 | 590 | 23 | 640 | 10620 | 13570 | 11520 | 14720 |
C | 22 | 450 | 24 | 500 | 9900 | 10800 | 11000 | 12000 |
|
|
|
|
|
|
|
|
|
|
|
|
|
| 28020 | 34370 | 31520 | 38720 |

P 01 = (34370/28020)*100 = 122.66

P 01 = (38720/31520)*100 = 122.84

 P 01 = ((34370/28020) + (38720/31520)) *100 = 122.66
2
 P 01 = √ = ((34370/28020) + (38720/31520)) *100 = 122.69
Example 3
Commodity | Base year | Current year | ||
PO | QO | P1 | Q1 | |
A | 2 | 8 | 4 | 6 |
B | 5 | 10 | 6 | 5 |
C | 4 | 14 | 5 | 10 |
D | 2 | 19 | 2 | 13 |
Solution
Commodity | Base year | Current year |
|
|
|
| ||
PO | QO | P1 | Q1 | Poqo | P1qo | Poq1 | P1q1 | |
A | 2 | 8 | 4 | 6 | 16 | 32 | 12 | 24 |
B | 5 | 10 | 6 | 5 | 50 | 60 | 25 | 30 |
C | 4 | 14 | 5 | 10 | 56 | 70 | 40 | 50 |
D | 2 | 19 | 2 | 13 | 38 | 38 | 26 | 26 |
|
|
|
|
| 160 | 200 | 103 | 130 |

P 01 = (200/160)*100 = 125

P 01 = (130/103)*100 = 126.21

 P 01 = ((200/160) + (130/103)) *100 = 125.6
2

 P 01 = √ = ((200/160) + (130/103)) *100 = 125.61

= (200+130)/(160+103) *100 = 125.48
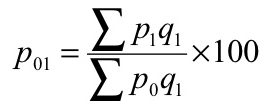
Example 4 – Calculate the price indices from the following data by applying (1) Laspeyre’s method (2) Paasche’s method and (3) Fisher ideal number by taking 2010 as the base year.
Commodity | 2010 | 2011 | ||
PO | QO | P1 | Q1 | |
A | 20 | 10 | 25 | 13 |
B | 50 | 8 | 60 | 7 |
C | 35 | 7 | 40 | 6 |
D | 25 | 5 | 35 | 4 |
Solution
Commodity | 2010 | 2011 |
|
|
|
| ||
PO | QO | P1 | Q1 | Poqo | P1qo | Poq1 | P1q1 | |
A | 20 | 10 | 25 | 13 | 200 | 250 | 260 | 325 |
B | 50 | 8 | 60 | 7 | 400 | 480 | 350 | 420 |
C | 35 | 7 | 40 | 6 | 245 | 280 | 210 | 240 |
D | 25 | 5 | 35 | 4 | 125 | 175 | 100 | 140 |
|
|
|
|
| 970 | 1185 | 920 | 1125 |
P 01 = (1185/970)*100 = 122.16

P 01 = (1125/920)*100 = 122.28

 P 01 = √ = ((1185/970) + (1125/920)) *100 = 120.55
Example 5 - Calculate the Dorbish and Bowley’s price index number for the following data taking 2014 as base year.
Item | 2010 | 2011 | ||
PO | QO | P1 | Q1 | |
Oil | 80 | 3 | 100 | 4 |
Pulses | 35 | 2 | 45 | 3 |
Sugar | 25 | 2 | 30 | 3 |
Rice | 50 | 30 | 54 | 35 |
Solution
Item | 2010 | 2011 |
|
|
|
| ||
PO | QO | P1 | Q1 | Poqo | P1qo | Poq1 | P1q1 | |
Oil | 80 | 3 | 100 | 4 | 240 | 300 | 320 | 400 |
Pulses | 35 | 2 | 45 | 3 | 70 | 90 | 105 | 135 |
Sugar | 25 | 2 | 30 | 3 | 50 | 60 | 75 | 90 |
Rice | 50 | 30 | 54 | 35 | 1500 | 1620 | 1750 | 1890 |
|
|
|
|
| 1860 | 2070 | 2250 | 2515 |
 P 01 = ((2070/1860) + (2515/2250)) *100 = 111.38
2
Example 6 – calculate a suitable price index from the following data
commodity | Quantity | price | |
|
| 2007 | 2010 |
X | 25 | 3 | 4 |
Y | 12 | 5 | 7 |
Z | 10 | 6 | 5 |
Solution
commodity | Q | P0 | P1 | P0Q | P1Q |
X | 25 | 3 | 4 | 75 | 100 |
Y | 12 | 5 | 7 | 60 | 84 |
Z | 10 | 6 | 5 | 60 | 50 |
|
|
|
| 195 | 234 |
Kelly price index

= 235/195*100 = 120
4. Weighted average of relative method – in this method different weights are used for the items according to their relative importance. If p = [p1/ p0] × 100 is the price relative index and w = p0q0 is attached to the commodity

Where,  means sum of weights for different commodities
 Sum of price relatives
Example 1 –
Commodity | Weight | Base price year | current price year |
A | 5 | 10 | 20 |
B | 4 | 15 | 25 |
C | 2 | 40 | 60 |
D | 3 | 25 | 40 |
Solution
Commodity | Weight | Base price year | current price year | price relatives | RW |
A | 5 | 10 | 20 | 20/10*100 = 200 | 1000 |
B | 4 | 15 | 25 | 25/15*100 =166.7 | 666.8 |
C | 2 | 40 | 60 | 60/40*100 = 150 | 300 |
D | 3 | 25 | 40 | 40/25*100 = 160 | 480 |
| 14 |
|
|
| 2446.8 |

P01 = 2446.8/14 = 174.8
Example 2 – compute price index by applying weighted average of relative method
Commodity | Quantity | Base price year | current price year |
Wheat | 20 | 3 | 4 |
Flour | 40 | 1.5 | 1.6 |
Milk | 10 | 1 | 1.5 |
Solution
Commodity | Quantity | Base price year | current price year | Weight | price relatives | RW |
Wheat | 20 | 3 | 4 | 60 | 133.3 | 8000 |
Flour | 40 | 1.5 | 1.6 | 60 | 106.7 | 6400 |
Milk | 10 | 1 | 1.5 | 10 | 150.0 | 1500 |
|
|
|
|
|
|
|
|
|
|
| 130 |
| 15900 |

P01 = 15900/130 = 122.30
Example 3 – calculate weighted average of relative method
Commodity | Base price year | current price year | Weight |
X | 3 | 4 | 7 |
Y | 1.5 | 1.6 | 8 |
Z | 1 | 1.5 | 9 |
Solution
Commodity | Base price year | current price year | Weight | price relatives | RW |
X | 3 | 4 | 7 | 133.3 | 933.33 |
Y | 1.5 | 1.6 | 8 | 106.7 | 853.33 |
Z | 1 | 1.5 | 9 | 150.0 | 1350 |
|
|
| 24 |
| 3136.66 |

P01 = 3136.66/24 = 130.67
Key takeaways –
A consumer price index or cost of living index, is a measure which indicates the relative changes in the prices of a group of items, necessary for the living for a selected group of consumers. In a way, it tells us about what should be the increase in the wages of consumer so that they are able to maintain some standard of living in two time periods. For this purpose, the total expenditure of a household are categorized like food, clothing, rent, electricity, entertainment, education, medicines, miscellaneous etc.
Consumer Price Index number or Cost of living index number measures the effect of changes in the prices of the described basket of goods and services on the purchasing power of a particular class of people during current period as compared with some base period. Change in the cost of living of an individual between two periods means the change in his money income, which will be necessary for him to maintain the same standard of living in both periods. There the cost of living index numbers are intended to measure the average increase in the cost of maintaining the same standard in a given year as in the base year.
Computation of consumer price index number
For computing consumer Price Index no. or cost of living index no. we need to have prices and quantity consumed for different categories of items in base a year and current year.
Let
Poj = Price of jth commodity in 0 year (base year)
Pij = Price of jth commodity in I year (current year).
qoj = Quantity consumed for j th commodity in 0 year (base year)
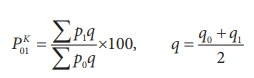
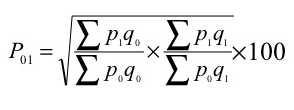
Now, consumer Price Index no. is derived as the weighted average of the price relatives, the weight being the values of the quantities consumed in the base year. Price relative
Weight
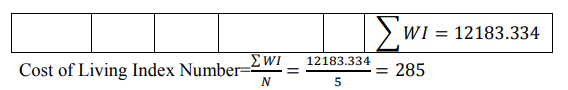
Then,
Consumer Price Index
Example
Construct the cost of living index for the year 1982 (Base 1980 = 100).
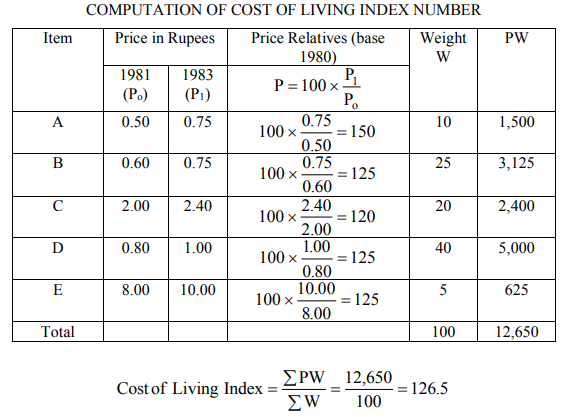
Solution
Problems in construction of index numbers
1) Definition of the purpose for which the index is being compiled - Before gathering data and making calculations, it is important to know what we are trying to measure, and also how we intend to use our measures. An index number properly designed for the purpose in hand is a most useful and powerful tool. If not properly compiled and constructed, it can be a dangerous one
2) Selection of data for inclusion in index - Although the method of combining the variables is of considerable importance in constructing index numbers, it is insignificant when compared with the problem of selecting the data that are the raw materials of the index. Too much emphasis cannot be put upon this point. The data must be accurate and homogeneous; and the sample should be a good representative of the whole. A sample cannot be expected to be representative unless adequate number of items are included. To state the idea in other language: a sufficiently large sample of relevant items must be selected to obtain reliable index numbers.
3) Selection of sources of data - When selecting the sources of data for index numbers, we may rely on regularly published quotations or obtain periodic special reports from the merchants, producers, exporters, or others, who possess the basic information needed. Under either circumstance, we must make sure that the data pertains strictly to the thing being measured. Thus, if retail food price changes are being measured, quotations should be from super markets, chain stores, independent stores and any other important outlets.
4) Collection of data - (i) Accuracy: Statistical data that appear in precise printed form are not necessarily accurate. (ii) Comparability over space and time: When data are to be drawn from two or more sources, the reliability of each source must be considered and, in-addition, the user must be sure that the data from the different sources are comparable
5) Selection of Base - Regardless of the formula employed for weighting and combining the data, it customary (although not necessary) combining to select some period of time as 100 per cent with which compare the other index numbers. A month is ordinarily too short a period to use as base period, since any one month is likely to be unusual on account of accidental or seasonal influences. A year is sometimes used. However, it is often true that no one year is sufficiently “ normal” -to be a good basis of comparison. Business and prices are always advancing or receding with, the business cycle.
6) Method of combining Data- There are two methods of constructing index numbers: (1) by computing aggregate values (2) by averaging relatives. Each of these basic procedures may be further described as simple (un weighted) or specifically weighted. Although only the specifically weighted procedures are logically defensible, the simple unweighted procedures are usually explained because they are sometimes used, and their development leads naturally to the problems and effects of various weighting systems. The aggregative method obtains the result directly, and produces a result that has a simple and clear meaning; the method employing relatives is more roundabout, and its meaning is more technical.
7) Systems of Weighting- In selecting the weights for an index, attention must be paid to the use that will be made of the result. If a price index is to measure the changes in the prices paid by consumers, it is necessary for the weights applied to the various commodities to reflect the importance of the individual items to consumers. Likewise, the weights for an index of farm prices should reflect the importance of the various commodities in the income of farmers. Frequently the commodities included in an index and the weights assigned to items do not give the information wanted for the solution of a particular problem.
Key takeaways –
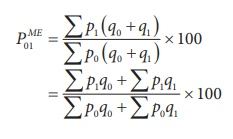
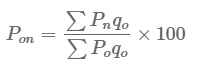
Aggregate Expenditure Method
In this method, the quantities of commodities consumed by the particular group in the base year are estimated and these figures or their proportions are used as weights. Then the total expenditure of each commodity for each year is calculated. The price of the current year is multiplied by the quantity or weight of the base year. These products are added. Similarly, for the base year the total expenditure of each commodity is calculated by multiplying the quantity consumed by its price in the base year. These products are also added. The total expenditure of the current year is divided by the total expenditure of the base year and the resulting figure is multiplied by 100 to get the required index numbers. In this method, the current period quantities are not used as weights because these quantities change from year to year.
Here,
Pn Represent the price of the current year,
Po Represents the price of the base year and
qo Represents the quantities consumed in the base year.
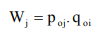
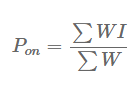
Family Budget Method
In this method, the family budgets of a large number of people are carefully studied and the aggregate expenditure of the average family for various items is estimated. These values are used as weights. The current year’s prices are converted into price relatives on the basis of the base year’s prices, and these price relatives are multiplied by the respective values of the commodities in the base year. The total of these products is divided by the sum of the weights and the resulting figure is the required index numbers.
Here, I=Pn/P0×100 and W=Poqo
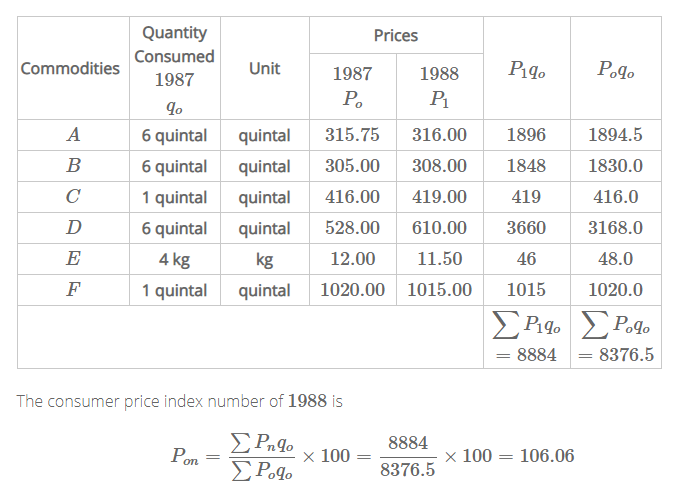
Examples
Construct the consumer price index number for 1988 on the basis of 1987 from the following data using: (1) Aggregate Expenditure Method (2) Family Budget Method.
Commodities | Quantity consumed in 1987 | Unit | Prices | |
1987 | 1988 | |||
AA | 6 quintal | quintal | 315.75 | 316 |
BB | 6 quintal | quintal | 305 | 308 |
CC | 1 quintal | quintal | 416 | 419 |
DD | 6 quintal | quintal | 528 | 610 |
EE | 4 kg | kg | 12 | 11.5 |
FF | 1 quintal | quintal | 1020 | 1015 |
Solution
The consumer price index number of 1988 by Aggregate Expenditure Method:
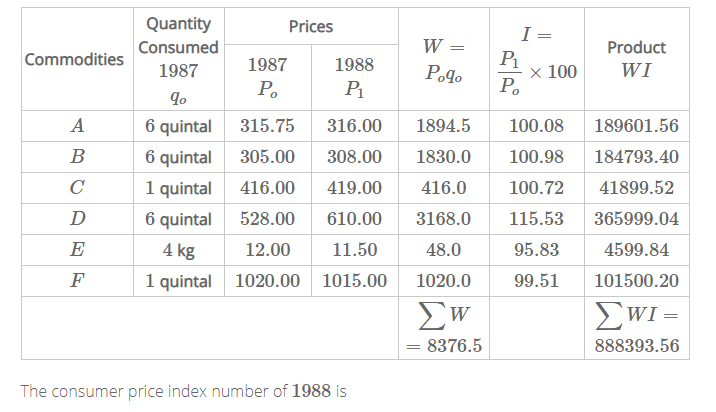
2. The consumer price index number of 1988 by Family Budget Method:
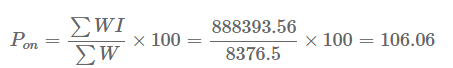
Key takeaways –
Inflation
Inflation is a quantitative measure of the speed at which the average price level of a basket of selected goods and services in an economy increases over a period of time. it's the constant rise within the general level of prices where a unit of currency buys but it did in prior periods. Often expressed as a percentage, inflation indicates a decrease within the purchasing power of a nation’s currency.
Inflation – its concepts and causes of inflation.
According to A.C. Pigou (Cambridge University), inflation comes in existence “when money income is expanding more than in proportion to income activity”. An increase in general price level takes place when people have more money income to spend against less goods and services.
G. Crowther (British economists)brings out the meaning precisely when he says, “inflation is a state in which the value of money is falling i.e. prices rising”.
Inflation, according to Harry G. Johnson (Canadian economist), “is a sustained rise in prices”.
Paul Samuelson (American economist) defines inflation as “a rise in the general level of prices”.
According to Milton Friedman (American economists), ‘inflation is taxation without representation’.
Uses of index number
Most commonly used index numbers
Price Index Numbers are most popular and commonly used Index Numbers. These Index Numbers measure the change in price of some commodities or group of commodities consumed in the given period with reference to the Base period.
There are two types: 1. Whole sale Price Index: It measures the change in general price level of commodity. 2. Retail Price Index: It measures the general changes in retail price of commodities.
Key takeaways –
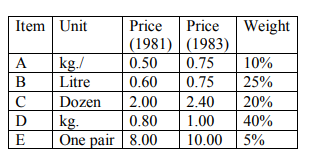
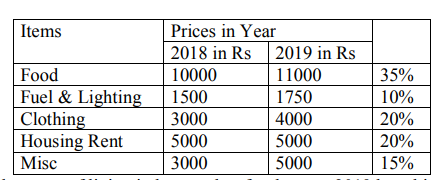
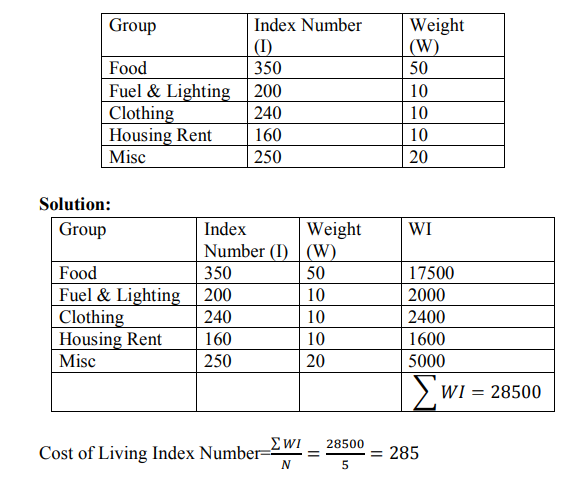
Example 1 A family budget survey of middle class families gives the following data: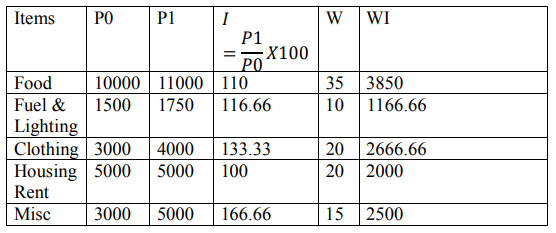
Calculate cost of living index number for the year 2019 by taking 2018 as base year.
Solution
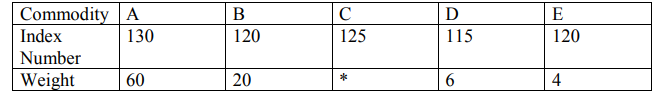
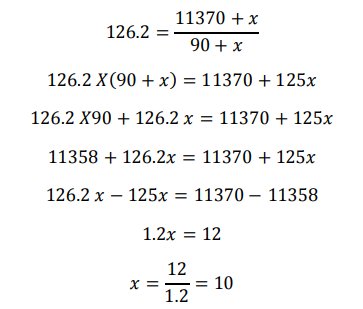
Example 2 Cost of living index number of the following data is known to be 126.2. Obtain the missing weight.
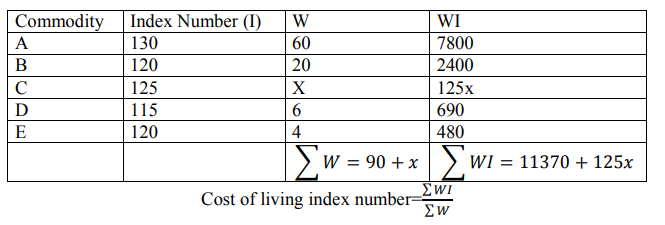
Solution
Suppose the missing weight is x. We calculate cost of living index number as usual and equate to given value 126.2.
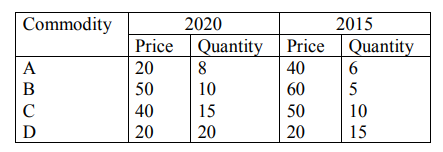
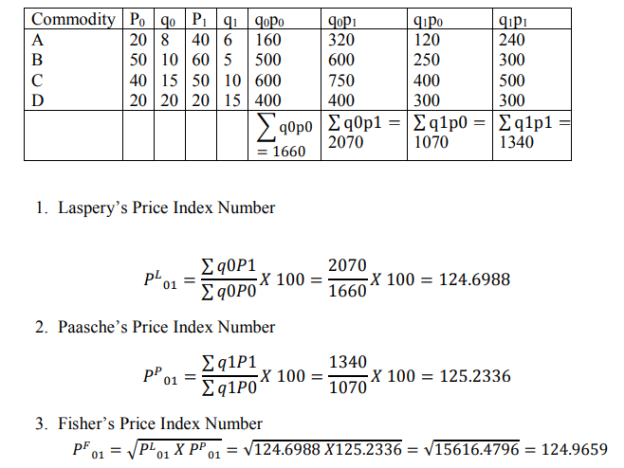
Example 3 Calculate price index number for the following data for the year 2020 taking 2015 as a base year by using Lasperys, Paasche’s and Fishers price index number
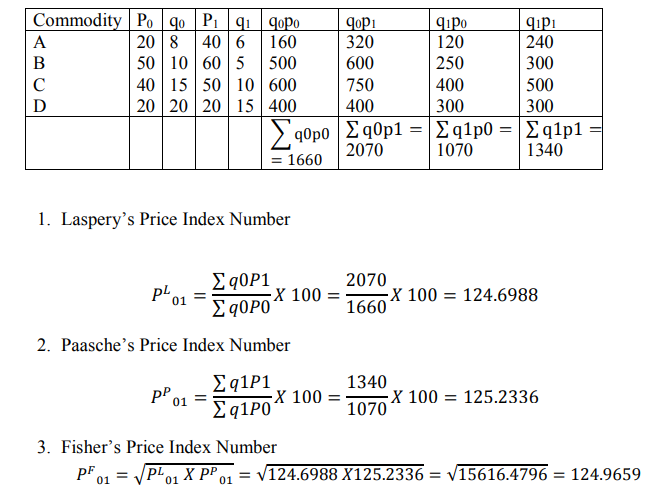
Solution
References-


