Unit 3
Population and Sample
“Statistics is a body of methods for making wise decisions on the face of uncertainty.” —Wallis and Roberts
“Statistics is a body of methods for obtaining and analyzing numerical data in order to make better decisions in an uncertain world.” —Edward N. Dubois
Statistics are numerical statement of facts in any department of enquiry placed interrelation to each other.-Bouly.
The science of Statistics is essentially a branch of applied mathematics and can be regarded as a mathematics applied to observation data.- R.A fisher.
After analyzing the various definitions of statistics, the most proper definition of statistics are as follows:
“Statistics in the plural sense are numerical statements of facts capable of some meaningful analysis and interpretation, and in singular sense, it relates to the collection, classification, presentation and interpretation of numerical data.”
There are number of economic laws which have evolved due to statistical analysis in the field of economics, e.g. Engel's law of family expenditure, Malthus theory of population etc. Let us understand the scope of statistics keeping in view the various parts of economics.
- Statistics and the study of consumption: Every individual needs a certain number of things. He spends first on necessities, then on comforts and luxuries, which depend on his income. We discover how different groups spend their income on different items of consumption with the help of statistics.
- Statistics and the study of production: The progress of production every year can easily be measured by statistics. The comparative study of productivity of various elements of production (e.g. land, labour, capital and entrepreneurship) is also done with the help of statistics. The statistics of production are very helpful for adjustment of demand and supply.
- Statistics and the study of exchange: Production is based on national and international demand. A producer needs statistics for deciding the cost of production and selling price so that he can study competition and demand of commodity in a market. The law of price determination and cost price which are bared on the various market conditions and demand and supply can be studied with the help of statistics.
- Statistics and the study of distribution: Statistics are helpful in calculation of national income in the field of distribution statistical methods are used in solving the problem of the distribution of national income. Various problems arise due to unequal distribution of wealth and national income and are solved with the help of statistical data.
Key takeaways –
- Statistical data and techniques of statistical analysis are immensely useful in solving economical problems such as wages, price, time series analysis, demand analysis. It is an irreplaceable tool of production control.
Management Science (MS) can be defined as:
“A problem-solving process used by an interdisciplinary team to develop mathematical models that represent simple-to-complex functional relationships and provide management with a basis for decision-making and a means of uncovering new problems for quantitative analysis”.
- Management science has been effective in increasing the efficiency of working for the business organizations with solving problems and achieving the goals of the enterprise through strategic decision making. It has been very effective in maximizing the profits of the organizations through versatile scientific management techniques
- The management science has been effective in integrating various activities of the enterprises along with the factors of production to increase the productivity of the organisation. The scientific methods have helped in organizing the resources for achieving the objectives of the enterprises
- There were many scientific management methods that were initiated and used during the World War II. The various research and development methods of management science have been beneficial for the industrial sectors and for the betterment of the economy.
Key takeaways –
- Management science is effectively used for solving problems through strategic decision making processes in business organizations. The processes are effective in using scientific methods for managing the resources in the environment and raise the efficiency of the industrial sectors
Population
A well-organized procedure of gathering, recording and analyzing information regarding the members of the population is called a census. Under method census each and every unit of the universe is included in the collection of data. Huge amount of finance, time and labour are required for gathering information. This method is useful to find out the ratio of male to female, the ratio of literate to illiterate people, the ratio of people living in urban areas to the people in rural areas.
Merits
- It helps government with future plans
- It gives complete information about population
- It gives more reliable and accurate information
- It covers wide range of the study
Demerits
- It is time consuming and expensive
- Sometimes we many loose information while investing all individual
- It need a number of manpower
Sampling
The theory of sampling has been developed recently but this is not new. In our everyday life, we have been using sampling theory as we have discussed in the introduction. In all those cases we believe that the samples give a correct idea about the population. Most of our decisions are based on the examination of a few items that are sample studies.
Sample: Statisticians use the word sample to describe a portion chosen from the population. A finite subset of statistical individuals defined in a population is called a sample. The number of units in a sample is called the sample size.
Sampling unit: The constituents of a population which are individuals to be sampled from the population and cannot be further subdivided for the purpose of the sampling at a time are called sampling units. For example, to know the average income per family, the head of the family is a sampling unit. To know the average yield of rice, each farm owner‟ s yield of rice is a sampling unit.
Sampling frame: For adopting any sampling procedure it is essential to have a list identifying each sampling unit by a number. Such a list or map is called sampling frame. A list of voters, a list of house holders, a list of villages in a district, a list of farmers etc. are a few examples of the sampling frame.
Collection of data
Definition
Data collection is defined as the procedure of collecting, measuring and analyzing accurate insights for research using standard validated techniques.
Irrespective of the field of research, data collection is the primary and most important step for research. Depending on the required information, the approach of data collection is different for different fields of study.
The objective of data collection is ensuring that rich information and reliable data is collected for statistical analysis so that data-driven decisions can be made for research.
Data collection method
Data collection methods can be divided into two categories: secondary methods of data collection and primary methods of data collection.
Secondary data - Secondary data is a type of data that has already been published in books, newspapers, magazines, journals, online portals etc. there is lot of information available in these sources. Therefore appropriate secondary data are used in the study plays an important role in terms of increasing the levels of research validity and reliability.
Primary data –
Primary data collection methods can be divided into two groups: quantitative and qualitative.
Quantitative data collection methods are based in mathematical calculations in various formats. Methods of quantitative data collection and analysis include questionnaires with closed-ended questions, methods of correlation and regression, mean, mode and median and others. Quantitative methods are less expensive and they can be applied within shorter duration of time. These methods are easy to make comparison between the findings.
Qualitative research methods, on the other hand, do not involve numbers or mathematical calculations. Qualitative research is closely associated with words, sounds, feeling, emotions, colours and other elements that are non-quantifiable.
Primary and secondary data are discussed more in detail in the below section.
Primary data is the information collected through original or first-hand research. Primary data is more reliable and authenticate as the data is nor changed or altered by any human beings. Also, the data is not published yet. Primary data is gathered by any authorized organization, investigator, and enumerator.
“Data which are gathered originally for a certain purpose are known as primary data.” — Horace Secrist
Sources of primary data
The sources of primary data are as follows –
1. Experiments: In natural sciences, experiments are most reliable source of data collections. Experiments are conducted for medicine, psychological studies, nutrition and other scientific studies. Experiments are conducted in the fields as well as laboratories. The results of experiments are analysed by statistical test and thereafter conclusions are drawn.
2. Survey: surveys are used in social science, management, marketing and psychology to some extent. Surveys are conducted in different methods.
3. Questionnaire: Questionnaires consist of list of question either open ended or close ended for which the participants answer. Questionnaire can be conducted via telephone, mail, institute, fax, etc.
4. Interview: Interviews are expensive method of data collection. The interviewer collects information from each respondent independently. It involves in-depth questioning and follow up question. While taking interview, the interviewer can observe the body language and other reaction to the question.
5. Observation: observation can be conducted with or without knowledge of the participants. Observation can be made either natural or artificially created environment.
Secondary Data:
Secondary data are public information that has been collected by others. The data collected from primary research and used by other is referred as secondary data. The secondary data may be obtained from various sources like industry surveys, database and information system, etc.
“The data which are used in an investigation, but which have been gathered originally by someone else for some other purpose are known as secondary data.” — Blair
Sources of secondary data
Government statistics – government statistics are widely available and easily accessible online. It provides information regarding trade activity, pricing and economic trends, business information, patents, population statistics, heath record, etc
Books – books are available on any topic you want to research. Books provide insight on how much information is given for a particular topic and you can prepare your literature review.
Journals – journals provide up to date information on the very specific topic on which you want to research. Journal is one of the most important sources for providing the information on data collected.
Magazine or newspaper – Newspaper or magazine provide daily information regarding politics, business, sports, fashion, etc which can be used for conducting research.
Internet – internet is becoming advance, fast and reachable to the masses and much information is available on internet. Almost all journals, books are available on internet. Some are free and others you have to pay price
Company website – company’s website provides lots of information. They have a section called investor relations which contains full of annual reports, regulatory findings and investor presentations that can provide insights into both the individual company’s performance and that of the industry at large.
Key takeaways –
- Data can be collected through primary and secondary data
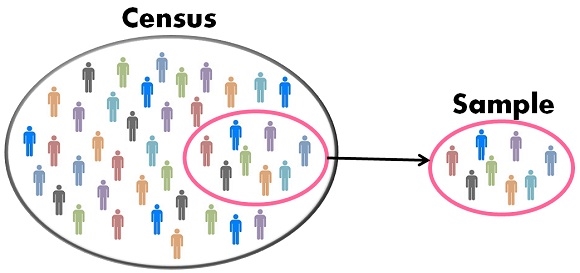
Both census and sampling provide information about a population. In census, each and every unit of population is studies. While in sampling small units are studied which represents the population. Government uses both census and sampling data for various purposes like planning, development programs, etc.
|
Census method
A well-organized procedure of gathering, recording and analyzing information regarding the members of the population is called a census. Under method census each and every unit of the universe is included in the collection of data. Huge amount of finance, time and labor are required for gathering information. This method is useful to find out the ratio of male to female, the ratio of literate to illiterate people, the ratio of people living in urban areas to the people in rural areas.
Merits
- It helps government with future plans
- It gives complete information about population
- It gives more reliable and accurate information
- It covers wide range of the study
Demerits
- It is time consuming and expensive
- Sometimes we many loose information while investing all individual
- It need a number of manpower
Sample
The sample is a small segment considered for study which represents the standard of entire population. The selection of sample should give justifiable conclusion about the whole population. When the population size is very large and it is difficult to consider all members then sampling method is used. Under this method selection of appropriate representative sample is utmost important. On the basis of data collected from sample, conclusion is drawn for the whole population.
Key takeaways –
- In census, each and every unit of population is studies.
- While in sampling small units are studied which represents the population.
Random sampling
A probability sample is one where the selection of units from the population is made according to known probabilities. (eg.) Simple random sample, probability proportional to sample size etc.
Methods
Simple random sampling
A simple random sample from finite population is a sample selected such that each possible sample combination has equal probability of being chosen. It is also called unrestricted random sampling.
SRSWR
SRSWR is a method of selection of n units out of the N units one by one such that at each stage of selection, each unit has an equal chance of being selected, i.e., 1/ . N .
SRSWOR
SRSWOR is a method of selection of n units out of the N units one by one such that at any stage of selection, any one of the remaining units have the same chance of being selected, i.e. 1/N .
Procedure of selection of a random sample:
The procedure of selection of a random sample follows the following steps:
1. Identify the N units in the population with the numbers 1 to N.
2. Choose any random number arbitrarily in the random number table and start reading numbers.
3. Choose the sampling unit whose serial number corresponds to the random number drawn from the table of random numbers.
4. In the case of SRSWR, all the random numbers are accepted ever if repeated more than once. In the case of SRSWOR, if any random number is repeated, then it is ignored, and more numbers are drawn.
Stratified random sampling
Of all the methods of sampling the procedure commonly used in surveys is stratified sampling. This technique is mainly used to reduce the population heterogeneity and to increase the efficiency of the estimates. Stratification means division into groups.In this method the population is divided into a number of subgroups or strata. The strata should be so formed that each stratum is homogeneous as far as possible. Then from each stratum a simple random sample may be selected and these are combined together to form the required sample from the population.
Types of Stratified Sampling:
There are two types of stratified sampling.
They are proportional and non-proportional. In the proportional sampling equal and proportionate representation is given to subgroups or strata. If the number of items is large, the sample will have a higher size and vice versa.
The population size is denoted by N and the sample size is denoted by „ n‟ the sample size is allocated to each stratum in such a way that the sample fractions is a constant for each stratum. That is given by n/N = c. So in this method each stratum is represented according to its size.
In non-proportionate sample, equal representation is given to all the sub-strata regardless of their existence in the population.
Merits and limitations of stratified sampling:
Merits:
- It is more representative.
- It ensures greater accuracy.
- It is easy to administer as the universe is sub - divided.
- Greater geographical concentration reduces time and expenses.
- When the original population is badly skewed, this method is appropriate.
- For non – homogeneous population, it may field good results.
Limitations:
- To divide the population into homogeneous strata, it requires more money, time and statistical experience which is a difficult one.
- Improper stratification leads to bias, if the different strata overlap such a sample will not be a representative one.
Systematic random sampling
This method is widely employed because of its ease and convenience. A frequently used method of sampling when a complete list of the population is available is systematic sampling. It is also called Quasi-random sampling.
The whole sample selection is based on just a random start. The first unit is selected with the help of random numbers and the rest get selected automatically according to some pre designed pattern is known as systematic sampling.
With systematic random sampling every Kth element in the frame is selected for the sample, with the starting point among the first K elements determined at random.
Merits:
- This method is simple and convenient.
- Time and work is reduced much.
- If proper care is taken result will be accurate.
- It can be used in infinite population.
Limitations:
- Systematic sampling may not represent the whole population.
- There is a chance of personal bias of the investigators.
Systematic sampling is preferably used when the information is to be collected from trees in a forest, house in blocks, entries in a register which are in a serial order etc.
Key takeaways –
- Simple random sampling (SRS) is a method of selection of a sample comprising of n number of sampling units out of the population having N number of sampling units such that every sampling unit has an equal chance of being chosen
- Stratified sampling is mainly used to reduce the population heterogeneity and to increase the efficiency of the estimates.
References
- Practical business mathematics by S.A Bari
- Mathematics of commerce by K. Selvakumar
- Business mathematics with application by Dinesh Khattar and S.R Arora
- Statistical methods by Gupta SP


