Unit -2
Polygons, 2D Transformations
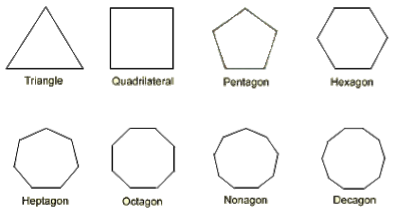
Polygon is an ordered list of vertices.
The plane that is described as the number of straight-line segments connected to form a closed polygonal chain.
The polygon chain is connected by edges and the points that are connected by edges are vertices of polygon.
The interior of the solid polygon is called as body.
The simple polygon is the polygon which does not intersect itself.
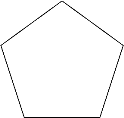
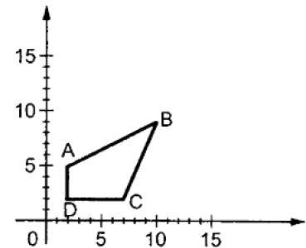
Following figure 2.1 shows the polygon:
Fig. no. 2.1 |
Types of the Polygon
There are three type of polygon according to their convexity or type of non-convexity as:
Convex Polygon:
It is a simple polygon which does not intersect itself.
In convex polygon the points are connected at the boundary only.
The line segments are not going outside the polygon.
It has a simple interior as convex set.
All interiors in the convex polygon are less than or equal to 180 degree.
In strict convex polygons the angles are compulsory less than the 180 degree.
In this polygon the points are inside or on the boundary of the polygon.
The edges define the closed half-plane as polygon.
For each edge the interior point are all on the same side of the line that the edge defines.
The edges are of convex hull as shown in figure 2.1.1.
Fig. no. 2.1.1 |
Concave Polygon:
The concave polygon is the polygon which has one or more angles that are greater than 180 degree.
It should have at least four sides.
It has irregular shapes.
It is not convex polygon.
It is opposite of convex polygon.
The polygon is said to be concave polygon when one of the interior angle is greater than 180 degree.
The area and the parameter are depending on the shape of the polygon.
The vertices of concave polygon are inward and outward as shown in figure 2.1.2.
Fig. no. 2.1.2 |
Complex Polygon:
A complex polygon has a discrete circuit.
The complex polygon can be self-intersecting polygon as shown in figure 2.1.3.
The vertices inside the complex polygons are counted when two edges are connected.
Fig. no. 2.1.3 |
Summary:
Polygon is an ordered list of vertices.
The polygon has three types as concave, complex, convex.
In convex polygon the points are connected at the boundary only.
The concave polygon is the polygon which has one or more angles that are greater than 180 degree.
A complex polygon has a discrete circuit.
2.1.1 Inside-Outside Test
It is also known as the counting number method.
While filling the object we often need to identify whether particular point is inside or outside an object.
Following are two methods that are used to find whether point is inside or outside an object.
- Odd-even rule
- Nonzero winding number rule
2.1.2 Polygon filling methods
Flood Fill Algorithm
In boundary fill algorithm the area and the boundary is filled with different colors.
In objects, the boundary is filled with color by searching for a particular boundary interior color.
Instead, the searching for particular boundary we can paint object by specified interior color.
It relies on the fill color instead of relying on the boundary of object.
It replaces the interior color with the fill color in the object.
This process continues till all the pixels paint by the fill color, when no more pixel of the original interior color exist the algorithm completed.
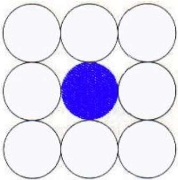
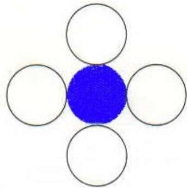
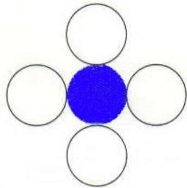
The algorithm relies on the 4 connected and the 8 connected method of filling in the pixels.
This process looking for all adjacent pixels that are a part of the interior.
The following figure 2.1.2(a) shows the representation of flood fill algorithm.
Fig. no. 2.1.2(a) |
Summary:
- It works same as boundary fill or seed fill algorithm.
- The boundary is filled with different color.
Scan Line Fill
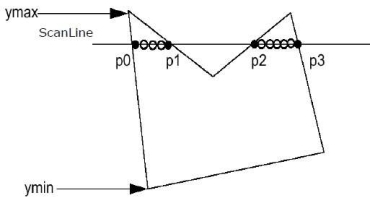
Scan line is the line which intersects the polygon.
This algorithm works by intersecting scan line with polygon edges.
This fills the polygon between the pairs of intersection.
Following are some steps to perform scan line algorithm:
Step 1: find out the Ymin and Ymax from given polygon.
Step 2: the scan line should be intersecting all the edges between Ymin to Ymax. Name the intersection points of the polygon.
Step 3: sort the points of intersection according to X coordinate.
Step 4: the points that are inside the polygon fill it and ignore other points.
Following figure 2.1.2 (b) shows the scan line algorithm:
Fig. no. 2.1.2 (b) |
Summary:
The filling polygon is done by intersection of scan line.
This algorithm has four steps.
Ymin and Ymax is defined then scan line intersects all the edges between Ymin and Ymax.
The points that are inside the polygon get fill other get skipped.
Seed Fill
The seed fill algorithm is works with picking a point inside an object.
The process starts with filling the pixels until it hits the boundary,
As it gets the color of boundary different than the fill color, the algorithm completed.
This algorithm is also known as boundary fill and flood fill algorithm.
The algorithm works on 4 connected or 8 connected pixels.
In this algorithm, the color of boundary is assuming same for entire object.
Following figure 2.1.2 (c) shows the 4 connected and 8 connected seed fill algorithms.
Fig. no. 2.1.2 (c) |
Summary:
Seed fill is same as boundary fill.
The seed point is selected and closest pixels are filled till the boundary points.
Boundary Fill Algorithm
The point is picked from inside the object by boundary fill algorithm.
It starts to fill the pixels from inside until it get hits to the boundary of object.
The working of filling pixels is starts with two different colors as the point inside the object has different color than the boundary of object.
The different colors will shows the difference between boundary and inside the object.
The boundary fill algorithm can be implemented as same as flood fill and seed fill algorithm on 4 connected pixels or 8 connected pixels.
4 connected polygons:
The figure 2.1.2 (d) shows the 4 connected pixels.
Fig. no. 2.1.2(d) |
Algorithm:
Step 1: take the value of seed point as (seed x, seed y), fcolor and dcol.
Step 2: Decide the value of boundary polygon.
Step 3: check the color of boundary pixel and seed point color if it is default then repeat the step 4 and 5.
Step 4: if it is not the boundary pixel then change the color to fill color at the seed point.
Step 5: follow the process with the neighborhood points.
Step 6: exit
8 Connected Polygon:
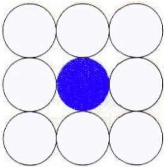
This technique is connected by 8 pixels as shown in figure 2.1.2(e).
|
Fig.no. 2.1.2(e):
The pixels are putting above, below, left, right and diagonal of the object.
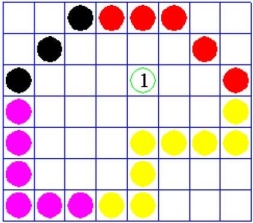
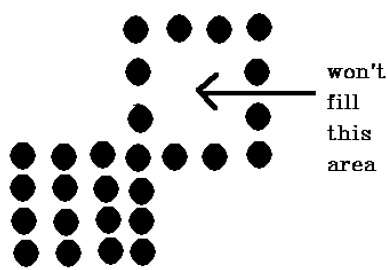
The 4 connected boundary fill algorithm failed to fill the area as marked in following figure 2.1.2(f) but this won’t happens in 8 connected algorithm.
Fig. no. 2.1.2(f) |
Algorithm:
Step 1: take the value of seed point as (seed x, seed y), fcolor and dcol.
Step 2: Decide the value of boundary polygon.
Step 3: check the color of boundary pixel and seed point color if it is default then repeat the step 4 and 5.
Step 4: if it is not the boundary pixel then change the color to fill color at the seed point.
Step 5: follow the process with the neighborhood points.
Step 6: exit
Summary:
The boundary fill algorithm is shown as 4 connected and 8 connected polygon.
The seed point is selected and all the inside points are filled with different color than boundary color.
2.2.1 Translation
The translation process is used to move an abject to the different position on the screen.
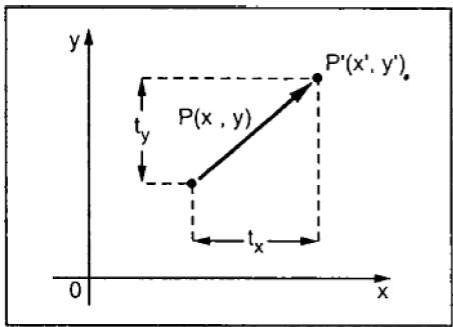
The translation done by adding translation coordinates (tx, ty) to the original coordinates.
The figure 2.2.1 shows the translation process.
Fig. no. 2.2.1 |
In the figure, X’=X+tx Y’=Y+ty The pair (tx, ty) is called the translation vector or shift vector.
P = X
T = tx ty
= X + tx Y ty |
2.2.2 Scaling
The scaling transformation is done for changing the size of abject.
The dimension of the abject can be compress or expand by using scaling.
The scaling can be achieved by multiplying the original coordinates with the scaling factor to get the desired result.
The scaling factors be Sx and Sy with respt to x and y coordinates.
If the value assigned to the scaling factor S is less than 1 then the size of the abject will compressed.
If the value assigned to the scaling factor S is greater than 1 then the size of the abject will increased.
Following figure 2.2.2 shows the scaling process.
|
Fig.no. 2.2.2
Let assume that the original coordinates are X and Y and the scaling factors are (Sx, Sy).
The mathematics representation of the scaling represented as shown below: X’=X * Sx And Y’=Y * Sy
P= X and S= Sx Y Sy
= X * Sx Y Sy |
2.2.3 Rotation
The rotation is used for rotating the object at particular angle Ꙫ from its origin.
The following figure shows the point P that is located at angle ф from the horizontal X coordinate with distance r from the origin.
The rotation is achieved by using the following rotation equation: X’=X * cos Ꙫ - Y * sin Ꙫ Y’ =X * sin Ꙫ + Y * cos Ꙫ In matrix for, the clockwise rotation represented as shown below: X’ = cos Ꙫ - sin Ꙫ * X Y’ sin Ꙫ cos Ꙫ Y In matrix for, the anti-clockwise rotation represented as shown below: R= cos Ꙫ sin Ꙫ -sin Ꙫ cos Ꙫ The homogeneous coordinates will be represented as : X’ = cos Ꙫ - sin Ꙫ 0 * X Y’ sin Ꙫ cos Ꙫ 0 Y 1 0 0 1 1 |
2.2.4 Reflection and Shearing transformation
Reflection Transformation
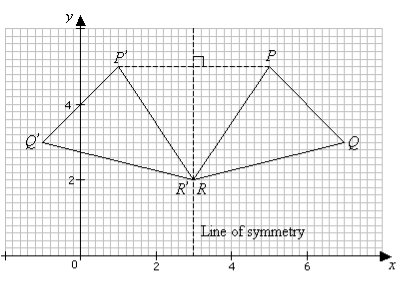
All the points are reflected or flipped on a line called as axis reflection or line of reflection.
The reflection can be referred as axis of symmetry or mirror line.
The reflected diagram is exactly same as original diagram is known as isometric transformation.
The reflected diagram is facing in opposite direction.
Following figure 2.2.4 shows the reflection transformation.
Fig. no. 2.2.4 |
Shearing transformation
The shear transformation is used for slanting the shape of the object.
Shearing is also known as skewing.
There are two shear transformations X-shear and Y-shear.
The X-shear shifts the X coordinates and Y-shear shifts the Y coordinates.
In both the cases only one coordinate changes and other preserves.
X-shear:
It preserves the Y coordinate and changes made with X coordinate.
Hence only vertical lines of object get tilt on right or left side as shown in below figure:
The transformation matrix for X- shear:
Y’=Y + Shy * X and X’=X
Y-shear:
It preserves the X coordinates and make changes with the Y coordinates.
The horizontal line of the object slopes toward up or down as shown in below figure:
The transformation matrix for X- shear:
X’=X + Shx * Y and Y’=Y
2.2.5 Matrix Representation and Homogeneous Coordinates System
The homogeneous coordinates are used to perform any transformation such as the translation followed by rotation and the scaling.
The translation follows the sequential process as-
Translate the coordinates
Rotate the translated coordinates
Scale the rotated coordinates to complete the transformation
The process can be shortened by the using the matrix of 3*3 instead of using matrix 2*2. This matrix is called as transformation matrix.
To convert 2*2 matrix in 3*3 we have to add just coordinate w.
In this way the representation of points by 3 numbers instead of 2 numbers, it is known as the homogeneous coordinates.
We can represent all the transformation by using homogeneous coordinates in matrix multiplication.
Any Cartesian point can be converted to homogeneous coordinates by P’ (Xh, Yh, h)
2.2.6 Composite transformation
Some transformations as scaling, translating, rotating is required to move image on screen.
The composite transformation is transformation that perform two or more transformation one after other.
The mathematical process is required to move image in graphics transformation as corresponds to matrix multiplication of transformation matrices and data matrix of homogeneous coordinates.
References
- S. Harrington, “Computer Graphics” ‖, 2nd Edition, McGraw-Hill Publications, 1987, ISBN 0 – 07– 100472 – 6.
- Donald D. Hearn and Baker, “Computer Graphics with OpenGL”, 4th Edition, ISBN-13:9780136053583.
- D. Rogers, “Procedural Elements for Computer Graphics”, 2nd Edition, Tata McGraw-Hill Publication, 2001, ISBN 0 – 07 – 047371 – 4.
- J. Foley, V. Dam, S. Feiner, J. Hughes, “Computer Graphics Principles and Practice” ‖, 2nd Edition, Pearson Education, 2003, ISBN 81 – 7808 – 038 – 9.
- D. Rogers, J. Adams, “Mathematical Elements for Computer Graphics” ‖, 2nd Edition, Tata McGraw Hill Publication, 2002, ISBN 0 – 07 – 048677 – 8.
