UNIT 1
Consumer Behavior
In economics utility is the capacity of a commodity to satisfy human wants. Utility of a commodity is its want-satisfying capacity. The more the need of a commodity or the stronger the desire to have it, the greater is the utility derived from the commodity. Utility is subjective. Different individuals can get different levels of utility from the same commodity. For example, someone who likes chocolates will get much higher utility from a chocolate than someone who is not so fond of chocolates.
Utility is the basis of consumer demand. A consumer thinks about his demand for a commodity on the basis of utility derived from the commodity.
Definition:
According to Prof. Waugh:
“Utility is the power of commodity to satisfy human wants.”
According to Fraser:
“On the whole in recent years the wider definition is preferred and utility is identified, with desireness rather than with satisfyingness.”
Types:
1. Form Utility:
This utility is created by changing the form or shape of the materials. For example—A cabinet turned out from steel furniture made of wood and so on. Basically, from utility is created by the manufacturing of goods. Form utility can be generated by making use of appropriate design, fine quality materials, and providing a wide range of resources from which to select.
2. Place Utility:
This utility is created by transporting goods from one place to another. Thus, in marketing goods from the factory to the market place, place utility is created. Similarly, when food-grains are shifted from farms to the city market by the grain merchants, place utility is created. Transport services are basically involved in the creation of place utility. In retail trade or distribution services too, place utility is created. Similarly, fisheries and mining also imply the creation of place utility.
3. Time Utility:
Storing, hoarding and preserving certain goods over a period of time may lead to the creation of time utility for such goods e.g., by hoarding or storing food-grains at the time of a bumper harvest and releasing their stocks for sale at the time of scarcity, traders derive the advantage of time utility and thereby fetch higher prices for food-grains. Utility of a commodity is always more at the time of scarcity. Trading essentially involves the creation of time utility.
4. Service Utility:
This utility is created in rendering personal services to the customers by various professionals, such as lawyers, doctors, teachers, bankers, actors etc.
Measures of utility:
Cardinal utility-
Cardinal utility refers to the proposition that economic prosperity can be rightly perceived and provided with value. Individuals can determine the use of certain products consumed. It prompts measuring of the satisfactory levels in units.
Ordinal utility-
The functions that represent utility of a product according to its preference, but does not provide any numerical figure refers to ordinal utility. Ordinal utility believes that the satisfaction level cannot be evaluated; however, it can be levelled.
Relationship between Marginal Utility and Total Utility:
Total utility is the sum of all utilities derived by a consumer form all units of commodity consumed by him. Whereas Marginal utility is the addition to the total utility derived by consuming an extra or additional unit of a commodity. In other words, marginal utility derived from the consumption of an additional or extra unit of a commodity.
The following illustration of a schedule and a diagram explain the relationship between total utility and Marginal utility. Let us assume that an individual consumer Mr. ‘X’ found of mangoes and start consuming unit of mangoes in quick successive unit of mangoes.
Units of mangoes | Total Utility (T.U) | Marginal Utility(M.U) |
1 2 3 4 5 6 7 | 10 18 24 28 30 30 28 | 10 8 6 4 2 0 -2 |

With the help of the Schedule and Diagram we derives the following three conclusion-
1. Mu goes on diminishing as the consumer consumes more and more units of a commodity. And TU increases but, at a diminishing rate.
2. There is an inverse relationship between MU and stock of the commodity i.e. as the stock of the commodity consumed increases, MU goes on diminishing.
3. When MU is Zero, TU is the maximum and it is the point of maximum satisfaction. i.e., point of satiety.
When Mu becomes negative, total utility starts diminishing. This is the area of dissatisfaction.
Law of diminishing marginal utility:
The law of diminishing marginal utility describes a familiar and fundamental tendency of human behavior. The law of diminishing marginal utility states that:
“As a consumer consumes more and more units of a specific commodity, the utility from the successive units goes on diminishing”.
Mr. H. Gossen, a German economist, was first to explain this law in 1854. Alfred Marshal later on restated this law in the following words:
“The additional benefit which a person derives from an increase of his stock of a thing diminishes with every increase in the stock that already has”.
This law is based upon three facts-
The law of diminishing marginal utility is based upon three facts-
Explanation:
Suppose a man is very thirsty. He goes to market and buy a glass of sweet water. The glass of water gives him immense pleasure or say first glass of water is great utility for him. If he takes second glass utility is than first one. If he drinks third glass of water, the utility of the third glass will be less than that of second and so on. And if he increases the glass of water will reach at the stage where he feel negative increase or say utility is declined.
Simply we say in a given span of time the more use of product the lesser will be the utility.
Assumption of the law
Assumption of law of diminishing utility are:
Schedule:
Units | Total utility | Marginal utility |
1st glass | 20 | 20 |
2nd glass | 32 | 12 |
3rd glass | 40 | 8 |
4th glass | 42 | 2 |
5th glass | 42 | 0 |
6th glass | 39 | -3 |
From the above table, it is clear that in a given span of time, the first glass of water to a thirsty man gives 20 units of utility. When he takes second glass of water, the marginal utility goes on down to 12 units; When he consumes fifth glass of water, the marginal utility drops down to zero and if the consumption of water is forced further from this point, the utility changes into disutility (-3).
Diagram
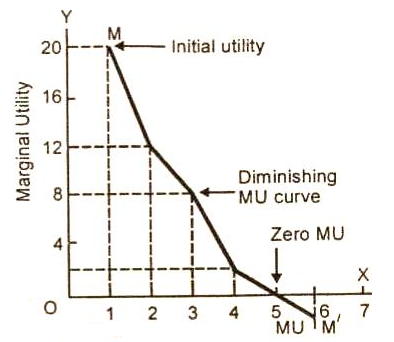
In the above figure, X axis we measure units of a commodity consumed and on the Y axis is shown the marginal utility derived from them. The marginal utility of the first glass of water is called initial utility. It is equal to 20 units. The MU of the 5th glass of water is zero. It is called satiety point. The MU of the 6th glass of water is negative (-3). The MU curve here lies below the OX axis. The utility curve MM/ falls left from left down to the right showing that the marginal utility of the success units of glasses of water is falling.
Law of equi marginal utility
The law of equi-marginal utility is simply an extension of law of diminishing marginal utility to two or more than two commodities. The law of equilibrium utility is known, by various names. It is named as the Law of Substitution, the Law of Maximum Satisfaction, the Law of Indifference, the Proportionate Rule and the Gossen’s Second Law.
In cardinal utility analysis, this law is stated by Lipsey in the following words:
“The household maximizing the utility will so allocate the expenditure between commodities that the utility of the last penny spent on each item is equal”.
The law of equi-marginal utility explains the behaviour of a consumer when he consumers more than one commodity. Wants are unlimited but the income which is available to the consumers to satisfy all his wants is limited. This law explains how the consumer spends his limited income on various commodities to get maximum satisfaction.
Definition
In the words of Prof. Marshall, 'If a person has a thing which can be put to several uses, he will distribute it among these uses in such a way that it has the same marginal utility in all'.
The law states that a consumer should spend his limited income on different commodities in such a way that the last rupee spent on each commodity yield him equal marginal utility in order to get maximum satisfaction.
Suppose there are different commodities like A, B, …, N. A consumer will get the maximum satisfaction in the case of equilibrium i.e.,

Where MU’s are the marginal utilities for the commodities and P’s are the prices of the commodities.
Assumption-
Explanation:
Suppose a consumer wants to spend his limited income on Apple and Orange. He is said to be in equilibrium, only when he gets maximum satisfaction with his limited income. Therefore, he will be in equilibrium at the point where the utility derived from the last rupee spent on

Law of equi marginal utility schedule-
Units | Marginal utility of apple | Marginal utility of orange |
1 | 10 | 8 |
2 | 9 | 7 |
3 | 8 | 6 |
4 | 7 | 5 |
5 | 6 | 4 |
6 | 5 | 3 |
7 | 4 | 2 |
8 | 3 | 1 |
Suppose the ma tility of money is constant at Rs 1 = 5 units, th er will buy 6 nits of apple and 5 units of Orange. His total expenditure will be (Rs 5 x 6) + (Rs 4 x 5 ) = Rs 50/- on both commodities. At this point of expenditure his satisfaction is maximised and therefore he will be in equilibrium.
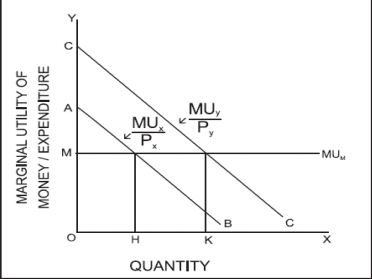
Taking the income of a consumer as given, let his marginal utility of money be constant at OM utils in the above fig. MUX/p X is equal to OM (the marginal utility of money) when OH apple amount of good apple is purchased; MUY/p Y is equal to OM when OK quantity of good orange is purchased. Therefore, the consumer will be in equilibrium when he buys OH of apple and OK of orange.
Limitation:
Consumer Equilibrium
Consumer equilibrium in case of single commodity:
Consumer’s equilibrium in case of a single commodity can be explained on the basis of the law of diminishing marginal utility. How does a consumer decide as to how much to buy of a good? It will depend upon two factors.
(a) The price she pays for each unit which is given and
(b) The utility she gets.
At the time of purchasing a unit of a commodity, a consumer compares the price of the given commodity with its utility. The consumer will be at equilibrium when marginal utility (in terms of money) equals the price paid for the commodity say ‘X’ i.e. MUx = PX. (Note that marginal utility in terms of money is obtained by dividing marginal utility in utils by marginal utility of one rupee).
If MUx > Px, the consumer goes on buying the commodity because she is paying less for each additional amount of satisfaction. As she buys more, MU falls due to operation of law of diminishing marginal utility. When MU becomes equal to price, consumer gets maximum satisfaction and now she is at equilibrium. When MUx < Px, the consumer will have to reduce consumption of the commodity to raise his total satisfaction till MU becomes equal to price. This is because she is paying more than the additional amount of satisfaction that she is getting. Consumer’s equilibrium (in case of single commodity) can be explained with the help of table given below. Suppose, the consumer wants to buy a good which is priced at .10 per unit. Further, suppose, MU obtained from each successive unit is determined. Assumed that 1 util = Re. 1.
Consumption (units of X) | Price (Px) | MUx (utils) | MUx (1 util = Re. 1) | Difference | Remark |
1 | 10 | 20 | 20/1 = 20 | 10 | MUx> Px, consumer will |
2 | 10 | 16 | 16/1 = 16 | 6 | increase the consumption |
3 | 10 | 10 | 10/1 = 10 | 0 | MUx = Px, consumer’s equilibrium |
4 | 10 | 4 | 4/1 =4 | -6 | MUx < Px, consumer will |
5 | 10 | 0 | 0/1 = 0 | -10 | decrease the consumption |
6 | 10 | -2 | -2/1 = -2 | -12 |
|
It is clear from the table that the consumer will be at equilibrium when he buys 3 units of the commodity X. He will increase consumption beyond 2 units as MUx > Px. He will not consume 4 units or more of the commodity X as MUx < Px.
Consumer equilibrium in case of two or more commodities:
The law of diminishing marginal utility applies in case of one commodity only. But in real life a consumer normally consumes more than one commodity. In such a situation, law of equi-marginal utility helps in optimum allocation of his income. Law of equi-marginal utility is based on law of diminishing marginal utility. According to the law of equi-marginal utility a consumer will be in equilibrium when the ratio of marginal utility of a commodity to its price equals the ratio of marginal utility of other commodity to its price.
Let a consumer buys two goods X and Y. Then at equilibrium
MUx/Px = MUY/PY = MU of last rupee spent on each good, or simply MU of Money.

Similarly if there are three goods X, Y, Z then the condition of equilibrium will be simply MU Money.
Thus, to be in equilibrium -
1. Marginal utility of the last rupee of expenditure on each good is the same.
2. Marginal utility of a good falls as more of it is consumed.
To explain the consumer’s equilibrium in case of two goods let us take an example. Suppose a consumer has Re 24 with him to spend on two goods X and Y. Further, suppose price of each unit of X is Re 2 and that of Y is Re 3 and his marginal utility schedule is given in table below.
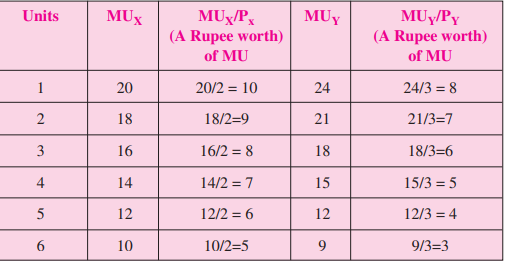
For obtaining maximum satisfaction from spending his income of Re 24, the consumer will buy 6 units of X by spending Re 12 (Re 12 = 2 × 6) and 4 units of Y by spending Re 12 (Re 12 = 2 × 6). This combination of goods brings him maximum satisfaction (or state of equilibrium) because a rupee worth of MU in case of good X is 5 (MUx/Px = 10/2) and in case of good Y is also 5
(MUY/PY = 15/3)
(= MU of last rupee spent on each good)
It should be noted that, consumer’s maximum satisfaction is subject to-budget constraints i.e. the amount of money to be spent by the consumer (Re24 in this example).
Derivation of Demand Curve:
A demand curve has been defined as a curve that shows a relationship between the quantity-demanded of a commodity and its price assuming income, the tastes and preferences of the consumer and the prices of all other goods constant. To draw an individual demand curve the information regarding prices of a commodity at different levels and their corresponding quantities demanded is required.
When a demand curve is to be drawn, units of money are measured on the vertical axis while the quantity of a commodity for which demand curve is to be drawn are shown on the horizontal axis.
Suppose a consumer has an income of Rs.240. If the price of the commodity X is Rs.60 per unit, the relevant price line will be LM1, because at this 2 units can be purchased. The consumer is in equilibrium at point el where the consumer buys 2 units of the commodity.
Suppose the price of X falls to Rs.40 per unit. The price line shifts to LM2. The consumer attains a new equilibrium point e2 and buys 3 units of X. As the price of X further falls, the budget line shifts to the right and new successive points of equilibrium are attained where the consumer is in equilibrium at e3 and e4 and buys 5 and 7 units of commodity X when the price is Rs.30 and Rs.24 per unit respectively.
With the above information, we draw up the following demand schedule of the consumers-

If we plot the data contained the individual consumer’s demand schedule we get points like Q1, Q2, Q3 and Q4. We can easily join these points with a continuous curve. What we get is the usual demand curve of the consumer for the commodity X. We find that the derived demand curve slopes downward from left to right just like usual demand curve.
The demand curve for normal goods will always have a negative slope denoting that the quantity bought increases as the price falls.
Key takeaways –
Indifference curve analysis:
Utility analysis suffers from a flaw in the subjective nature of utility, that is, the inability to measure utility quantitatively and accurately. To overcome this difficulty, economists developed a different approach based on the indifference curve. According to this indifference curve analysis, utility cannot be accurately measured, but the consumer can state which of the combinations of two goods he prefers, without describing the magnitude of the strength of his preference.
This means that if the consumer is presented with a number of different combinations of goods, he can order or rank them on a “scale of preference “if the different combinations are marked a, B, C, D, E, etc. In this case, the consumer can tell whether he likes A to B or B to A or is indifferent between them. Similarly, he can show his preference or indifference between other pairs or combinations.
The concept of order utility means that consumers cannot go beyond stating their preferences or indifference. In other words, if consumers prefer A to B, they don't know by “how much “they prefer A to B. Consumers cannot state the “quantitative difference “between different satisfaction levels. He can simply compare them “qualitatively". That is, it is possible to determine whether simply one satisfaction is higher than another, or lower, or equal.
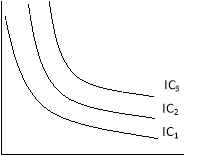
The basic tool of the Hicks-Allen order analysis of demand is the indifference curve, which represents all those combinations of goods that give the consumer the same satisfaction. In other words, all the combinations of goods that lie on the consumer's indifference curve are equally preferred by him. The independence curve is also known as the Iso-utility curve. Indifferent schedules are tabular statements showing different combinations of two goods that bring the same level of satisfaction.
Table Indifference schedule:
Combination Rice (X) Wheat (Y)
I | 1 | 12 |
II | 2 | 8 |
III | 3 | 5 |
IV | 4 | 3 |
V | 5 | 2 |
Now consumers are asked to tell the amount of wheat (Y) they are willing to give up the benefit of an additional unit of rice (X) so that the level of satisfaction remains the same. If the profit of one unit of rice fully compensates for the loss of 4 units of wheat, then the following combination of 2 units of rice.
And eight units of wheat will give him as much.
Satisfaction as the first or first combination. A set of indifferent curves representing the size of preference at different levels of satisfaction are understood because the indifferent curve map (below figure).
Although the combination lying on the indifferent curve 3 (IC3) provides the same satisfaction
Product X
Commodity X
Indifference Curve Map:
In the above Figure indifference curve map the level of satisfaction in the indifference curve 3 (IC3) is greater than the level of Satisfaction with indifference curve 2(IC2).
I) The nature of the indifference curve
A) Downward inclination: the indifference curve tilts downwards from left to right.
This means that when the amount of one good in a combination increases, the amount of another must necessarily be reduced so that the total satisfaction is constant.
If the indifference curve is a horizontal straight line (parallel to the X-axis),
Then the indifference curve is a horizontal straight line (parallel to the X-axis),
As shown in the below figure (a) means that as the amount of good X increases,
The amount of good Y will remain constant, but the consumer will remain
Indifferent among the various combinations.
This cannot be done, because consumers always prefer
A large amount of good to a small amount of its good.
Similarly, the indifference curve cannot be a vertical straight line


 Commodity X Commodity X Commodity X
(a) Horizontal Fig.2.4 (b) Vertical Fig.2.4 (c) Upward Sloping
Indifference Curve Indifference Curve Indifference Curve
A vertical straight line means that while the amount of good y in combination increases the amount of good X remains constant. The third possibility for the curve is to lean upward to the right.
B) Higher indifference curve gives greater level of utility:
As long as marginal utility of a commodity is positive, an individual will always prefer more of that commodity, as more of the commodity will increase the level of satisfaction.
Combination | Quantity of bananas | Quantity mangoes |
A | 1 | 10 |
B | 2 | 10 |
C | 3 | 10 |
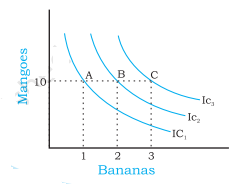
Consider the different combination of bananas and mangoes, A, B and C depicted in table 2.4 and figure 2.7. Combinations A, B and C consist of same quantity of mangoes but different quantities of bananas. Since combination B has more bananas than A, B will provide the individual a higher level of satisfaction than A. Therefore, B will lie on a higher indifference curve than A, depicting higher satisfaction.
Likewise, C has more bananas than B (quantity of mangoes is the same in both B and C). Therefore, C will provide higher level of satisfaction than B, and also lie on a higher indifference curve than B.
A higher indifference curve consisting of combinations with more of mangoes, or more of bananas, or more of both, will represent combinations that give higher level of satisfaction.
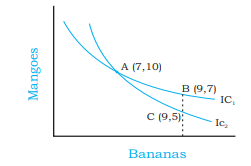
Two indifference curves intersecting each other will lead to conflicting results. To explain this, let us allow two indifference curves to intersect each other as shown in the figure 2.8. As points A and B lie on the same indifference curve IC1, utilities derived from combination A and combination B will give the same level of satisfaction. Similarly, as points A and C lie on the same indifference curve IC2, utility derived from combination A and from combination C will give the same level of satisfaction.
From this, it follows that utility from point B and from point C will also be the same. But this is clearly an absurd result, as on point B, the consumer gets a greater number of mangoes with the same quantity of bananas. So consumer is better off at point B than at point C. Thus, it is clear that intersecting indifference curves will lead to conflicting results. Thus, two indifference curves cannot intersect each other.
Consumer equilibrium:
Indifferent map-shows the scale of consumer preferences between various combinations of two goods.
Budget line-he shows his money income and various combinations that can afford to buy at the price of both goods.
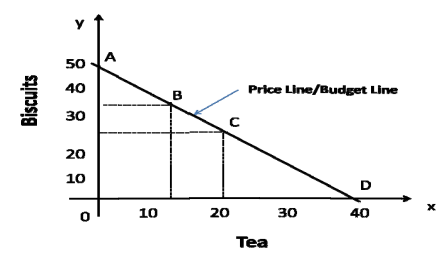
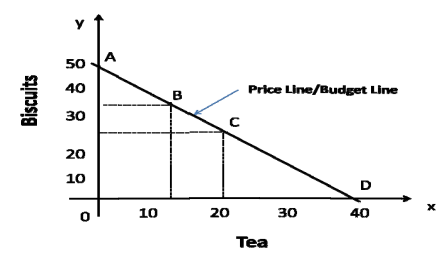
Suppose that the consumer has Rs.20 to spend on tea and biscuits, which cost 50 paise and 40 paise respectively. The consumer has three alternative possibilities before him. ™
a) He may decide to buy tea only, in which case he can buy 40 cups of tea. ™
b) He may decide to buy biscuits only, in which case he can buy 50 biscuits. ™
c) He may decide to buy some quantity of both the goods, say 20 cups of tea (Rs.10) and 25 biscuits (Rs.10) or 12 cups of tea (Rs.6) and 35 biscuits (Rs.14), and so on. (Total amount = Rs.20).
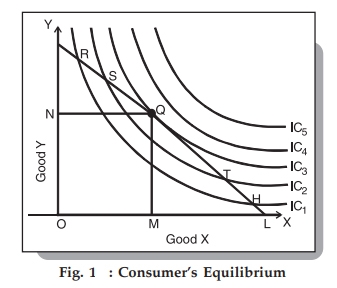
The below figure shows the indifference map with 5 indiscriminate curves (ic1, IC2, IC3, IC4, and IC5) and the budget lines PL for good X and good Y. In order to maximize his level of satisfaction, the consumer tries to reach the highest indifference curve. We assume budget constraints, so he will be forced to stay on the budget line.
So, what kind of combination is it?
Let's say he chose the combination R from the figure. 1, we see that R is on the low indifference curve–IC1. He can easily afford the combination S, Q, or T that is on a high Ic. Even if he chooses the combination H, the argument is similar because H is on the curve IC1.
Next, let's check out the mixture S lying on the curve IC2. Again, he can reach a better level of satisfaction within the budget by choosing the mixture Q lying on IC3–the argument is analogous for the mixture T, since the higher T is also on the curve IC2.
Therefore, we have left the combination Q.
What happens when he chooses the combination Q?
This is the simplest choice because Q is on his budget line and pts puts him on the simplest possible indifference curve, IC3. There are higher curves, IC4 and IC5, but they are over his budget. Thus, he reaches equilibrium at the point Q on the curve IC3.
Note that at this point the budget line PL is bordered by the indifference curve IC3. Also in this position, consumers buy X in OM amount and Y in ON amount.
Since Point Q is tangent, the slope of line PL and curve IC3 is equal at this point. In addition, the slope of the indifference curve shows that the substitution limit rate (MRSxy) of X with respect to Y .
Hence, at the equilibrium point Q,
MRSxy = MUxMUyMUxMUy = PxPy
Also, the slope of the price line (PL) shows the ratio of X and Y prices. Therefore, we can say that the consumer equilibrium is achieved when the price line is bordered by the indifference curve. Alternatively, when the substitution limit rate of goods X and Y is equal to the ratio between the prices of two goods.
Price Effect, Income Effect, Substitution Effect, Price Effect a combination of Income Effect and Substitution Effect
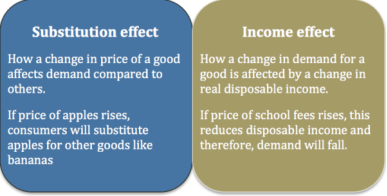
A good increase in prices will then have two different effects–known as profit and alternative effects.
If a good increase in price:
Substitution effect:
It states that the increase in the price of good will encourage consumers to buy alternative goods. The alternative effect measures the amount at which higher prices encourage consumers to buy different goods, assuming the same level of income.
Income effect:
Thus price changes affect the interests of consumers. If prices rise, it will effectively cut disposable income and lower demand for good for disposable income this fall.
For example:
When the price of meat rises, the higher the price, consumers can switch to alternative food sources, such as buying vegetables.
But the higher the price of meat, it means that after buying some meat, they have a lower reserve income. Therefore, consumers buy less meat, but this profit.
If it goes well, it will increase like a diamond an alternative diamond for no substitution effect however, the higher the price of a diamond, the lower the demand due to the income effect.
Income and alternative effects on wages
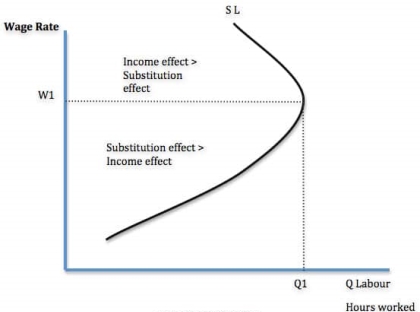
For workers, there is a choice between work and leisure.
When wages rise, work becomes relatively more profitable than leisure time. (Substitution effect)
But with higher wages, he can maintain a decent standard of living through fewer jobs. (Income effect)
The alternative effect of higher pay means workers give up their leisure time to do more hours of work because jobs now have higher rewards.
The income effect of higher wages means that workers spend less time working because they can maintain their target income level in less time.
If the alternative effect is greater than the income effect, people do more work (W1, up to Q1). But we may be at a certain hourly rate where we can afford to work less time. In the figure above, after w1, the income effect is dominant.
It depends on the workers in question. You can enjoy leisure and high-paying jobs. The income effect will soon dominate. If you have a lot of debt and spending commitments, the income effect will take a long time to occur.
Income and alternative effects for interest rates and savings:
Higher interest rates increase income from savings. Thus, this will give consumers more income, which can lead to higher spending (income effect).
Higher interest rates make savings more attractive than consumption and reduce consumer spending (alternative effects).
Key takeaways –
The law of demand states that all other factors remain constant or equal, an increase in the price causes a decrease in the quantity demanded and a decrease in goods or services price leads to increase in the quantity demanded. Thus it expresses an inverse relationship between price and demand.
For example, at Rs 70 per kg consumer may demand 2 kg of apple. On the other hand, the price rises to 100/- per kg then he may demand 1 kg of apple
Assumption of law of demand
Given these assumption, the law of demand is explained in the below table –
Price(rs) | Quantity demanded |
10 | 10 |
8 | 20 |
6 | 30 |
4 | 40 |
2 | 50 |
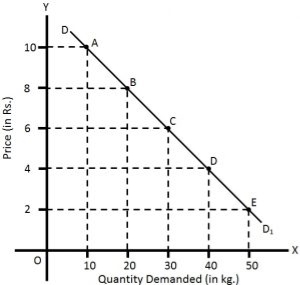
The above table shows that when the price of apple, is Rs. 10 per kg, 10 kg are demanded. If the price falls to Rs.8, the demand increases to 20 kg. Similarly, when the price declines to Rs 2, the demand increases to 50 kg. This indicates the inverse relation between price and demand.
Also, in the above figure the demand curve slopes downwards as the price decreases, the quantity demanded increases.
Exception of law of demand:
Under the following circumstances, consumers buy more when the price of a commodity rises, and less when price falls which leads to upward sloping demand curve.
a) Giffen goods are those products where the demand increases with the increase in price. For example, necessities products like rice, wheat. Lower incomes group will spend less on superior foods (like meat) to buy more rice, wheat etc.
b) In anticipation of war, consumers start buying even when the prices are high due to the fear of shortage.
c) During a depression, the prices of products are low still the demand for those products is also less.
d) the law of demand is not applicable on necessities of life such as food, cloth etc.
Key takeaways –
The law of demand is a fundamental principle of economics which states that at a higher price consumers will demand a lower quantity of a good.
Under law of demand, price falls and demand rises, vice versa. But how much the quantity rise or fall for a given change in price is not determined in law of demand. So the concept of elasticity of demand is derived to know how much quantity demanded changes for a change in the price of goods or services.
“The elasticity (or responsiveness) of demand in a market is great or small according as the amount demanded increases much or little for a given fall in price, and diminishes much or little for a given rise in price”. – Dr. Marshall.
Elasticity means sensitivity of demand to the change in price.
The formula for calculating elasticity of demand is:
EP = proportional changes in quantity demanded/proportional changes in price

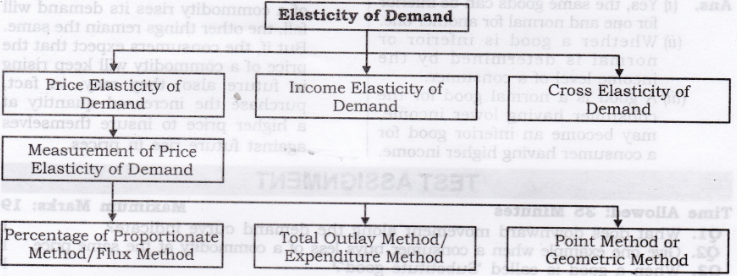
Price, income and cross elasticity-
Price elasticity of demand:
The price of elasticity demand is the change in the quantity demanded to the change in the price of the commodity
Dr Marshall has defined price elasticity of demand as below:
"Price elasticity of demand is a ratio of proportionate changes in the quantity demanded of a commodity to a given proportionate change in its price."
Thus, pride elasticity is responsiveness of change in demand due to a change in price only. Other factors such as income, population, tastes, habits, fashions, prices of substitute and complementary goods are assumed to be constant.
Formula –
Ep = percentage change in quantity demanded/percentage change in price
Types:
There are 5 types of price elasticity of demand given below
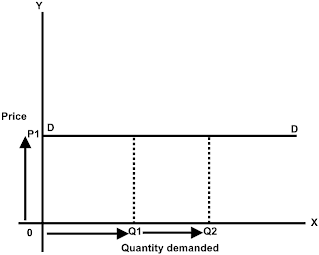
a) A small change in price results to major change in demand is said to be perfectly elastic demand.
b) The demand curve in perfectly elastic demand represent horizontal straight line .
c) Ep = infinity.
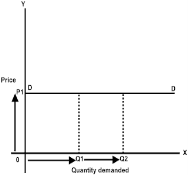
From the above figure, we can see at price P1 consumers are ready to buy as much quantity as they want. A slight increase in price may result to fall in demand to zero.
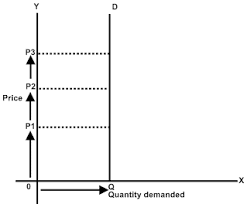
2. Perfectly inelastic demand-
a) When there is no change in the demand of the commodity with the change in price is said to be perfectly inelastic demand.
b) The demand curve in perfectly elastic demand represent Vertical straight line.
c) Ep = zero.


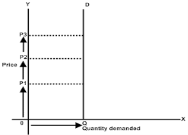
From the above fig, we can see that price is rising from P1 to P2 to P3, but there is no change in the demand. This cannot happen in practical situation. But, in essential goods such as salt, with the change in price the demand does not change.
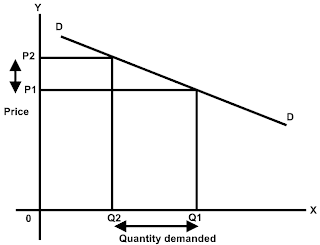
3. Relatively elastic demand-
a) When the proportionate change in demand is greater than the proportionate change in price of a product
b) The value ranges between one to infinity (ep>1)
c) Ex – a smaller change in flight price result in more demand for booking the flight tickets
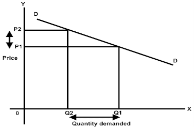

d) From the above figure, it is observed that the percentage change in demand from Q2 to Q1 is larger than the percentage change in price from P2 to P1. Thus the demand curve is gradually sloping downwards.
4. Relatively inelastic demand-
a) When the percentage change in demand is less than the percentage change in price
b) The value ranges between zero to one (ep<1)
c) Ex – cloths, drinks, food, oil , as the change in price does not affect the quantity demanded.

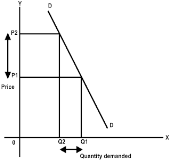
d) From the above figure, it is interpreted that the proportionate change in demand from Q2 to Q1 is less than the proportionate change in price from P2 to P1. Thus, the demand cure rapidly sloping down.
5. Unitary elastic demand-
a) When the percentage change in quantity demanded in equal to the percentage change in price of the commodity.
b) The value is equal to one (ep=1).
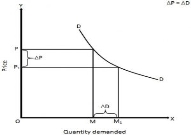
In the above figure we can observe that proportionate change in price from P to P1 cause the same proportionate change in price from M to M1.
Measurements
1. Ratio or Proportional Method
This ratio method of measuring elasticity of demand is also known as Arithmetic or Percentage method. This method is developed by Dr. Marshall. In this method percentage change in quantity demanded and divide it by percentage change in the price of the commodity.
Example
Price of X | Demand (Units) |
200 | 1000 |
100 | 1500 |
In the above table we can see the price of commodity X falls from Rs. 200/- to Rs. 100/- and quantity demanded increases from 1000 units to 1500 units. Here percentage change in demand is 50, whereas percentage change in price is also 50. Therefore, 50%, / 50% = 1, which, means Ed is unitary or one.
2. Total expenditure method –
In this method, statistics of total expenditure is used to find out elasticity of demand. Total expenditure at the original price and total expenditure at the new price is compared with each other, and we come to know the elasticity of demand.
When price falls or rises, total expenditure does not change or remains constant, demand is unitary elastic.
When price falls, total expenditure increases or price rises and total expenditure decreases, demand is elastic or elasticity of demand is greater than one.
Example
Price (Rs.) | Demand (Units) | Total Outlay (Rs.) | Elasticity of Demand | |
A | 10 8 | 12 15 | 120 120 | Unitary or 1 |
B | 10 8 | 12 20 | 120 160 | Elastic or > 1 |
C | 10 8 | 12 14 | 120 112 | Inelastic or < 2 |
3. Point elasticity method –
The price elasticity of demand also be measured at any point on the demand curve. It is noted that demand is unitary at mid point of demand curve that total revenue is maximum at this point. Any point above unitary point shows elasticity is greater than one (means price relation in this point leads to an increase in the total revenue.
Any point below mid point shows elasticity is less than one means price relation in these point lead to reduction in the total revenue.
Income elasticity of demand:
The income elasticity is measures the sensitivity of quantity demanded for a goods or services to a change in consumer’s income
 Formula - Percentage change in the quantity demanded
Percentage change in the consumer’s income
Types
When a proportionate change in the income of a consumer increases the demand for a product and vice versa, income elasticity of demand is said to be positive. In case of normal goods, the income elasticity of demand is generally found positive.

In Figure, DYDY is the curve representing positive income elasticity of demand. The curve is sloping upwards from left to the right, which shows an increase in demand (OQ to OQ1) as a result of rise in income (OB to OA).
2. Negative income elasticity of demand –
When a proportionate change in the income of a consumer results in a fall in the demand for a product and vice versa, income elasticity of demand is said to be negative. In case of inferior goods, the income elasticity of demand is generally found negative.
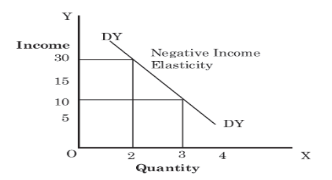
In Figure, DYDY is the curve representing negative income elasticity of demand. The curve is sloping downwards from left to the right, which shows a decrease in the demand as a result of a rise in income. As shown in Figure, with a rise in income from 10 to 30, the demand falls from 3 to 2.
3. Zero income elasticity of demand –
When a proportionate change in the income of a consumer does not bring any change in the demand for a product, income elasticity of demand is said to be zero. It generally occurs for utility goods such as salt, kerosene, electricity.
In Figure, DYDY is the curve representing zero income elasticity of demand. The curve is parallel to Y-axis that shows no change in the demand as a result of a rise in income. As shown in Figure, with a rise of income from 10 to 20, the demand remains the same i.e. 4.
Cross elasticity of demand:
“The cross elasticity of demand is the proportional change in the quantity of X good demanded resulting from a given relative change in the price of a related good Y” Ferguson
It measures the percentage change in the quantity demanded of commodity X to the percentage change in the price of its substitute/complement Y
 Formula – proportionate change in quantity demanded of X
Proportionate change in the price of Y
Types
In the above figure, at price OP of Y-commodity, demand of X-commodity is OM. Now as price of Y commodity increases to OP1 demand of X-commodity increases to OM1 Thus, cross elasticity of demand is positive.
2. Negative - A proportionate increase in price of one commodity leads to a proportionate fall in the demand of another commodity because both are demanded jointly refers to negative cross elasticity of demand.
When the price of commodity increases from OP to OP1 quantity demanded falls from OM to OM1. Thus, cross elasticity of demand is negative.
3. Zero - Cross elasticity of demand is zero when two goods are not related to each other. For instance, increase in price of car does not effect the demand of cloth. Thus, cross elasticity of demand is zero.
Factors influencing the elasticity of demand:
Elasticity of demand depends on many factors-
1. Nature of commodity: Elasticity or in-elasticity of demand depends on the nature of the commodity i.e. whether a commodity is a necessity, comfort or luxury, normally; the demand for Necessaries like salt, rice etc is inelastic. On the other band, the demand for comforts and luxuries is elastic.
2. Availability of substitutes: Elasticity of demand depends on availability or non-availability of substitutes. In case of commodities, which have substitutes, demand is elastic, but in case of commodities, which have no substitutes, demand is in elastic.
3. Variety of uses: If a commodity can be used for several purposes, than it will have elastic demand. i.e. electricity. On the other hand, demanded is inelastic for commodities, which can be put to only one use.
4. Postponement of demand: If the consumption of a commodity can be postponed, than it will have elastic demand. On the contrary, if the demand for a commodity cannot be postpones, than demand is in elastic. The demand for rice or medicine cannot be postponed, while the demand for Cycle or umbrella can be postponed.
5. Amount of money spent: Elasticity of demand depends on the amount of money spent on the commodity. If the consumer spends a smaller for example a consumer spends a little amount on salt and matchboxes. Even when price of salt or matchbox goes up, demanded will not fall. Therefore, demand is in case of clothing a consumer spends a large proportion of his income and an increase in price will reduce his demand for clothing. So the demand is elastic.
6. Time: Elasticity of demand varies with time. Generally, demand is inelastic during short period and elastic during the long period. Demand is inelastic during short period because the consumers do not have enough time to know about the change is price. Even if they are aware of the price change, they may not immediately switch over to a new commodity, as they are accustomed to the old commodity.
7. Range of Prices: Range of prices exerts an important influence on elasticity of demand. At a very high price, demand is inelastic because a slight fall in price will not induce the people buy more. Similarly at a low price also demand is inelastic. This is because at a low price all those who want to buy the commodity would have bought it and a further fall in price will not increase the demand. Therefore, elasticity is low at very him and very low prices.
Importance of elasticity of demand:
1. Price fixation: Each seller under monopoly and imperfect competition has to take into account elasticity of demand while fixing the price for his product. If the demand for the product is inelastic, he can fix a higher price.
2. Production: Producers generally decide their production level on the basis of demand for the product. Hence elasticity of demand helps the producers to take correct decision regarding the level of cut put to be produced.
3. Distribution: Elasticity of demand also helps in the determination of rewards for factors of production. For example, if the demand for labour is inelastic, trade unions will be successful in raising wages. It is applicable to other factors of production.
4. International Trade: Elasticity of demand helps in finding out the terms of trade between two countries. Terms of trade refers to the rate at which domestic commodity is exchanged for foreign commodities. Terms of trade depends upon the elasticity of demand of the two countries for each other goods.
5. Public Finance: Elasticity of demand helps the government in formulating tax policies. For example, for imposing tax on a commodity, the Finance Minister has to take into account the elasticity of demand.
6. Nationalization: The concept of elasticity of demand enables the government to decide about nationalization of industries.
Key takeaways-
References