Unit-3
Economic Development
Introduction to the Harrod-Domar Economic Growth Model:
Interest in the problems of economic growth has prompted economists to develop a variety of growth models since the end of WWII.
These models address and emphasise the various aspects of developed economies' development. They are, in a sense, alternate stylized depictions of a growing economy.
They all have one thing in common: they're all focused on Keynesian saving-investment research. The Harrod-Domar Model, the first and most basic model of development, is the direct result of projecting short-run Keynesian analysis into the long-run.
This model assumes that capital is the most important factor in economic development. It focuses on the probability of steady growth through capital supply and demand adjustments. Mrs. Joan Robinson's model, on the other hand, recognises technological development, as well as capital accumulation, as a source of economic growth. The neoclassical growth model is the third form of growth model.
It implies that capital and labour are substituted, and that technological innovation is neutral in the sense that it neither saves nor absorbs labour or capital. And when neutral technical is used, both variables are used in the same proportion. Here, we'll look at some of the more well-known growth models.
Although the Harrod and Domar models vary in certain details, they are fundamentally the same. Harrod's model may be considered the English equivalent of Domar's model. Both of these models emphasise the importance of achieving and sustaining consistent development. Capital accumulation plays a critical role in the growth process, according to Harrod and Domar. In reality, they emphasise capital accumulation's dual function. New expenditure, on the one hand, produces revenue (due to the multiplier effect); on the other hand, it expands the economy's productive potential (due to the efficiency effect) by increasing its capital stock. It's worth noting that classical economics placed a premium on the investment's efficiency while ignoring the income factor. Keynes had paid close attention to the issue of income generation but had overlooked the issue of increasing productive ability. Harrod and Domar took great care to address both of the issues that arise as a result of investment in their models.
General Assumptions:
The following are the core assumptions of the Harrod-Domar models:
(i) There is already a full-employment standard of wages.
(ii) The government should not intervene with the economy's operation.
(iii) The model is based on the “closed economy” premise. To put it another way, government trade sanctions and the problems that come with foreign trade are ruled out.
(iv) There are no lags in variable change, i.e., economic variables such as savings, investment, revenue, and expenditure all adjust in the same amount of time.
(v) The marginal propensity to save (MPS) and the average propensity to save (APS) are equivalent. S/Y=S/Y (vi) Both the tendency to save and the “capital coefficient” (i.e., capital-output ratio) are given constant values. Since the capita-output ratio is fixed, this amounts to assuming that the law of constant returns operates in the economy.
(vii) Income, expenditure, and savings are all represented in a net sense, that is, they are taken into account after depreciation. As a result, depreciation rates are excluded from these factors.
(viii) Saving and investment are equal in ex-ante and ex-post senses, i.e., accounting and practical equality exists between saving and investment. These assumptions were made to make growth analysis easier.
Harrod's expansion strategy posed three issues:
(i) How can an economy with a fixed (capital-output ratio) (capital-coefficient) and a fixed saving-income ratio achieve steady growth?
(ii) How can the constant rate of growth be maintained? Or, to put it another way, what are the requirements for continuing to expand at a steady rate?
(iii) How do natural forces impose a limit on the economy's growth rate? Harrod had introduced three separate growth rate principles in order to address these issues: I G, the real growth rate; (ii) Gw, the warranted growth rate (iii) the natural growth rate, Gn.
The Actual Growth Rate is the rate of growth dictated by the country's actual savings and expenditure rates. In other words, it can be defined as the ratio of change in income (AT) to the total income (Y) in the given period. G = Y/Y if real growth rate is denoted by G.
The saving-income ratio and the capital-output ratio decide the real growth rate (G). Both variables have been assumed to be constant over the time span. The following is the relationship between the real growth rate and its determinants:
GC = s …(1)

Because

Substituting value of G, C and s in the equation (1), we get,
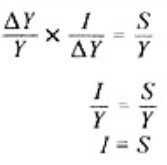
This relationship explains that ex-post savings must be equivalent to ex-post investment in order to achieve steady state growth. The term "warranted acceleration" refers to the economy's growth rate when it is operating at full capacity. Full-capacity growth rate is another name for it. This Gw growth rate is described as the rate of income growth needed to fully utilise an increasing stock of capital, allowing entrepreneurs to be comfortable with the amount of investment actually produced. Warranted growth rate (Gw) is determined by capital-output ratio and saving- income ratio. The relationship between the warranted growth rate and its determinants can be expressed as
Gw Cr = s
where Cr denotes the necessary C to keep the warranted growth rate, and s denotes the saving-to-income ratio.
Let us now look at the topic of how to achieve consistent growth. According to Harrod, the economy would be able to maintain steady growth if
G = Gw and C = Cr
First and foremost, the real growth rate must be equal to the warranted growth rate. Second, considering the saving co-efficient, the capital-output ratio required to achieve G must be equal to the capital-output ratio required to sustain Gw (s). This means that at the given saving rate, real investment must be equal to planned investment.
Instability Growth:
As previously noted, steady-state economic growth necessitates equality between G and Gw on the one hand, and C and Cr on the other. These equilibrium conditions will be met only seldom, if at all, in a free-enterprise economy. As a result, Harrod looked at what happens when these criteria aren't met.

We investigate the case where G is greater than Gw. As the rate of growth of income exceeds the rate of growth of production, the demand for output (due to the higher level of income) exceeds the availability of output (due to the lower level of output), and the economy experiences inflation. When C Cr, this can also be clarified in another way. The actual amount of capital falls short of the necessary amount of capital in this case.
This would result in a capital shortage, which would have a negative impact on the amount of goods produced. A drop in production would result in a shortage of commodities and, as a result, inflation. The economy would be trapped in a quagmire of inflation as a result of this situation.
When G is less than Gw, however, the growth rate of income is lower than the growth rate of production. There would be an abundance of goods for sale in this case, but the revenue would not be sufficient to buy them. In Keynesian terms, there would be a demand deficit, and the economy would experience deflation as a result. When C is greater than Cr, this condition can also be clarified.
The real amount of capital will be greater than the amount of capital available for investment in this case. In the long run, the increased amount of capital available for investment will reduce capital's marginal efficiency. Chronic depression and unemployment will result from a long-term decline in capital's marginal productivity. This is what secular stagnation looks like.
It can be inferred from the above study that steady growth implies a balance between G and Gw. It is difficult to strike a balance between G and Gw in a free-enterprise economy since the two are decided by entirely different sets of variables. Knife-edge equilibrium is named so because a small deviation of G from Gw takes the economy away from the steady-state growth direction.
Natural factors such as labour force, natural resources, capital equipment, technological skills, and so on decide Gn, or natural growth rate. These variables impose a cap on the amount of production that can be increased. The Full-Employment Ceiling is the name given to this cap. This upper limit can shift as the production factors improve or as technology advances. As a result, the natural growth rate is the highest rate of growth that an economy can achieve for its natural capital. The third fundamental relation in Harrod's model of natural growth rate determinants is GnCr, which is either = or s.
Interaction of G, Gw and Gn: nb
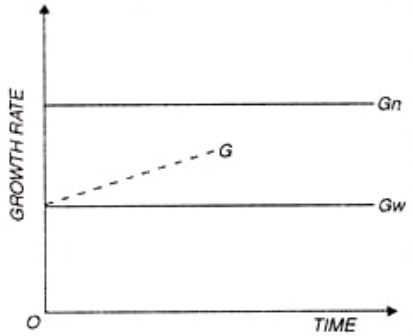
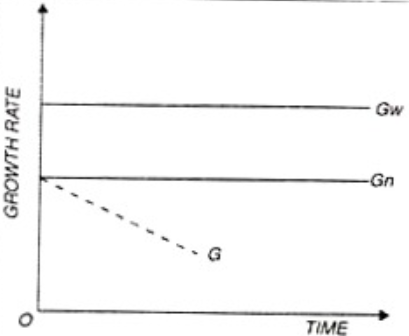
When we compare the second and third relationships between the warranted growth rate and the normal growth rate, we can see that Gn can or may not be equal to Gw. If G„ equals Gw, the conditions for steady growth and full employment are met. However, such a scenario is unlikely since a number of obstacles are likely to arise, making balancing both of these variables challenging. As a result, there is a distinct probability of Gn and Gw being unequal. If G„ exceeds Gw for the majority of the time, G would also surpass Gw for the majority of the time, as shown in Figure 17.1, and the economy would trend toward cumulative boom and full jobs.
An inflationary pattern will emerge as a result of this scenario. Savings become attractive to counteract this trend because they enable the economy to maintain a high level of jobs while avoiding inflationary pressures. If, on the other hand, Gw exceeds G„, G must be below G„ for the majority of the time, resulting in a cumulative recession and unemployment.
The Domar Model:
Domar's key growth model resembles Harrod's in several ways. In reality, Harrod saw Domar's formulation as a seven-year-long rediscovery of his own edition.
Domar's theory was merely a continuation of Keynes' General Theory on two counts:
1. Investment has two effects:
(a) An income-generating effect; (b) A capacity-building effect that increases productivity.
The second effect was overlooked by Keynes' short-run review.
2. While unemployment in the labour market draws attention and elicits sympathy, unemployment in the capital market receives little attention. It's important to remember that capital unemployment prevents investment and, as a result, lowers wages. Reduced income leads to a decrease in demand and, as a result, unemployment. As a result, the Keynesian view of unemployment overlooks the underlying cause of the issue. Domar tried to look at the origins of unemployment from a broader perspective.
To grasp the Domar model's consequences, familiarise yourself with the following relationships:
Y(t) = I(t)/s
where Y represents the production, I represents the actual investment, s represents the saving-income ratio (saving propensity), and t represents the time span.
2. Investment creates productive power to the degree that the potential (social) average output of investment is denoted by a. This is often believed to be constant for the sake of convenience. The relationship can be written in notation as
Y(t) –Y(t-1)= I(t)/α
where an is the real marginal capital-production ratio, which is the reciprocal of "potential social average investment efficiency" (= 1/), and Y is the productive capacity for output. As a result, Equation (2) can also be written as Yt = It. The product of capital productivity () and expenditure is the shift in productive potential, as shown in this equation. As a result, the efficiency effect is shown.
3. Production growth and entrepreneurial optimism both encourage investment. Junking, or the untimely loss of capital value due to the unprofitable operation of older facilities, has a negative impact on the latter. This may be due to a labour shortage, the development of new products, or the invention of labor-saving devices. The relationship demonstrates this presumption.

where G is a decreasing function of the “Junking ratio” d but an increasing function of the rate of performance acceleration (t).
When the junking ratio is zero, investment grows at the same rate as output. The ‘utilisation ratio,' which is defined as the ratio of actual production to productive capacity, determines employment. It can be stated as follows:
4. Jobs is denoted by the letter A, and the labour force is denoted by the letter L. (I) is the time span, II is the job coefficient, Yd is the actual production, and Yd is the productive potential. The job to labour force ratio is calculated by the employment coefficient (II) and the production to productivity ratio, according to this equation. The dots show the presence of other factors that influence the job ratio. If we conclude that the job coefficient is equal to one, (i.e., H = I), then Yd(t) = Ys(t)
5. At a given ratio, both past and current investment will generate productive potential. However, due to management blunders, new construction schemes will hasten the death of existing projects and plants. If "junking" happens, it will reduce investment efficiency. The fundamental assumption of Doinar's model is this assumption. It can be expressed as follows in notations:

where K stands for cash, / for savings, and d for depreciation (t). The sum of capital that has been junked is K(t), and the junking ratio is d(t).
Domar looked at growth on both the demand and supply sides. On the one hand, investment increases productive potential while still generating revenue. The solution for steady growth is to balance the two sides. In Domar's model, the following symbols are used.
Yd = level of net national income or level of effective demand at full employment (demand side)
Ys = level of productive capacity or supply at full-employment level (supply side)
K = real capital
I = net investment which results in the increase of real capital i.e., ∆K a = marginal propensity to save, which is the reciprocal of multiplier. a = (sigma) is productivity of capital or of net investment.
The following relationship summarises the demand side of the long-term impact of investment. This is a straightforward Keynesian investment multiplier application.
Yd = 1/a . I
This relationship tells us (I) that the level of successful demand (Yd) is directly related to the level of investment through a multiplier equal to 1/. Any rise in investment would increase effective demand in a direct manner, and vice versa. (ii) The marginal tendency to save is inversely related to successful demand (a). Any rise in the marginal tendency to save (a) reduces effective demand, and vice versa.
In the Domar model, the supply side of the economy is represented by the relationship.
Ys = σK
This relationship describes how, at full employment, the availability of production(Ys) is determined by two factors: the productive potential of capital () and the sum of actual capital (). (K). The supply of output will change if one of these two variables increases or decreases. If capital productivity () rises, this will have a positive impact on the economy's supply. The effect of a shift in the real capital K on production supply is similar.
The demand Yd and supply Ys sides of the economy should be comparable for long-term equilibrium. As a result, we can write:
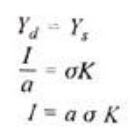
This relationship states that when investment equals the product of the saving-income ratio, capital productivity, and capital stock over time, steady growth is possible.
The demand and supply equations can be written in incremental form as follows: The demand side is as follows:
∆Yd =∆I/α …(1)
However, since the increment is a constant in terms of the assumptions, it has not been shown in a. Since 1/ equals a and I equals K, we may write the supply relationship as follows:
∆Ys = σ ∆K
This equation shows that a change in production supply (Ys) can be expressed as the product of real capital change (K) and capital productivity (). We get the supply side of the economy by substituting the value of K for I in the above equation.
∆Ys= σ I …(1)
We may derive the condition for steady growth from equations (1) and (2). We get by combining equations (1) and (2).

And by multiplying by two, we get,
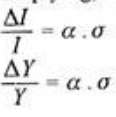
According to Equation (3), the income growth rate Y/Y should be equal to the product of marginal propensity to save () and capital productivity () if steady growth is to be sustained. If a growing economy with an expanding stock of capital is to sustain continuous full employment, an increase in productive capacity (Ys) due to an increase in real capital (C) must be balanced by an equivalent increase in effective demand (Yd) due to an increase in investment (I).
A numerical illustration can be used to illustrate Domar's steady state growth condition. If capital efficiency () is 25% and the marginal propensity to save is 12%, the growth rate of investment (AHI) is equivalent to a, a, i.e.

2. Analysis of disequilibrium:
Disequilibrium (a state of non-stability) reigns supreme.
Long-term inflation will emerge in the economy in the first scenario, because the higher rate of income growth would bring greater buying power to the population, and the productive capacity () would be unable to cope with the increased level of income. As a result of the first state of disequilibrium, the economy will experience inflation.
Overproduction would result in the second scenario, in which the rate of growth of income or expenditure lags behind the productive potential. The people's buying power would be limited as a result of the lower growth rate of wages, lowering demand and resulting in overproduction. This is the condition in which secular stagnation will occur. As a result, we've arrived at the same conclusion about stendy growth instability that we got from the Harrod model.
Summary of Main Points:
The following are the key points of the Harrod-Domar analysis:
1. Investment is the most important variable in achieving steady growth because it serves a dual purpose: it produces revenue while also creating productive potential.
2. Depending on how income behaves, increased ability from investment will result in higher production or higher unemployment.
3. Income behaviour can be expressed in terms of growth rates, such as G, Gw, and Gn, with equality between the three growth rates ensuring full employment of labour and full utilisation of capital stock.
4. These conditions, on the other hand, only define steady-state growth. The actual rate of growth may vary from the forecasted rate. The economy would experience accumulated inflation if the real growth rate exceeds the warranted rate of growth. The economy would slide into cumulative inflation if the real growth rate is lower than the warranted growth rate. The economy would slide into accumulated deflation if the real growth rate is lower than the warranted growth rate.
5. Business cycles are seen as detours from a steady growth direction. These alterations aren't going to work forever. Upper and lower limits constrain these; the ‘full employment ceiling' serves as an upper limit, while effective demand, which includes autonomous expenditure and consumption, serves as a lower limit. Under these two thresholds, the real growth rate fluctuates.
The horizontal axis represents profits, while the vertical axis represents savings and investment. The line S(Y) drawn through the origin depicts the levels of saving that correspond to various income levels. The average and median tendency to save is measured by the slope of this line (tangent). The acceleration co-efficient v, which remains constant at each income level of Y0, Y1, and Y2, is calculated by the slopes of lines Y0I0, Y1I1, and Y2I2.
The saving is S0Y0 at an initial income level of Y0. When this money is put to use, the income jumps from Y0 to Y1. Savings rise to S1Y1 as a result of the higher wages. When this sum of money is saved and reinvested, the percentage of income rises to Y2. Savings would rise to S2Y2 as a result of the higher wages. The acceleration effect on production growth can be seen in this phase of rising wages, saving, and expenditure.
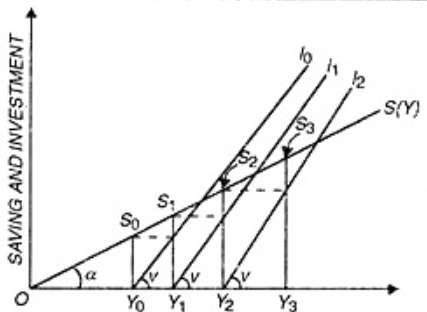
Fig 2
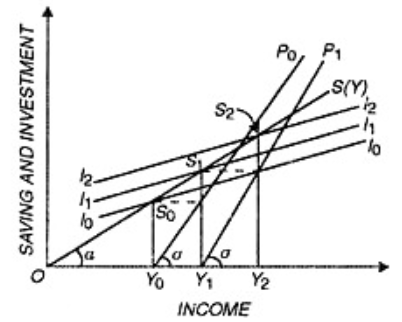
Fig 3
With the help of Figure 3, we now present a diagrammatic presentation of the Harrod model.
The horizontal axis represents profits, while the vertical axis represents saving and expenditure. The line S(Y) that passes through the origin represents the amount of saving that corresponds to various income levels. The different levels of investment are I0I0, I1I1, and I2I2. The capital efficiency indices Y0P0 and Y1P1 correspond to different levels of investment.
The lines Y0P0 and Y1P1 are drawn parallel to indicate that capital efficiency remains constant. The powers of saving and spending are shown in this diagram to decide the amount of income. The intersection of the saving line S(Y) and the investment line I0I0 determines the degree of income Y0.
The saving is Y0S0 at the income level Y0. When the Y0S0 saved is spent, the income level rises from OY0 to OY1. As a result, the productive potential will increase as well. The magnitude of the increase in income is determined by capital productivity, which is calculated by the slope of the line Y0P0 ().
The higher the level of income, the greater the potential for production. Similarly, when the revenue level is OY1, the saving level is S1Y1. With an S1Y1 investment, income will grow to a level of Y2. This rise in wages translates to an increase in the economy's buying power. However, the capital productivity coefficient will remain constant, which is a key assumption in Domar's model.
Key takeaway:
The Schumpeter model of economic growth moves round the inventions and innovations. This model is explained with the followings:
(1) Production Process, (2) Dynamic Analysis of the Economy, (3) Growth Trends, and (4) Capitalism's Demise
Production Process in the Schumpeter Model:
The development process depicts the interaction of productive forces that result in the creation of products. Material and immaterial influences combine to shape these active forces. Land, labour, and resources are physical or material factors, while technological facts and social structure are non-physical or immaterial factors.
As a result, the Schumpeter output structure is as follows:

Where Y denotes economic growth, K denotes generated means of production, L denotes labour, N denotes natural resources, S denotes technology, and U denotes social set-up or social organisation.
By dividing the total differential of the output function by dt.

The rate of change of productive forces (dK/dt, dN/dt, dL/dt), the rate of change of technology (dS/dt), and the rate of change of social set-up (dU/dt) are all factors in the economy's productivity.
2. Dynamic Evaluation of Economy in Schumpeter Model:
We present two forms of effects in the context of complex economic analysis.
(i)The results of changes in output factors such as K, L, and N, which he refers to as "Growth Components."
(ii) The effects of technological and social change, which he refers to as "Evolution Components," as well as the effects of changes in S and U. He leaves the land as it is in terms of development components. Assume that dN/dt = 0. The remaining two factors are the shift in population (dL/dt) and the change in output means (dK/dt). dL/dt: He considers population to be an exogenous variable. In other words, population in the economy is determined by exogenous factors. He goes on to claim that population growth is a slow and steady process with few sharp fluctuations. As a result, the population function will be L = f. (t).
dK/dt: According to Schumpeter, the shift in capital goods or manufactured means of production is determined by savings. Savings, on the other hand, are determined by the benefit rate. However, profits cannot be obtained without growth, and development cannot be achieved without profits. According to him, a product's worth is equal to its costs due to the circular flow of NI. Profits would not be accrued in this manner. However, according to Schumpeter, as new techniques are implemented, they will produce profits. It means that in a capitalist society, profits are determined by technological advancements. In other words, improvements in applied technological expertise affect the stock of resources. It's as follows:
dK/dt = k (dS/dt)
This demonstrates how, in Schumpeter's model, capital accumulation is linked to technological changes. The accumulation of capital increases as technological advances increase.
In terms of institutional and social shifts, dU/dt According to Schumpeter, it is a complicated situation that is linked to a country's social, psychological, technical, and political environment. As a result, it is as follows:
dU/dt = u (K, L, N, S, U)
As a result, we can see that in Schumpeter's model, changes in the economy's productivity are influenced by technological change and the socio-cultural setting of the economy.
3. Role of Technology in Development:
Now we'll talk about the effect of technology on economic growth. Economic growth, according to Schumpeter, is the product of discontinuous technological shifts. According to him, economic growth can be triggered by five separate events, including:
The introduction of a new product, (ii) the introduction of a new manufacturing process, (iii) the discovery of a new market, (iv) the discovery of a new source of supply, and (v) a shift in the structure and organisation of a particular industry.
As a result of these changes, the absorption of production factors changes.
4. Role of Entrepreneurs in Development:
'Entrepreneur,' according to Schumpeter, is a factor of production that incorporates new combinations of factors of production. He is neither a technician nor a financial controller. He just comes up with new ideas and inventions. He creates innovations for the purpose of creating inventions. He is, however, motivated by the need for benefit as well as the socio-cultural structure of society. The entrepreneur needs two things in order to carry out his economic functions:
(i) He must possess technological skills in order to manufacture new products.
(ii) He would have no trouble obtaining the money. Credit plays a significant role in this regard. An entrepreneur gains control over output factors as a result of credit. Credit does, in the short term, trigger inflation in the economy, but it also stimulates developments and innovations.
According to the above discussion, economic growth in the Schumpeter model is dependent on the economy's technical and technological conditions. The activities of entrepreneurs are dependent on the entry of new entrepreneurs and the development of credit, while technological advances are dependent on the activities of entrepreneurs.
Trends of Growth in Schumpeter Model:
Capitalistic economies, according to Schumpeter, are characterised by cyclical cycles, or booms and depressions. When a new technique of manufacturing or a new product is introduced to the market, the entrepreneur or entrepreneurs who invented it make a lot of money. After a period of time, other companies begin to manufacture the same product. As a result, the market's stock of that commodity rises. As a result, the economy will see a rise in wages and job opportunities. However, since there are so many commodities on the market, prices are falling, causing an economic downturn. In such a scenario, new entrepreneurs will emerge who will develop new manufacturing processes or products. This will result in an economic revival, followed by a boom, and eventually, the economy will enter a boom period. As a result, technologies and developments, according to Schumpeter, are responsible for trade cycles in capitalistic economies.
Prediction on Decline of Capitalism:
Like Karl Marx, Schumpeter believes that capitalism will finally come to an end and be replaced by Socialism.
He makes the following points in this regard:
(i) As capitalism progresses, entrepreneurs and their manufacturing processes will become obsolete. In lieu of entrepreneurs, salaried administrators would be in charge of industrial units.
(ii) On the one hand, technological advancements generate economies. On the other hand, as the manufacturing network expands in tandem with capitalism's rise, labour unions and other bargaining practises will thrive.
(iii) 'Liberalism' will evolve in tandem with capitalism's expansion. The system of 'Monarchy' would be weakened as a result of this. The ruling class would become poorer, reliant on the civil and military bureaucracies. Unrest can grow in society as a result of this.
(iv) Emaciation and women's rights would be promoted by patriarchy. It will cause havoc in the home.
(v) The freedom to speak and write is guaranteed by capitalism. In teahouses, parks, hotels, and journals and newspapers, people will express their frustration with capitalism.
As a result, capitalism will eventually give way to socialism. As a result, according to Schumpeter, capitalism would "Self-Destruct."
Criticism:
(i) The 'Inventor and Innovator' has been designated as a 'Ideal Man' in the Schumpeter Model. Inventions and improvements, on the other hand, are now regular practises of industrial concerns. Economic fluctuations, according to Schumpeter, are caused by inventions and developments. However, this is not the case. They emerge as a result of monetary and fiscal policies, as well as market preferences and psychological behaviour.
Again, in terms of economic growth, Schumpeter places a premium on technologies and innovations. However, innovations cannot be produced in Pakistan or other countries where funds and resources are scarce.
(ii) For the sake of inventions, Schumpeter relies on credit production. However, it is countered by the argument that, in the short term, bank credit may be beneficial to industrial growth. However, in the long run, bank loans would be insufficient to fund such growth. In such a scenario, economic growth would be contingent on the selling of shares, among other things.
(iii) It is incorrect, according to Meir and Baldwin, to assume that society will inevitably shift toward socialism. Europe and America, when analysed as capitalist nations, have a higher level of industrial growth. They have the freedom to express themselves verbally and in writing. However, no viable option for a rich capitalist country to convert to socialism has emerged to date. Following the disintegration of the Soviet Union, the socialist countries have begun to turn themselves into 'Market Economies.'
Schumpeter's Model and UDCs:
(i)Schumpeter's model is based on the specific social and economic system that existed in Europe and the United States during the 18th and 19th centuries. However, in the case of Pakistan, as in other developing countries, such a paradigm is less applicable. Our socioeconomic system is not the same as theirs. We lack the required prerequisites for development.
(ii) The Schumpeterian model is built on the concept of 'Entrepreneurs.' However, there is a scarcity of these individuals in UDCs. Profit margins are poor in this region. The state of technology is deplorable. As a result, the need to invent and reinvent is still lacking. In addition, a shortage of funding, inadequate transportation, and testing facilities deter future entrepreneurs.
(iii) Governments control a large number of projects in UDCs; since they have low earnings, the costs are higher; and they are managed by bureaucrats and managers who seldom participate in inventions and developments.
(iv)There are numerous economic and non-economic factors that influence economic growth. Schumpeter, on the other hand, associates economic growth solely with inventions and technologies.
(v) Rather than inventing, entrepreneurs in UDCs follow and copy strategies and goods that have become obsolete in DCs.
(vi) According to Schumpeter, an economy's internal circumstances would drive economic growth. However, UDCs are surrounded by centuries of sufferings, difficulties, anguish, rituals, practises, and development techniques, among other things. In such a case, Schumpeter's model would be made ineffective.
(vii) Population development is a major concern in UDCs. The effects of population growth are often distorted. What would Schumpeter's inventions do in such a situation?
(viii) For economic growth, Schumpeter relies on 'Credit.' However, in UDCs where demand cannot be increased, inflation will rise, halting the growth process.
Balanced and unbalanced development.
After objectively examining the comparative study of balanced and unbalanced growth strategies, the logical question is: which of these two strategies stimulates economic growth more effectively?
The neutral and objective opinion is that a discussion on the controversy is unnecessary.
It is based entirely on scientific evidence and political inspiration. Though Paul Streeten claims that the option between balanced and unbalanced growth can be reformulated.
However, according to Ashok Mathur, "balanced and unbalanced growth should not be mutually exclusive, and an optimal development plan can combine certain elements of both balance and unbalance."
Both theories are based on the Big Push principle, which calls for investment to break the poverty cycle. Balanced growth tends to improve all sectors at the same time, while unbalanced growth suggests that investments should be made only in the economy's leading sectors.
Underdeveloped countries lack the human, material, and financial capital to invest in a variety of complementary industries at the same time. New investment opportunities arise as a result of investments made in specific sectors. Through sustaining tensions and disproportions, the aim is to keep the disequilibrium alive rather than to destroy it.
Unbalanced growth implies the formation of disharmony, inconsistency, and disequilibrium, while balanced growth strives for peace, consistency, and equilibrium. The introduction of sustainable growth necessitates a significant investment of resources.
Unbalanced growth, on the other hand, necessitates a smaller amount of capital, as it focuses on only the most profitable sectors. Balanced growth is a long-term strategy since the expansion of all economic sectors is only feasible over time. Unbalanced development, on the other hand, is a short-term strategy because only a few leading sectors can develop in a short period of time.
The doctrines of balanced and unbalanced growth have two common issues relating to the position of the state and the role of supply constraints and inelastic supply. In underdeveloped nations, private industry is only capable of making investment decisions. As a result, healthy development necessitates forethought. States play a leading role in promoting SOC investments in an unbalanced growth plan, generating disequilibrium.
If growth begins with DPA investment, political pressures push the government to invest in SOC. The lack of demand is the primary concern of the balanced growth theory, which ignores the position of supply constraints.
This is not true since underdeveloped countries lack access to finance, expertise, infrastructure, and other inelastic resources. Similarly, the unbalanced growth doctrine overlooks the importance of supply constraints and supply elasticity. In such circumstances, a careful balance must be struck between the benefits of balanced and unbalanced growth.
There is no doubt that developing countries are committed to democracy and should strive to manage the twin evils of inflation and a negative balance of payments when implementing any economic growth strategy.
It is imperative that something be done to strengthen and vigorize the doctrine's effectiveness as a tool for economic growth.
“From the debate, we can now understand that the phrases balanced growth and unbalanced growth initially caught on too readily, and that each solution has been overdrawn,” Prof. Meier correctly observes. After much deliberation, each solution has become so highly qualified that the debate has effectively died out.
Rather than attempting to generalise either method, we should focus on the circumstances under which each can be considered legitimate. Although a newly developed country should strive for balance in an investment criterion, this goal can most likely be achieved only by initially pursuing an unbalanced investment policy.”
Key takeaway:
References-