UNIT 6
Index numbers
The value of money does not remain same over the time. A rise in the price levels means a fall in the value of money and a fall in the price level means a rise in the value of money. Thus index number is a statistical device that measures the relative change in the level of price from one time period to another.
Definition
“Index numbers are quantitative measures of growth of prices, production, inventory and other quantities of economic interest” ………Ronold
An index number measures how much a variable changes over the time. Index number is calculated by finding the ratio of current value to a base value.
Features of index number
- Index numbers are specialized averages.
- Index numbers measures the change in one variable or a group of variable
- Index numbers measures the effect of changes over a period of time.
- Index numbers are meant to study the changes in the effects of such factors which cannot be measured directly
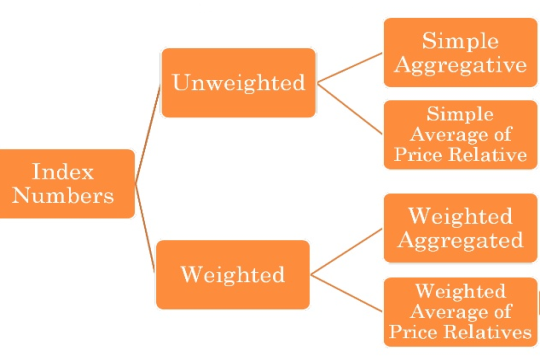
- Simple aggregative method – in this method, the index number is equal to the sum of prices in the current year as a percentage of the sum of prices in the base year.
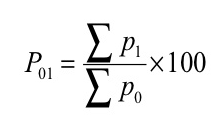
Where, P01 = Index number
P 1= Total of the current year’s prices of all commodities
P 0= Total of the base year’s prices of all commodities
Examples 1–
Commodity | Price in base year 2005 | Price in current year 2010 |
A | 10 | 20 |
B | 15 | 25 |
C | 40 | 60 |
D | 25 | 40 |
Solution
Commodity | Price in base year 2005 | Price in current year 2010 |
A | 10 | 20 |
B | 15 | 25 |
C | 40 | 60 |
D | 25 | 40 |
|  |  |
Index number ( P01 ) = 
P01 = (145/90)*100 = 161.11
It means the price in 2010 were 61% more than the price in 2005
Example 2
Find the index number from the data given below
Commodities | Units | Price in 2007 | Price in 2008 |
Sugar | Quintal | 2200 | 3200 |
Milk | Quintal | 18 | 20 |
Oil | Liter | 68 | 71 |
Wheat | Quintal | 900 | 1000 |
Clothing | Meter | 50 | 60 |
|
|
|
|
Solution
Commodities | Units | Price in 2007 | Price in 2008 |
Sugar | Quintal | 2200 | 3200 |
Milk | Quintal | 18 | 20 |
Oil | Liter | 68 | 71 |
Wheat | Quintal | 900 | 1000 |
Clothing | Meter | 50 | 60 |
|
|  |  |
Index number ( P01 ) = 
P01 = (4351/3236)*100 = 134.45
It means the price in 2008 were 34% more than the price in 2007
Example 3 –
Construct the price index for 2003, taking the year 2000 as base year
Commodities | Price in 2000 | Price in 2003 |
A | 60 | 80 |
B | 50 | 60 |
C | 70 | 100 |
D | 120 | 160 |
E | 100 | 150 |
|
|
|
Solution
Commodities | Price in 2000 - P 0 | Price in 2003 - P 1 |
A | 60 | 80 |
B | 50 | 60 |
C | 70 | 100 |
D | 120 | 160 |
E | 100 | 150 |
|  |  |
Index number ( P01 ) = 
P01 = (550/400)*100 = 137.5
Therefore there is an increase of 37.5% in the prices in 2003 as against 2000.
Example 4-
Compute the price index for the years 2001, 2002, 2003, 2004 taking 2000 as base year
Year | 2000 | 2001 | 2002 | 2003 | 2004 |
Price | 120 | 144 | 168 | 204 | 216 |
Solution
Price index for different years
2000 | (120/120)*100 = 100 |
2001 | (144/120)*100 = 120 |
2002 | (168/120)*100 = 140 |
2003 | (204/120)*100 = 170 |
2004 | (216/120)*100 = 180 |
Example 5 –
Prepare simple aggregative price index
Commodities | Price in 1995 - P 0 | Price in 2003 - P 1 |
Wheat | 100 | 140 |
Rice | 200 | 250 |
Pulses | 250 | 350 |
Sugar | 14 | 20 |
Oil | 40 | 50 |
Solution
Commodities | Price in 1995 - P 0 | Price in 2003 - P 1 |
Wheat | 100 | 140 |
Rice | 200 | 250 |
Pulses | 250 | 350 |
Sugar | 14 | 20 |
Oil | 40 | 50 |
|  |  |
Simple aggregative index number = (810/604)*100 = 134.1
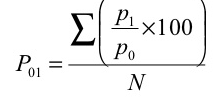
2. Simple average of relative method - in this method, index number is equal to the sum of price relatives divided by the number of items.
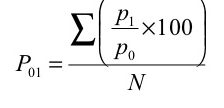
Where, N= number of items
Example 1 –
Commodity | Base year | Current year |
A | 10 | 20 |
B | 15 | 25 |
C | 40 | 60 |
D | 25 | 40 |
|
|
|
Solution
Commodity | Base year | Current year | Price relatives |
A | 10 | 20 | (20/10)*100 = 200 |
B | 15 | 25 | (25/15)*100 =166.7 |
C | 40 | 60 | (60/40)*100 =150 |
D | 25 | 40 | (40/25)*100 =160 |
N = 4 |
|
|  |
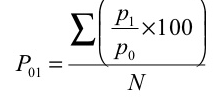
Index number = 676.7/4 = 169.2
Example 2 –
Construct the index number for the year 2010
Commodities | Price (2009) | Price(2010) |
P | 6 | 10 |
Q | 12 | 2 |
R | 4 | 6 |
S | 10 | 12 |
T | 8 | 12 |
|
|
|
Solution
Commodities | Price (2009) | Price(2010) | Price relative |
P | 6 | 10 | 166.67 |
Q | 12 | 2 | 16.67 |
R | 4 | 6 | 150 |
S | 10 | 12 | 120 |
T | 8 | 12 | 150 |
N = 5 |
|
| 603.34 |
Index number = 603.34/4 = 120.68
Example 3 –
Using simple average of price relative method find price index for 2001, taking 1996 as base year for the following data
Commodity | Wheat | Rice | Sugar | Ghee | Tea |
Price in 1996 | 12 | 20 | 12 | 40 | 80 |
Price in 2001 | 16 | 25 | 16 | 60 | 96 |
Solution
Commodities | Price (2009) | Price(2010) | Price relative |
Wheat | 12 | 16 | (16/12)*100 = 133.33 |
Rice | 20 | 25 | (25/20)*100 = 125 |
Sugar | 12 | 16 | 133.33 |
Ghee | 40 | 60 | 150 |
Tea | 80 | 96 | 120 |
N = 5 |
|
| 661.66 |

 =661.66 = 132.33
5
Therefore Price Index for 2001, taking 1996 as base year, = 132.33
Example 4 –
Using simple average of price relative method find price index for 2010, taking 2009 as base year for the following data
Commodities | Price (2009) | Price(2010) |
A | 60 | 80 |
B | 50 | 60 |
C | 60 | 72 |
D | 50 | 75 |
E | 25 | 37 .5 |
F | 20 | 30 |
Solution
Commodities | Price (2009) | Price(2010) | Price relatives |
A | 60 | 80 | 133.33 |
B | 50 | 60 | 120 |
C | 60 | 72 | 120 |
D | 50 | 75 | 150 |
E | 25 | 37 .5 | 150 |
F | 20 | 30 | 150 |
N = 6 |
|
| 823.33 |

= 823.33/6 = 137.22
3. Weighted aggregative method – in this method, according to the relative importance, different weights are assigned to the items. Many formulas developed to estimate index numbers on the basis of weights.
Some of the formulas given below
- Laspeyre’s formula - in this method, the quantities of the base year are accepted as weight

- Paasche’s formula – in this method, the quantities of the current year are accepted as weight

- Dorbish and Bowley’s formula – this method is the combination of Laspeyre’s formula and Paasche’s formula

- Fisher’s ideal formula – this method is the geometric mean of Laspeyre’s formula and Paasche’s formula

- Marshall – edgeworth method - In this method also both the current year as well as base year prices and quantities are considered.
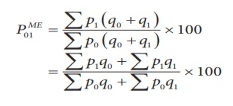
- Kelly’s method –

Where q refers to quantity of some period, not necessarily of the mean of the base year and current year.
Example 1 –
Commodity | Base year | Current year | ||
PO | QO | P1 | Q1 | |
A | 10 | 5 | 20 | 2 |
B | 15 | 4 | 25 | 8 |
C | 40 | 2 | 60 | 6 |
D | 25 | 3 | 40 | 4 |
Solution
Commodity | Base year | Current year |
|
|
|
| ||
PO | QO | P1 | Q1 | Poqo | P1qo | Poq1 | P1q1 | |
A | 10 | 5 | 20 | 2 | 50 | 100 | 20 | 40 |
B | 15 | 4 | 25 | 8 | 60 | 100 | 120 | 200 |
C | 40 | 2 | 60 | 6 | 80 | 120 | 240 | 360 |
D | 25 | 3 | 40 | 4 | 75 | 120 | 100 | 160 |
|
|
|
|
| 265 | 440 | 480 | 760 |
- Laspeyre’s formula

P 01 = (440/265)*100 = 166.04
- Paasche’s formula

P 01 = (760/480)*100 = 158.33
- Dorbish and Bowley’s formula

 P 01 = ((440/265) + (760/480)) *100 = 162
2
- Fisher’s ideal formula

 P 01 = √ ((440/265) + (760/480)) *100 = 162.1
Example 2
Commodity | Base year | Current year | ||
PO | QO | P1 | Q1 | |
A | 15 | 500 | 20 | 600 |
B | 18 | 590 | 23 | 640 |
C | 22 | 450 | 24 | 500 |
Solution
Commodity | Base year | Current year |
|
|
|
| ||
PO | QO | P1 | Q1 | Poqo | P1qo | Poq1 | P1q1 | |
A | 15 | 500 | 20 | 600 | 7500 | 10000 | 9000 | 12000 |
B | 18 | 590 | 23 | 640 | 10620 | 13570 | 11520 | 14720 |
C | 22 | 450 | 24 | 500 | 9900 | 10800 | 11000 | 12000 |
|
|
|
|
|
|
|
|
|
|
|
|
|
| 28020 | 34370 | 31520 | 38720 |
- Laspeyre’s formula

P 01 = (34370/28020)*100 = 122.66
- Paasche’s formula

P 01 = (38720/31520)*100 = 122.84
- Dorbish and Bowley’s formula

 P 01 = ((34370/28020) + (38720/31520)) *100 = 122.66
2
- Fisher’s ideal formula

 P 01 = √ = ((34370/28020) + (38720/31520)) *100 = 122.69
Example 3
Commodity | Base year | Current year | ||
PO | QO | P1 | Q1 | |
A | 2 | 8 | 4 | 6 |
B | 5 | 10 | 6 | 5 |
C | 4 | 14 | 5 | 10 |
D | 2 | 19 | 2 | 13 |
Solution
Commodity | Base year | Current year |
|
|
|
| ||
PO | QO | P1 | Q1 | Poqo | P1qo | Poq1 | P1q1 | |
A | 2 | 8 | 4 | 6 | 16 | 32 | 12 | 24 |
B | 5 | 10 | 6 | 5 | 50 | 60 | 25 | 30 |
C | 4 | 14 | 5 | 10 | 56 | 70 | 40 | 50 |
D | 2 | 19 | 2 | 13 | 38 | 38 | 26 | 26 |
|
|
|
|
| 160 | 200 | 103 | 130 |
- Laspeyre’s formula

P 01 = (200/160)*100 = 125
- Paasche’s formula

P 01 = (130/103)*100 = 126.21
- Dorbish and Bowley’s formula

 P 01 = ((200/160) + (130/103)) *100 = 125.6
2
- Fisher’s ideal formula

 P 01 = √ = ((200/160) + (130/103)) *100 = 125.61
- Marshall-Edgeworth method
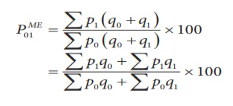
= (200+130)/(160+103) *100 = 125.48
Example 4 – Calculate the price indices from the following data by applying (1) Laspeyre’s method (2) Paasche’s method and (3) Fisher ideal number by taking 2010 as the base year.
Commodity | 2010 | 2011 | ||
PO | QO | P1 | Q1 | |
A | 20 | 10 | 25 | 13 |
B | 50 | 8 | 60 | 7 |
C | 35 | 7 | 40 | 6 |
D | 25 | 5 | 35 | 4 |
Solution
Commodity | 2010 | 2011 |
|
|
|
| ||
PO | QO | P1 | Q1 | Poqo | P1qo | Poq1 | P1q1 | |
A | 20 | 10 | 25 | 13 | 200 | 250 | 260 | 325 |
B | 50 | 8 | 60 | 7 | 400 | 480 | 350 | 420 |
C | 35 | 7 | 40 | 6 | 245 | 280 | 210 | 240 |
D | 25 | 5 | 35 | 4 | 125 | 175 | 100 | 140 |
|
|
|
|
| 970 | 1185 | 920 | 1125 |
- Laspeyre’s formula

P 01 = (1185/970)*100 = 122.16
- Paasche’s formula

P 01 = (1125/920)*100 = 122.28
- Fisher’s ideal formula

 P 01 = √ = ((1185/970) + (1125/920)) *100 = 120.55
Example 5 - Calculate the Dorbish and Bowley’s price index number for the following data taking 2014 as base year.
Item | 2010 | 2011 | ||
PO | QO | P1 | Q1 | |
Oil | 80 | 3 | 100 | 4 |
Pulses | 35 | 2 | 45 | 3 |
Sugar | 25 | 2 | 30 | 3 |
Rice | 50 | 30 | 54 | 35 |
Solution
Item | 2010 | 2011 |
|
|
|
| ||
PO | QO | P1 | Q1 | Poqo | P1qo | Poq1 | P1q1 | |
Oil | 80 | 3 | 100 | 4 | 240 | 300 | 320 | 400 |
Pulses | 35 | 2 | 45 | 3 | 70 | 90 | 105 | 135 |
Sugar | 25 | 2 | 30 | 3 | 50 | 60 | 75 | 90 |
Rice | 50 | 30 | 54 | 35 | 1500 | 1620 | 1750 | 1890 |
|
|
|
|
| 1860 | 2070 | 2250 | 2515 |
- Dorbish and Bowley’s formula

 P 01 = ((2070/1860) + (2515/2250)) *100 = 111.38
2
Example 6 – calculate a suitable price index from the following data
Commodity | Quantity | Price | |
|
| 2007 | 2010 |
X | 25 | 3 | 4 |
Y | 12 | 5 | 7 |
Z | 10 | 6 | 5 |
Solution
Commodity | Q | P0 | P1 | P0Q | P1Q |
X | 25 | 3 | 4 | 75 | 100 |
Y | 12 | 5 | 7 | 60 | 84 |
Z | 10 | 6 | 5 | 60 | 50 |
|
|
|
| 195 | 234 |
Kelly price index

= 235/195*100 = 120
4. Weighted average of relative method – in this method different weights are used for the items according to their relative importance. If p = [p1/ p0] × 100 is the price relative index and w = p0q0 is attached to the commodity

Where,  means sum of weights for different commodities
 Sum of price relatives
Example 1 –
Commodity | Weight | Base price year | Current price year |
A | 5 | 10 | 20 |
B | 4 | 15 | 25 |
C | 2 | 40 | 60 |
D | 3 | 25 | 40 |
Solution
Commodity | Weight | Base price year | Current price year | Price relatives | RW |
A | 5 | 10 | 20 | 20/10*100 = 200 | 1000 |
B | 4 | 15 | 25 | 25/15*100 =166.7 | 666.8 |
C | 2 | 40 | 60 | 60/40*100 = 150 | 300 |
D | 3 | 25 | 40 | 40/25*100 = 160 | 480 |
| 14 |
|
|
| 2446.8 |

P01 = 2446.8/14 = 174.8
Example 2 – compute price index by applying weighted average of relative method
Commodity | Quantity | Base price year | Current price year |
Wheat | 20 | 3 | 4 |
Flour | 40 | 1.5 | 1.6 |
Milk | 10 | 1 | 1.5 |
Solution
Commodity | Quantity | Base price year | Current price year | Weight | Price relatives | RW |
Wheat | 20 | 3 | 4 | 60 | 133.3 | 8000 |
Flour | 40 | 1.5 | 1.6 | 60 | 106.7 | 6400 |
Milk | 10 | 1 | 1.5 | 10 | 150.0 | 1500 |
|
|
|
|
|
|
|
|
|
|
| 130 |
| 15900 |

P01 = 15900/130 = 122.30
Example 3 – calculate weighted average of relative method
Commodity | Base price year | Current price year | Weight |
x | 3 | 4 | 7 |
y | 1.5 | 1.6 | 8 |
z | 1 | 1.5 | 9 |
Solution
Commodity | Base price year | Current price year | Weight | Price relatives | RW |
x | 3 | 4 | 7 | 133.3 | 933.33 |
y | 1.5 | 1.6 | 8 | 106.7 | 853.33 |
z | 1 | 1.5 | 9 | 150.0 | 1350 |
|
|
| 24 |
| 3136.66 |

P01 = 3136.66/24 = 130.67
The construction of the price index involves the following problems
- Selection of base year – the first step in preparing index number is the selection of base year. The base year is that year with reference to which changes in the price in other years are compared and expressed in percentage. The base year should be normal year free from abnormal condition like war, flood, etc. Base year are selected in two ways
- Fixed base method in which the base year remains fixed
- Chain base method in which base year goes on changing. Ex -2000 base year for 2001, 2001 base year for 2002, and so on
2. Selection of commodities – selection of commodities is one of the problems in constructing index number. As all commodities are not included, only representative commodities are selected keeping in mind the purpose and type of index number.
The following points are considered while selecting commodities
- Items should be representative of taste, habits and custom of people
- Items should be recognizable
- Quality of the item should be stable over two different places and periods
- The economic and social importance of various items should be considered
- The items should be fairly large in number.
- All those varieties of a commodity which are in common use and are stable in character should be included.
3. Collection of prices – the next problem is the collection of prices. Problems are from where the prices to be collected, which price to select wholesale or retail, whether to include taxes in the price. The following points should be considered while collecting prices
- Where commodities are traded in large, prices should be collected from those places
- Published information regarding the prices should also be utilized
- Selection of price depends on the type of index number prepared
- Non biased individual and institution should be selected who supply price quotation
- Prices collected from various places should be averaged
4. Selection of averages – Fourth problem is to choose a suitable average. Theoretically, geometric mean is the best for this purpose. But, in practice, arithmetic mean is used because it is easier to follow.
5. Selection of weights – commodities included in the calculation of index numbers are not of equal importance. Therefore proper weight should be assigned to the commodities for accurate index numbers. Weight should be unbiased and be rationale. For ex – price of books should be given more weightage while preparing index numbers for teachers rather than for workers.
6. Purpose of index numbers – the important point in the construction of index numbers is the objective of index numbers. Before preparing index numbers, it is important to be clear about the purpose of the index numbers. Different index numbers are prepared with a specific purpose.
Sources
- B.N Gupta – Statistics
- S.P Singh – statistics
- Gupta and Kapoor – Statistics
- Yule and Kendall – Statistics method