Unit 8
Annotations, layering & other functions
Dimensions to objects
While creating a drawing, we need to provide the size information. You can provide the size information by adding dimensions to the drawings.
Creating Dimensions
In AutoCAD, there are many tools available for creating dimensions. You can access these tools from the Ribbon, Command line, and Menu Bar.
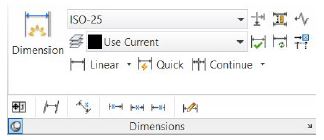
The following table gives you the functions of various dimensioning tools.

Create a rectangle, circle, arc, and two intersecting lines, as shown in the previous figure.
Click Annotate > Dimensions > Dimension on the ribbon.
Select a line, move the pointer, and click to create the linear dimension.
Select a circle, move the pointer, and click to position the diameter dimension.
Select an arc, move the pointer, and click to position the radial dimension.
Place the pointer on the arc, type L, and press Enter. Select the arc, move the pointer, and click to position the arc length dimension.
Place the pointer on the arc, type A, and press Enter. Select the arc, move the pointer, and click to position the angle of the arc.
Select two non-parallel lines and position the angular dimension between them.
Likewise, you can create other types of dimensions using the Dimension tool.
1. Linear

Click Annotate > Dimensions > Dimension drop-down> Linear on the ribbon.
Select the first and second points of the dimension.
Move the pointer in horizontal direction to create a vertical dimension (or) move in the vertical direction to create a horizontal dimension.
Click to position the dimension.
2. Aligned

Click Annotate > Dimensions > Dimension drop-down > Aligned on the ribbon.
Select the first and second points of the dimension line (or) press Enter and select the line.
Move the pointer and click to position the dimension.
3. Arc length

Click Annotate > Dimensions > Dimension drop-down > Arc Length on the ribbon.
Select an arc from the drawing.
If you want to dimension only a partial length of an arc, select Partial option from the command line. Next, select the two points on the arc.
Move pointer and click to position the dimension.
4. Continue
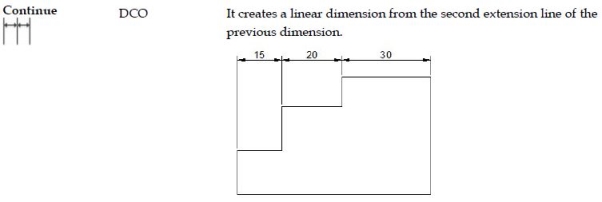
Create a linear dimension by selecting the first and second points.
5. Baseline

Create a linear dimension by selecting the first and second points.
6. Angular
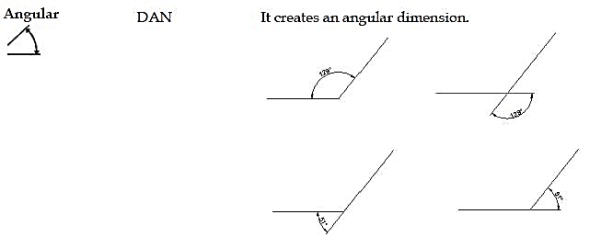
Click Annotate > Dimensions > Dimension drop-down > Angle on the ribbon.
Select the first line and second line.
Move the pointer and position the angle dimension.
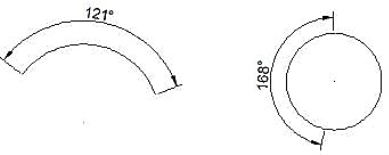
To create an angle dimension on an arc, select the arc and position the dimension.
To create an angle dimension on a circle, select two points on the circle and position the angle dimension.
7. Diameter

Click Annotate > Dimensions > Dimension drop-down> Diameter on the ribbon.
Select a circle or an arc and position the dimension.
8. Quick dimensions
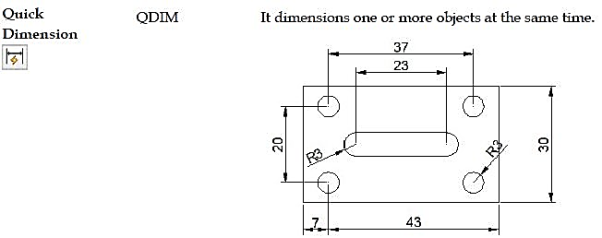
Click Annotate > Dimensions > Quick Dimension on the ribbon.
Select one or more objects from a drawing.
Right-click and position the dimensions.
Layers to create drawings
Drawing layouts
There are two workspaces in AutoCAD: The Model space and the Paper space. In the Model space, you create 2D drawings and 3D models. You can even plot drawings from the model space. However, it is difficult to plot drawings at a scale or if a drawing consists of multiple views arranged at different scales. For this purpose, we use Layouts or paper space. In Layouts or paper space, you can work on notes and annotations and perform the plotting or publishing operations. In Layouts, you can arrange a single view or multiple views of a drawing or multiple drawing by using Viewports. These viewports display drawings at specific scales on layouts. They are mainly rectangular in shape, but you can also create circular and polygonal viewports. In this chapter, you will learn about viewports and various annotative objects.
Working with layouts
Layouts represent the conventional drawing sheet. They are created to plot a drawing on a paper or in electronic form. A drawing can have multiple layouts to print in different sheet formats. By default, there are two layouts available: Layout 1 and Layout 2. You can also create new layouts by clicking the plus (+) symbol next to the layout. Next, select New layout from the shortcut menu. In the following example, you will create two layouts, one representing the ISO A1 (841 X 594) sheet and another representing the ISO A4 (210 X 297) sheet.
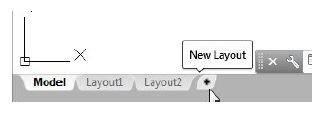
Example:
Open a new drawing file.
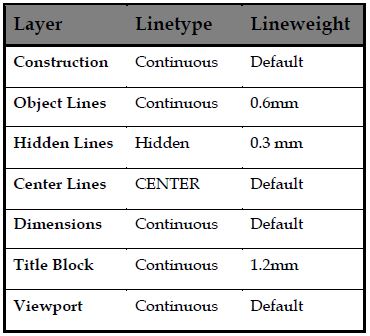
Create layers with the following settings:
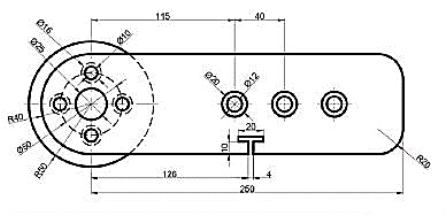
Create the drawing, as shown next. Do not add dimensions.
Click the Layout 1 tab at the bottom of the graphics window.

You will notice that a white paper is displayed with the viewport created, automatically. The components of a layout are shown in figure below.
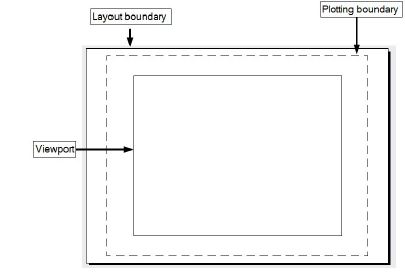
Click Output > Plot > Page Setup Manager on the ribbon; the Page Setup Manager dialog appears.
Click the Layout2 tab below the graphics window.
Double-click on the Layout1 tab and enter ISO A1; the Layout1 is renamed.
Similarly, rename the Layout2 to ISO A4.
Click Layout > Layout > Page Setup on the ribbon; the Page Setup Manager dialog appears.
Select ISO A4 from the list.
Click the Modify button on the dialog.
In the Page Setup dialog, select the DWG to PDF.pc3 plotter and select acad.stb from the Plot style table drop-down.
Set the Paper size to ISO A4 (210 x 297 MM) and Scale to1:1.
Set Drawing Orientation as Portrait and click OK; you will notice that the size of the Layout is changed to A4 size.
Close the Page Setup Manager dialog.
Creating Viewports in the Paper space
The viewports that exist in the paper space are called floating viewports. This is because you can position them anywhere in the layout and modify their shape size with respect to the layout.
Creating a Viewport in the ISO A4 layout
Open the ISO A4 layout, if not already open.
Select the default viewport that exists in the ISO A4 layout.
Press the DELETE key; the viewport will be deleted.
Click Layout > Layout Viewports >
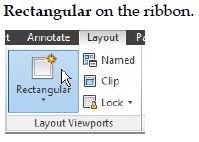
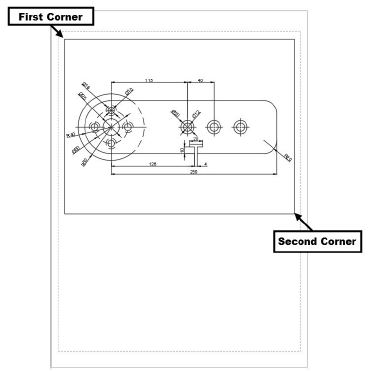
Create the rectangular viewport by picking the first and second corner points, as shown in figure.
Click the PAPER button on the status bar; the model space inside the viewport will be activated. In addition, the viewport frame will become thicker when you are in model space.

Click the Viewport Scale button and select 1:2 from the menu; the drawing will be zoomed out.

Click Layout > Layout Viewports > Viewport drop-down > Object on the ribbon.
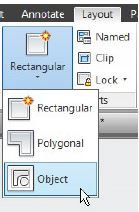
Select the circle from the layout; it will be converted into a viewport.
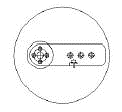
Double-click in the circular viewport to switch to the model space.
Click the Viewport Scale button on the status bar and select 4:1 from the menu; the drawing will be zoomed in to its center.
Use the Pan tool and adjust the drawing, as shown below.
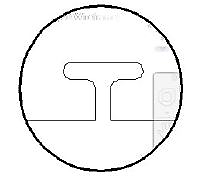
Click the Lock button on the Layout Viewports panel.
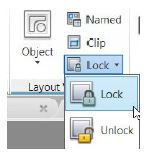
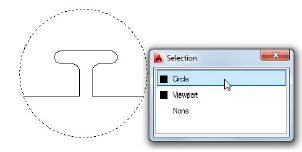
Select the circular viewport and press ENTER; the drawing inside the viewport will be locked. Now, you cannot zoom or pan the drawing.
Click Output > Plot > Preview on the ribbon; the plot preview will be displayed. You will notice that the viewport frames are also displayed in the preview.
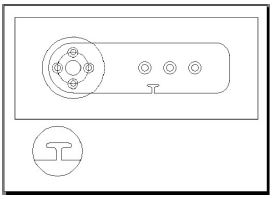
Press ESC to close the preview window.
To hide viewport frames while plotting a drawing, follow the steps given below.
Type LA in the command line to open the Layer Properties Manager.
In the Layer Properties Manager, create a new layer called Hide Viewports and make it current.
Deactivate the plotter symbol  under the Plot column of the Hide Viewports layer; the object on this layer will not be plotted.
Close the Layer Properties Manager.
Click the Home tab on the ribbon and expand the Layers panel.
Click the Change to Current Layer button on the Layers panel.
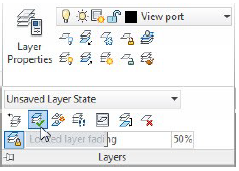
Select the viewports in the ISO A1 layout and press ENTER; the viewport frames will become unplottable. To check this, click the Preview button on the Plot panel; the plot preview will be displayed as shown below.
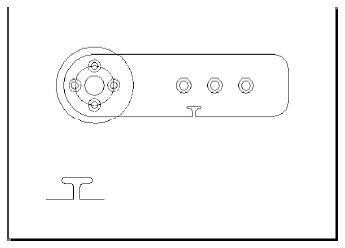
Close the preview window.
Changing the Layer Properties in Viewports
The layer properties in viewports are not related to the layer properties in model space. You can change the layer properties in viewports without any effect in the model space.
Double-click inside the larger viewport to activate the model space.
Type LA in the command line to open the Layer Properties Manager.
In the Layer Properties Manager, click the icon in the VP Freeze  column of the Hidden layer; the hidden lines will disappear in the viewport, as shown below.
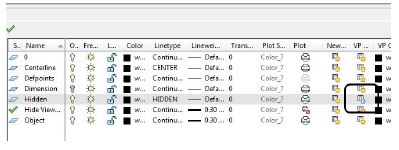
Double-click outside the viewport to switch to paper space.
Click the Model tab below the graphics window; you will notice that the hidden lines are retained in the model space.

(extend/lengthen)
Editing Dimensions by Stretching
In AutoCAD, the dimensions are associative to the drawing. If you modify a drawing, the dimensions will be modified, automatically. In the following example, you will stretch the drawing to modify the dimensions.
Example:
Create the drawing as shown below and apply dimensions to it.
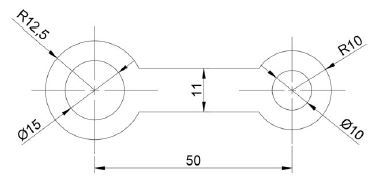
Click Home > Modify > Stretch on the ribbon.
Drag a window and select the right-side circles and the horizontal lines.
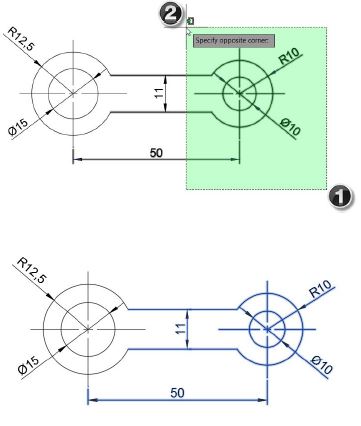
Right-click and select the center point of the right-side circles.
Move the pointer to stretch the drawing; you will notice that the horizontal dimension also changes.
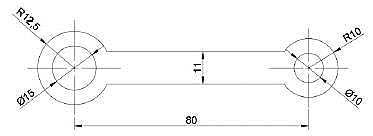
Type 30 and press ENTER; the horizontal dimension is updated to 80.
Modifying Dimensions by Trimming and Extending
In earlier chapters, you have learned to modify drawings by trimming and extending objects. In the same way, you can modify dimensions by trimming and extending. The following example shows you to modify dimensions by this method.
Modifying Dimensions by Trimming and Extending
In earlier chapters, you have learned to modify drawings by trimming and extending objects. In the same way, you can modify dimensions by trimming and extending. The following example shows you to modify dimensions by this method.
Example:
Create a drawing as shown below and add dimensions to it.
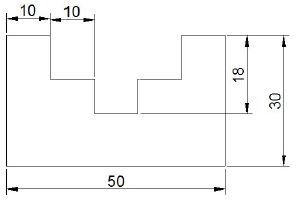
Click Home > Modify > Trim on the ribbon.
Select the horizontal edge as shown in figure and right-click to accept.
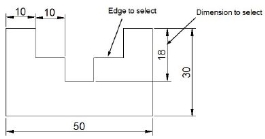
Select the vertical dimension with the value 18. This trims the dimension up to the selected edge.
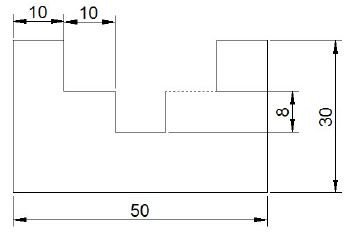
Press ESC.
Click Home > Modify > Trim > Extend on the ribbon.
Select the vertical edge as the boundary, as shown below. Next, right-click to accept.
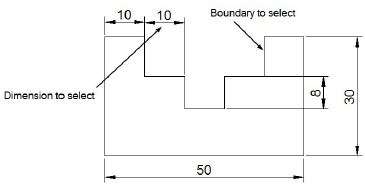
Select the horizontal dimension with the value 10. This will extend the dimension up to the selected boundary.
Press Esc.
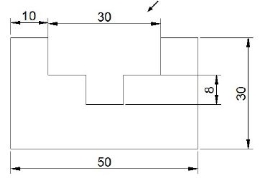
Using the DIMEDIT command
The DIMEDIT command can be used to modify dimension. Using this command, you can add text to a dimension, rotate the dimension text and extension lines or reset the position of the dimension text.
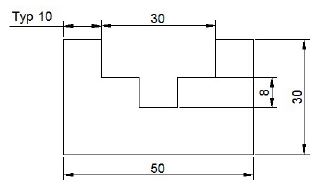
Type DED in the command line and press ENTER.
Select the New option from the command line; a text box appears.
Enter TYP in the text box and press the SPACEBAR.
Left click and select the dimension with value 10.
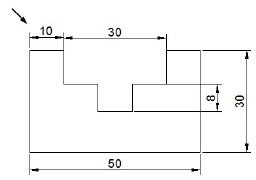
Press ENTER; the dimension text will be changed.
To plot a drawing to PDF press CTRL+P on keyboard or type PLOT on the command line and press enter, this will open plot window in AutoCAD. Select DWG to PDF.pc3 plotter from the list of plotters.
If you are using AutoCAD 2016 then you can also select other PDF plotters with some predefined settings like AutoCAD PDF (General documentation).pc3 which has a resolution of 1200 dpi and AutoCAD PDF (High Quality print).pc3 which has a resolution of 2400 dpi.
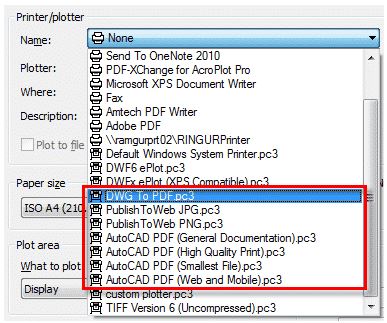
 You can also select Publish to web JPG.pc3, Publish to web PNG.pc3 or TIFF plotters to get output in image formats. You can also get high resolution images from AutoCAD by configuring custom plotter.
PDF Export:
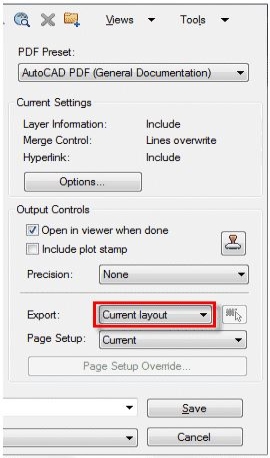
Type EPDF on the command line and press enter to start the export PDF command. Select the pre-set from PDF Pre-set drop-down menu. You can customize this pre-set using options button of Current settings panel as shown in the image below.
The PDF settings can be changed as per your requirement using Options button, I have discussed the PDF options settings in next section of the article.
When you use this command in layout view you will find an additional Export field with the current layout and all layouts options. Select All layouts option from this drop-down menu if you want to plot all layouts of current drawing into a single PDF file.
If straight lines are drawn from various points on the contour of an object to meet a plane, the object is said to be projected on that plane. The figure formed by joining, in correct sequence, the points at which these lines meet the plane, is called the projection of the object. The lines from the object to the plane are called projectors.
Methods of Projection:
Following four methods of projection are commonly used,
1) Orthographic projection.
2) Isometric projection.
3) Oblique projection.
4) Perspective projection.
In the above methods 2, 3 and 4 represent the object by a pictorial view as eyes see it. In these methods of projection, a three-dimensional object is represented on a projection plane by one view only, while in the orthographic projection an object is represented by two or three views on the mutual perpendicular projection planes. Each projection view represents two dimensions of an object. For the complete description of the three-dimensional object at least two or three views are required.
Solids and project the true shape of the sectioned surface
You can create section views to display the interior portion of a component that cannot be shown clearly by means of hidden lines. This can be done by cutting the component using an imaginary plane. In a section view, section lines, or crosshatch lines are added to indicate the surfaces that are cut by the imaginary cutting plane. In AutoCAD, you can add these section lines or crosshatch lines using the Hatch tool.
The Hatch tool
The Hatch tool is used to generate hatch lines by clicking inside a closed area. When you click inside a closed area, a temporary closed boundary will be created using the PLINE command. The closed boundary will be filled with hatch lines, and then it will be deleted.
Example 1:
In this example, you will apply hatch lines to the drawing as shown in figure below.
Open a new AutoCAD file.
Create four layers with the following properties.

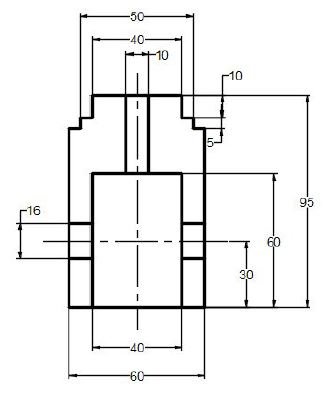
Create the drawing as shown below. Do not apply dimensions.
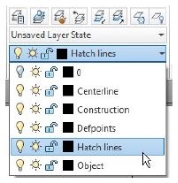
Select the Hatch lines layer from the Layer drop-down.
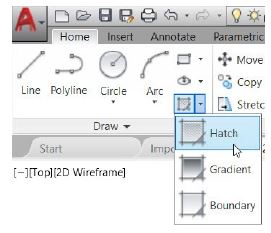
Click Home > Draw > Hatch on the ribbon or enter H in the command line; the Hatch Creation tab appears in the ribbon.
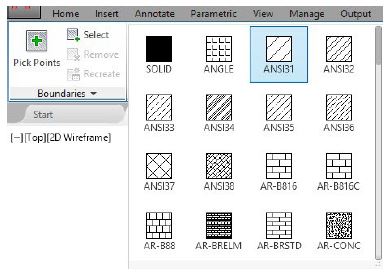
Select ANSI31 from the Pattern panel of the Hatch Creation ribbon tab.
Click in the four regions of the drawing, as shown below.
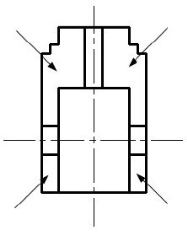
Click the Close Hatch Creation button on the ribbon.
Example
Create four layers with the following settings.
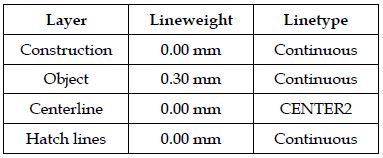
Create the following drawing in different layers. Do not apply dimensions.
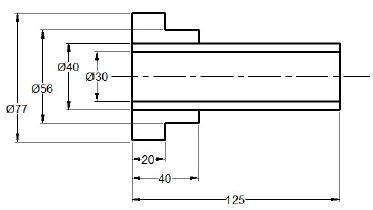
Type H and press ENTER; the Hatch Creation tab appears in the ribbon.
Select the Pattern option from the Hatch Type drop-down in the Properties panel.
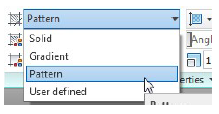
You can also select a different hatch type such as Solid, Gradient, and User defined.
Select ANSI31 from the Pattern panel.
Select Blue from the Hatch Color drop-down.
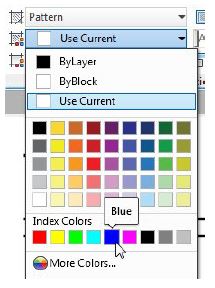
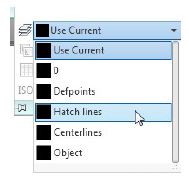
Expand the Properties panel and set the Hatch Layer Override to Hatch lines.
Click the Pick Points button from the Boundaries panel.

Pick points in the outer areas of the drawing as shown below.
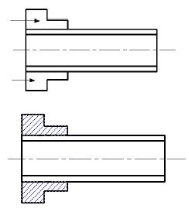
Adjust the Hatch Pattern Scale to 1.5; you will notice that the distance between the hatch lines changes.

Click Close Hatch Creation button on the Close panel.

Working with Annotative Dimensions
In AutoCAD, you create drawings at their actual size. However, when you scale a drawing to fit inside a viewport, the size of the dimensions will not be scaled properly. For example, in the following figure, the first viewport is scaled to 1:2 and the second viewport is scaled to 1:1. The dimensions in the first viewport appear much smaller.
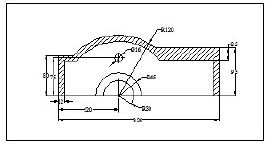
You can fix this problem by applying the Annotative property to dimensions.
Open the Viewports-Example.dwg, if not already opened.
Set the Dimensions layer as current.
Type D in the command line and press ENTER.
In the Dimension Style Manager, click the New button.
In the Create New Dimension Style dialog, enter New style name as Dim_Anno and select the Annotative check box. Click Continue.
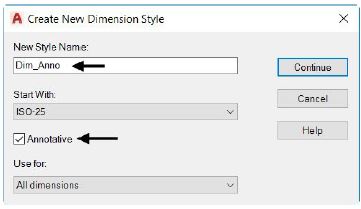
Set the following settings in the New Dimension Style dialog.
Lines tab: Offset from origin-1.25
Symbols and Arrows tab: Arrow size -2.5, Center Marks-Line.
Text tab: Text height – 2.5, Text placement - Vertical-Centered, Text alignment – Horizontal
Primary Units tab: Units Format – Decimal, Precision – 0, Decimal separator – ‘.’period
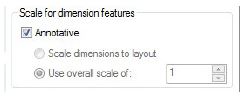
In the Fit tab, ensure that the Annotative check box is selected.
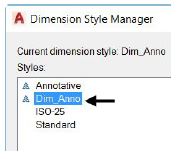
Click OK on the New Dimension Style dialog; you will notice that the Dim_Anno style is listed in the Dimension Style Manager. Also, the annotation symbol is displayed next to it. This indicates that all dimensions created using this style will have annotative property. Click on the Close button.
Activate the Dimension tool and set the Annotation Scale to 1:1. Click OK.
Create a linear dimension as shown below.
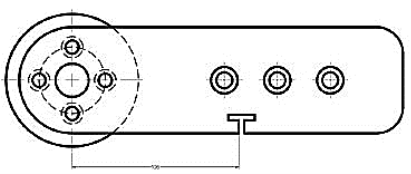
Activate Automatically add scales to annotative objects when the annotation scale changes on the status bar.

Set the Annotation Scale to 1:2; the size of the dimension will automatically increase by two times.

Assemblies
Manufacturing of a product is the main activity in engineering profession. The design of a product may start with trial designs in the form of sketches on paper. As the design improves and undergoes changes, the final form of design must be the scaled manufacturing drawings with finer details included. These drawings are two-dimensional representations of three-dimensional objects designed.
During the process of design, the designer may have to carry out a large amount of computations so that an optimum design is obtained. A computer with good graphic capabilities helps the designer to,
(i) realize his ideas.
(ii) carry out complex computations.
(iii) present the results of computations in a useful form for decision making and possible improvement.
(iv) present the improved model for evaluation. Interactive Computer Graphics (ICG) is the tool of the designer.
Models
A wireframe representation is a 3-D line drawing of an object showing only the edges without any side surface in between.
A frame constructed from thin wires representing the edges and projected lines and curves.
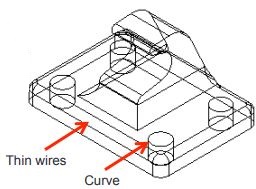
A wireframe model of an object is the simple stand represents mathematically in the computers.
It is most used technique and all commercial CAD/CAM systems are wireframe based.
Basic wire-frame entities can be divided into analytic and synthetic entities.
Wireframe Modelling
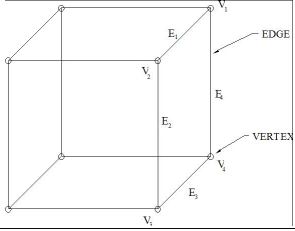
Contains information about the locations of all the points (vertices) and edges in space coordinates.
• Each vertex is defined by x, y, z coordinate.
• Edges are defined by a pair of vertices.
• Faces are defined as three or more edges.
• Wireframe is a collection of edges, there is no skin defining the area between the edges.
Advantages:
Can quickly and efficiently convey information than multitier drawings.
The only lines seen are the intersections of surfaces.
Can be used for finite element analysis.
Can be used as input for CNC machines to generate simple parts.
Contain most of the information needed to create surface, solid and higher order models.
Disadvantages:
Geometric entities are lines and curves in 3D
Volume or surfaces of object not defined
Easy to store and display
Hard to interpret – ambiguous
Hidden lines are not removed
For complex items, the result can be a jumble of lines that is impossible to determine.
No ability to determine computationally information such as the line of intersect between two faces of intersecting models.
Using the Move tool
The Move tool that you used in 2D drawings can also be used in 3D modelling. You can change the position of an object using the Move tool. The application of this tool in 3D modelling is discussed next.
Example:
Start a new file in the 3D Modelling workspace.
Select Front from the 3D Navigation drop-down of the View panel.
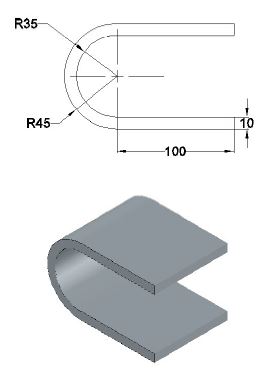
Create the sketch on the front view and press pull it up to 100 mm distance.
Create a cylinder of 20 mm diameter and 20 mm height.
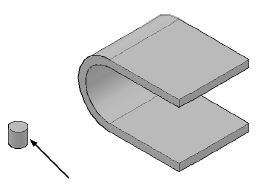
Type M in the command line and press ENTER; the Move tool is activated.
Select the cylinder and press ENTER.
Select the center point of the cylinder to define the base point.
Select the end point of the base object; the cylinder will be aligned to it.
Using the 3D Move tool
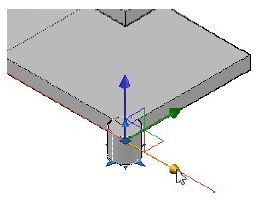
The 3D Move tool is like the Move tool. You can use this tool to move objects in 3D space. By default, the 3D Move tool is activated and the Move gizmo is displayed when you select an object. You can use the Move gizmo to move the object along an axis.
Select the cylinder to display the Move gizmo tool.
Select the X-axis (Red arrow) of the gizmo and move the pointer backwards.
Type 20 and press ENTER; the cylinder will be moved through 20 mm distance along the X-axis.
Select the Y-axis (Green arrow) of the gizmo and move the pointer toward right.
Type 20 and press ENTER; the cylinder will be moved as shown below.

Using the Array tool
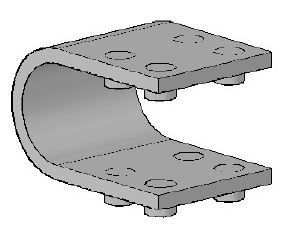
The Array tool is used to create Rectangular, path and polar arrays. You can create a rectangular array by specifying the item count and distance along the X, Y and Z directions.
Creating Drawing Views
Setting the Drafting Standard
Before you start generating the drawing views of 3D model, you need to specify the drafting standard. This defines the way the views will be generated. To specify the drafting standard, click Home > View > Drafting Standard (inclined arrow) on the ribbon; the Drafting Standard dialog appears.
In the Drafting Standard dialog, set the Projection type to Third angle.
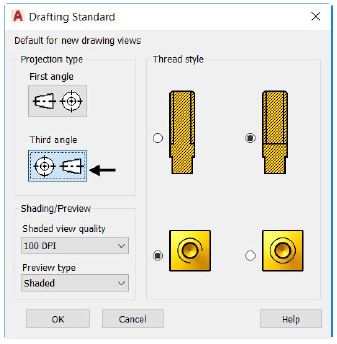
Examine the other options in the dialog, as they are self-explanatory.
Click the OK button.
Isometric, multiview, auxiliary, and section views
Multi view Drawings
To manufacture a component, you must create its engineering drawing. The engineering drawing consists of various views of the object, showing its true shape and size so that they can be clearly dimensioned. This can be achieved by creating the orthographic views of the object. In the first section of this chapter, you will learn to create orthographic views of an object. The second section introduces you to auxiliary views. The auxiliary views clearly describe the features of a component, which are located on an inclined plane or surface.
Creating Orthographic Views
Orthographic Views are standard representations of an object on a sheet. These views are created by projecting an object onto three different planes (top, front, and side planes). You can project an object by using two different methods: First Angle Projection and Third Angle Projection. The following figure shows the orthographic views that will be created when an object is projected using the First Angle Projection method.
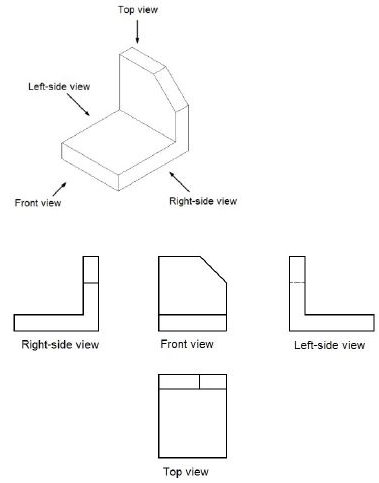
The following figure shows the orthographic views that will be created when an object is projected using the Third Angle Projection method.
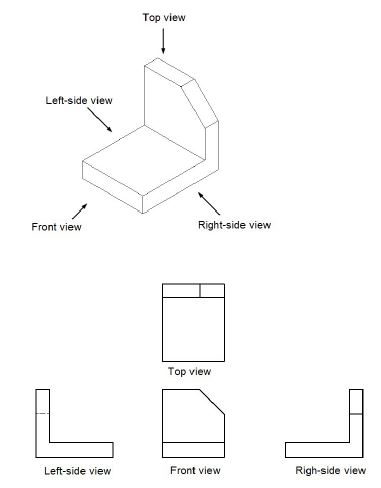
Creating Auxiliary Views
Most of the components are represented by using orthographic views (front, top and/or side views).
But many components have features located on inclined faces. You cannot get the true shape and size for these features by using the orthographic views. To see an accurate size and shape of the inclined features, you must create an auxiliary view. An auxiliary view is created by projecting the component onto a plane other than horizontal, front or side planes. The following figure shows a component with an inclined face. When you create orthographic views of the component, you will not be able to get the true shape of the hole on the inclined face.