Unit - 3
Cost of Capital and Financing Decisions
Cost of capital is the minimum rate of return that a business must earn before generating value. Before a business can turn a profit, it must at least generate sufficient income to cover the cost of the capital it uses to fund its operations. This consists of both the cost of debt and the cost of equity used for financing a business. A company’s cost of capital depends, to a large extent, on the type of financing the company chooses to rely on – its capital structure. The company may rely either solely on equity or solely on debt, or use a combination of the two.
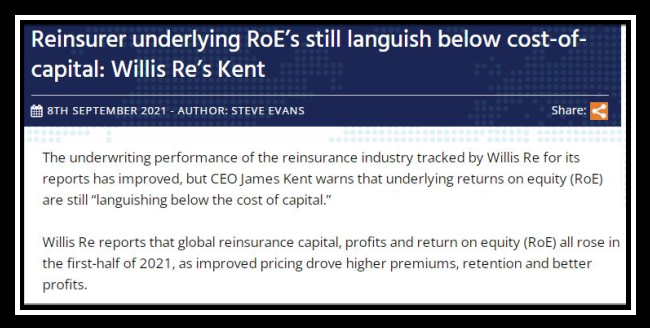
The Financing Decision is a crucial decision that is to be made by the financial manager, the decision is about the financing-mix of an organization. Financing Decision is focused on the borrowing and allocation of funds required for the investment decisions of the firm.
Sources of long-term financing
Long term funds are required for purchase of fixed/permanent assets of an organisation. Some of the popular long term sources of funds are-
The main sources of long term finance are as follows:
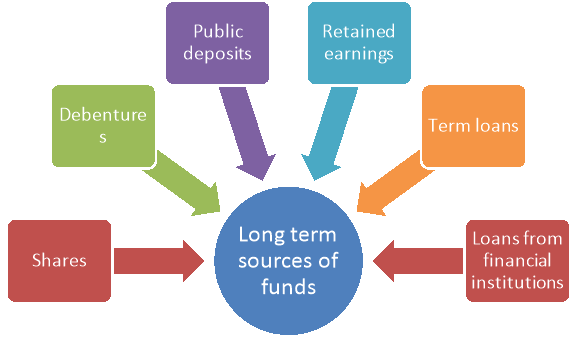
Figure: Sources of long term funds
- Shares:
These are issued to the general public. These may be of two types: (i) Equity and (ii) Preference. The holders of shares are the owners of the business.
2. Debentures:
These are also issued to the general public. The holders of debentures are the creditors of the company.
3. Public Deposits:
General public also like to deposit their savings with a popular and well-established company which can pay interest periodically and pay-back the deposit when due.
4. Retained earnings:
The company may not distribute the whole of its profits among its shareholders. It may retain a part of the profits and utilize it as capital.
5. Term loans from banks:
Many industrial development banks, cooperative banks and commercial banks grant medium term loans for a period of three to five years.
6. Loan from financial institutions:
There are many specialised financial institutions established by the Central and State governments which give long term loans at reasonable rate of interest. Some of these institutions are: Industrial Finance Corporation of India (IFCI), Industrial Development Bank of India (IDBI), Industrial Credit and Investment Corporation of India (ICICI), Unit Trust of India (UTI), State Finance Corporations etc. These sources of long term finance will be discussed in the next lesson.

Cost of capital is a composite cost of the individual sources of funds including equity shares, preference shares, debt and retained earnings. The estimated components of cost of capital are discussed below-
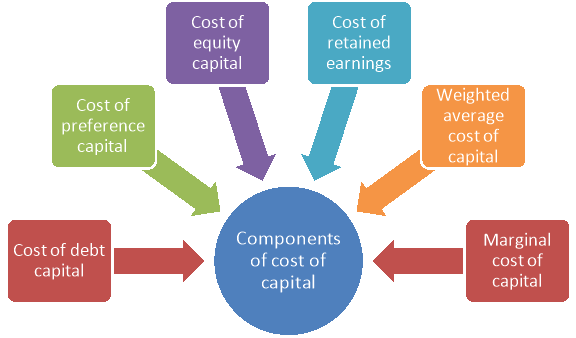
Figure: Components of cost of capital
1. Cost of Debt Capital:
Generally, cost of debt capital refers to the total cost or the rate of interest paid by an organization in raising debt capital. However, in a real situation, total interest paid for raising debt capital is not considered as cost of debt because the total interest is treated as an expense and deducted from tax. This reduces the tax liability of an organization. Therefore, to calculate the cost of debt, the organization needs to make some adjustments. Formulae to calculate cost of debt are as follows:
a. When the debt is issued at par –
KD= [(1 – T) x R] x 100
Where,
KD = Cost of debt
T = Tax rate
R = Rate of interest on debt capital
KD = Cost of debt capital
b. Debt issued at premium or discount when debt is irredeemable –
KD = [1 / NP x (1 -T) x 100]
Where,
NP = Net proceeds of debt
c. Cost of redeemable debt –
KD= [{I (1-T) + (P – NP / N) x (1- T)} / (P + NP / 2)] x 100
N = Numbers of years of maturity
P = Redeemable value of debt
2. Cost of Preference Capital:
Cost of preference capital is the sum of amount of dividend paid and expenses incurred for raising preference shares. The dividend paid on preference shares is not deducted from tax, as dividend is an appropriation of profit and not considered as an expense. Cost of preference share can be calculated by using the following formulae:
a. Cost of redeemable preference shares –
Kp = [{D + F / N (1 – T) + RP / N} / {P + NP / 2}] x 100
Where,
KP = Cost of preference share
D = Annual preference dividend
F = Expenses including underwriting commission, brokerage, and discount
N = Number of years to maturity
RP = Redemption premium
P = Redeemable value of preference share
NP = Net proceeds of preference shares
b. Cost of irredeemable preference shares –
KP = (D / NP) x 100
3. Cost of Equity Capital:
It is very difficult to calculate the cost of equity capital as compared to debt capital and preference capital. The main reason is that the equity shareholders do not receive fixed interest or dividend. The dividend on equity shares varies depending upon the profit earned by an organization. Risk factor also plays an important role in deciding rate of dividend to be paid on equity capital. Therefore, there are various approaches to calculate cost of equity capital. It consists of the following approaches-
i. Dividend Price Approach:
The dividend price approach describes the investors’ view before investing in equity shares. According to this approach, investors have certain minimum expectations of receiving dividend even before purchasing equity shares. An investor calculates present market price of the equity shares and their rate of dividend.
The dividend price approach can be mathematically calculated by using the following formula:
KE = (Dividend per share / Market price per share) x 100
KE = Cost of equity capital
However, the dividend price approach his criticized on certain grounds, which are as follows:
a. Does not take into consideration the appreciation in the value of capital. The dividend price approach is based on the assumption that investors expect some dividend on their shares. It completely ignores the fact that some investors also consider the chances of capital appreciation, which increases the value of their shares.
b. Ignores the impact of retained earnings, which affect both the market price of shares and the amount of dividend paid. For example- suppose if an organization keeps major portion of its profit as retained earnings, then it would pay low dividend, which may decrease the market price of its shares.
Ii. Earnings Price Ratio Approach:
The earnings price ratio approach suggests that cost of equity capital depends upon amount of fixed earnings of an organization. According to the earnings price ratio approach, an investor expects that a certain amount of profit must be generated by an organization. Investors do not always expect that the organization distribute dividend on a regular basis.
Sometimes, they prefer that the organization invests the amount of dividend in further projects to earn profit. In this way, the organization’s profit would increase, which in turn increases the value of its shares in the market.
The formula to calculate cost of capital through the earnings price ratio approach is as follows:
KE = E / MP
Where,
E = Earnings per share
MP = Market price
However, this approach is criticized on the following grounds:
a. Assumes that EPS would remain constant
b. Assumes that market price per share would remain constant
c. Ignores the fact that all the earnings of an organization are not distributed in the form of dividend. However, some part of earnings may be kept in form of retained earnings.
Iii. Dividend Price Plus Growth Approach:
The dividend price plus growth approach refers to an approach in which the rate of dividend grows with the passage of time. In the dividend price plus growth approach, investors not only expect dividend but regular growth in the rate of dividend. The growth rate of dividend is assumed to be equal to the growth rate in EPS and market price per share. In the dividend price plus growth approach, cost of capital can be calculated mathematically by using the following formula:
KE = [(D / MP) + G] x 100
Where,
D = Expected dividend per share, at the end of period
G = Growth rate in expected dividends
This approach is considered as the best approach to evaluate the expectations of investors and calculate the cost of equity capital.
Iv. Realized Yield Approach:
In the realized yield approach, an investor expects to earn the same amount of dividend, which the organization has paid in past few years. In this approach, the growth in dividend is not considered as major factors for deciding the cost of capital.
This approach is based on the following assumptions:
a. Risk factor remains constant in an organization. Returns in the given risk remain the same as per the expectations of shareholders.
b. Realized yield is equivalent to the reinvestment opportunity rate for shareholders.
According to the realized yield approach, cost of capital can be calculated mathematically by using the following formula:
KE = [{(D – P) / p} – 1] x 100
Where,
P = Price at the end of the period,
p = Price per share to day
v. Capital Asset Price Model (CAPM):
CAPM helps in calculating the expected rate of return from a share of equivalent risk in the capital market. The cost of shares that carry risk would be equal to cost of lost opportunity. For example- an investor has two investment options- to buy the shares of either X Ltd. Or Y Ltd. If the investor decides to buy the shares of X Ltd., then the cost of shares of Y Ltd. Would be the cost of lost opportunity. CAPM is based on the following assumptions:
a. A rationale investor would always avoid risk
b. A rationale investor would always wish to maximize the expected yield
c. All investors would have similar expectations
d. All investors can lend freely on the riskless rates of return
e. Capital market is in good condition and there is no existence of tax
f. Capital market is competitive in nature
g. Securities are completely divisible and there is no transaction cost
The computation of cost of capital using CAPM is based on the condition that the required rate of return on any share should be equal to the sum of risk less rate of interest and premium for the risk.
According to CAPM, cost of capital can be calculated mathematically by using the following formulae:
E = R1 + β {E (R2) – R1}
Where,
E = Expected rate of return on asset
β = Beta coefficient of assets
R1 = Risk free rate of return
E (R2) = Expected return from market portfolio
This value can be calculated by analysing data of usually five years.
Formula used to calculate beta value is as follow:
β = PIM (SD1) (SDM) / SD2M
Where,
β = Beta of stock
PIM = Correlation coefficient between the returns on stock, I and the returns on market portfolio, M.
SD1 = Standard deviation of returns on assets
SDM = Standard deviation of returns on the market portfolio
SD2M = Variance of market returns
Vi. Bond Yield Plus Risk Premium Approach:
The bond yield plus risk premium approach states that the cost on equity capital should be equal to the sum of returns on long-term bonds of an organization and risk premium given one equity shares. The risk premium is paid on equity shares because they carry high risk. Mathematically, the cost of capital is calculated as:
Cost of equity capital = Returns on long-term bonds + Risk premium
The bond yield plus risk premium approach is based on the fact that a risky organization would have high financial leverage. As a result of this, it would be earning higher profit. Therefore, the equity shareholders due to higher risks on their investments expect higher returns in the form of risk premium.
Vii. Gordon Model:
The Gordon model was proposed by Myron Gordon to calculate cost of equity capital. As per this model, an investor always prefers less risky investment as compared to more risky investment. Therefore, an organization should pay risk premium only on risky investment. The Gordon model also suggests that an investor would always prefer more of those investments, which would provide them current income.
The Gordon model is based on the following assumptions:
a. The rate of return on the investments of an organization is constant
b. The cost of equity capital is more than the growth rate
c. The corporation tax does not exist in the economy
d. The organization has perpetual existence
e. The growth rate of the organization is a part of retention ratio and its rate of return
According to the Gordon model, cost of capital can be calculated mathematically by using the following formula:
P = E (1 – b) / K- br
Where,
P = Price per share at the beginning of the year
E = Earnings per share at the end of the year
b = Fraction of retained earnings
K = Rate of return required by shareholders
r = Rate of return earned on investments made by the organization
4. Cost of Retained Earnings:
Retained earnings are organizations’ own profit reserves, which are not distributed as dividend. These are kept to finance long-term as well as short-term projects of the organization. It is argued that the retained earnings do not cost anything to the organization. It is debated that there is no obligation either formal or implied, to earn any profit by investing retained earnings. However, it is not correct because the investors expect that if the organization is not distributing dividend and keeping a part of profit as reserves then it should invest the retained earnings in profitable projects. Further, the investors expect that the organization should distribute the profit earned by investing retained earnings in the form of dividend. Cost of retained earnings can be calculated with the help of various approaches, which are as follows:
i. KE = KR Approach:
If an organization retains the dividend, then it prohibits the shareholders from earning more profit. Therefore, for retaining the dividend, the organization should earn the profit, which the shareholders would have earned by investing the dividend in other projects. Therefore, the amount of profit expected from the organization on retained earnings is the cost of retained earnings.
Ii. Soloman Erza Approach:
Includes the two options that an organization has that is either to retain the earnings to meet future uncertainties or invest in its or other organization’s projects.
5. Weighted Average Cost of Capital:
Weighted average cost of capital is determined by multiplying the cost of each source of capital with its respective proportion in the total capital. Let us understand the concept of weighted average cost of capital with the help of an example. Suppose, an organization raises capital by issuing debentures and equity shares. It pays interest on debt capital and dividend on equity capital. When the organization adds the total interest paid on debt capital to the total dividend paid on equity capital, it obtains weighted average cost of capital. An organization requires generating the profit on its various investments equal to the weighted average cost of capital. Weighted average cost of capital can be calculated mathematically by using the following formula:
Weighted Average Cost of Capital = (KE x E) + (KP x P) + (KD x D) + (Kr x R)
Where,
E = Proportion of equity capital in capital structure
P = Proportion of preference capital in capital structure
D = Proportion of debt capital in capital structure
KR = Cost of proportion of retained earnings in capital structure
R = Proportion of retained earnings in capital structure
6. Marginal Cost of Capital:
Marginal cost of capital can be defined as the cost of additional capital required by an organization to finance the investment proposals. It is calculated by first estimating the cost of each source of capital, which is based on the market value of the capital. After that, it is identified that which source of capital would be more appropriate for financing a project. The marginal cost of capital is ascertained by taking into consideration the effect of additional cost of capital on the overall profit. In simpler terms, the marginal cost of capital is calculated in the same manner as the weighted average cost of capital is calculated by just adding additional capital to the total cost of capital. Marginal cost of capital can be calculated mathematically by using the following formula:
Marginal Cost of Capital = KE {E / (E + D + P + R)} + KD {D / (E + D + P + R)} + KP {P / (E + D + P + R)} + KR {R / (E + D + P + R)}
Key takeaways
- Long term funds are required for purchase of fixed/permanent assets of an organisation. Some of such sources are shares, debentures, term loans, public deposits etc.
Capital structure refers to the amount of debt and/or equity employed by a firm to fund its operations and finance its assets. A firm’s capital structure is typically expressed as a debt-to-equity or debt-to-capital ratio. Thus, it refers to the proportions or combinations of equity share capital, preference share capital, debentures, long-term loans, retained earnings and other long-term sources of funds in the total amount of capital which a firm should raise to run its business.

Importance of Capital Structure:
The importance or significance of Capital Structure:
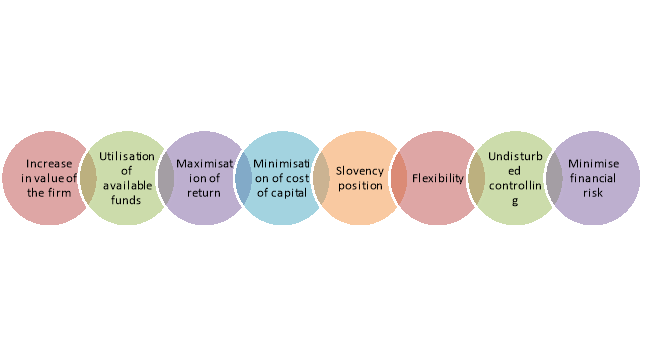
Figure: Importance of capital structure
1. Increase in value of the firm:
A sound capital structure of a company helps to increase the market price of shares and securities which, in turn, lead to increase in the value of the firm.
2. Utilisation of available funds:
A good capital structure enables a business enterprise to utilise the available funds fully. A properly designed capital structure ensures the determination of the financial requirements of the firm and raises the funds in such proportions from various sources for their best possible utilisation. A sound capital structure protects the business enterprise from over-capitalisation and under-capitalisation.
3. Maximisation of return:
A sound capital structure enables management to increase the profits of a company in the form of higher return to the equity shareholders i.e., increase in earnings per share. This can be done by the mechanism of trading on equity i.e., it refers to increase in the proportion of debt capital in the capital structure which is the cheapest source of capital. If the rate of return on capital employed (i.e., shareholders’ fund + long- term borrowings) exceeds the fixed rate of interest paid to debt-holders, the company is said to be trading on equity.
4. Minimisation of cost of capital:
A sound capital structure of any business enterprise maximises shareholders’ wealth through minimisation of the overall cost of capital. This can also be done by incorporating long-term debt capital in the capital structure as the cost of debt capital is lower than the cost of equity or preference share capital since the interest on debt is tax deductible.
5. Solvency or liquidity position:
A sound capital structure never allows a business enterprise to go for too much raising of debt capital because, at the time of poor earning, the solvency is disturbed for compulsory payment of interest to the debt-supplier.
6. Flexibility:
A sound capital structure provides a room for expansion or reduction of debt capital so that, according to changing conditions, adjustment of capital can be made.
7. Undisturbed controlling:
A good capital structure does not allow the equity shareholders control on business to be diluted.
8. Minimisation of financial risk:
If debt component increases in the capital structure of a company, the financial risk (i.e., payment of fixed interest charges and repayment of principal amount of debt in time) will also increase. A sound capital structure protects a business enterprise from such financial risk through a judicious mix of debt and equity in the capital structure.
The important theories of capital structure are discussed below-
Net Income
According to this approach, a firm can minimise the weighted average cost of capital and increase the value of the firm as well as market price of equity shares by using debt financing to the maximum possible extent. The theory propounds that a company can increase its value and decrease the overall cost of capital by increasing the proportion of debt in its capital structure.
This approach is based upon the following assumptions:
(i) The cost of debt is less than the cost of equity.
(ii) There are no taxes.
(iii) The risk perception of investors is not changed by the use of debt.
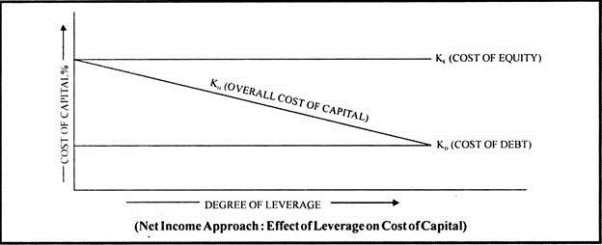
The line of argument in favour of net income approach is that as the proportion of debt financing in capital structure increase, the proportion of a less expensive source of funds increases. This results in the decrease in overall (weighted average) cost of capital leading to an increase in the value of the firm. The reasons for assuming cost of debt to be less than the cost of equity is that interest rates are usually lower than dividend rates due to element of risk and the benefit of tax as the interest is a deductible expense.
On the other hand, if the proportion of debt financing in the capital structure is reduced or say when the financial leverage is reduced, the weighted average cost of capital of the firm will increase and the total value of the firm will decrease. The Net Income (NI) Approach showing the effect of leverage on overall cost of capital has been presented in the following figure.
The total market value of a firm on the basis of Net Income Approach can be ascertained as below:
V= S + D
Where, V= Total market value of a firm
S = Market value of equity shares
= Earnings Available to Equity Shareholders (NI)/Equity Capitalisation Rate
D = Market value of debt,
And, Overall Cost of Capital or Weighted Average Cost of Capital can be calculated as:
K0 = EBIT/v
Net Operating Income
This theory as suggested by Durand is another extreme of the effect of leverage on the value of the firm. It is diametrically opposite to the net income approach. According to this approach, change in the capital structure of a company does not affect the market value of the firm and the overall cost of capital remains constant irrespective of the method of financing. It implies that the overall cost of capital remains the same whether the debt-equity mix is 50: 50 or 20:80 or 0:100. Thus, there is nothing as an optimal capital structure and every capital structure is the optimum capital structure. This theory presumes that:
(i) The market capitalises the value of the firm as a whole;
(ii) The business risk remains constant at every level of debt equity mix;
(iii) There are no corporate taxes.
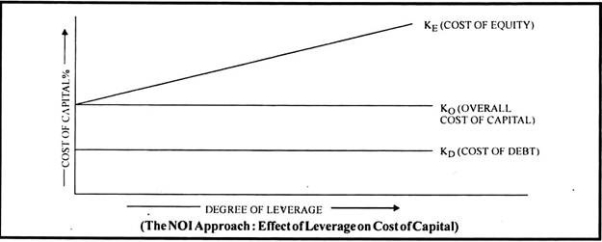
The reasons propounded for such assumptions are that the increased use of debt increases the financial risk of the equity shareholders and hence the cost of equity increases. On the other hand, the cost of debt remains constant with the increasing proportion of debt as the financial risk of the lenders is not affected.
Thus, the advantage of using the cheaper source of funds, i.e., debt is exactly offset by the increased cost of equity.
According to the Net Operating Income (NOI) Approach, the financing mix is irrelevant and it does not affect the value of the firm. The NOI approach showing the effect of leverage on the overall cost of capital has been presented in the following figure.
The value of a firm on the basis of Net Operating Income Approach can be determined as below:
V = EBIT/K0
Where, V = Value of a firm
EBIT = Net operating income or Earnings before interest and tax
k0 = Overall cost of capital
The market value of equity, according to this approach is the residual value which is determined by deducting the market value of debentures from the total market value of the firm.
S = V – D
Where, S = Market value of equity shares
V = Total market value of a firm
D = Market value of debt
The cost of equity or equity capitalisation rate can be calculated as below:
Cost of equity capital= Earnings after interest and before tax/Market value of a firm-market value of debt
= EBIT – I/V – D
MM Hypothesis
M&M hypothesis is identical with the Net Operating Income approach if taxes are ignored. However, when corporate taxes are assumed to exist, their hypothesis is similar to the Net Income Approach.
(a) In the absence of taxes. (Theory of Irrelevance):
The theory proves that the costs of capital is not affected by changes in the capital structure or say that the debt-equity mix is irrelevant in the determination of the total value of a firm. The reason argued is that though debt is cheaper to equity, with increased use of debt as a source of finance, the cost of equity increases. This increase in cost of equity offsets the advantage of the low cost of debt. Thus, although the financial leverage affects the cost of equity, the overall cost of capital remains constant. The theory emphasises the fact that a firm’s operating income is a determinant of its total value. The theory further propounds that beyond a certain limit of debt, the cost of debt increases (due to increased financial risk) but the cost of equity falls thereby again balancing the two costs. In the opinion of Modigliani& Miller, two identical firms in all respects except their capital structure cannot have different market values or cost of capital because of arbitrage process. In case two identical firms except for their capital structure have different market values or cost of capital, arbitrage will take place and the investors will engage in ‘personal leverage’ (i.e., they will buy equity of the other company in preference to the company having lesser value) as against the ‘corporate leverage’; and this will again render the two firms to have the same total value.
The M&M approach is based upon the following assumptions:
(i) There are no corporate taxes.
(ii) There is a prefect market.
(iii) Investors act rationally.
(iv) The expected earnings of all the firms have identical risk characteristics.
(v) The cut-off point of investment in a firm is capitalisation rate.
(vi) Risk to investors depends upon the random fluctuations of expected earnings and the possibility that the actual value of the variables may turn out to be different from their best estimates.
(vii) All earnings are distributed to the shareholders.
(b) When the corporate taxes are assumed to exist. (Theory of Relevance):
Modigliani and Miller, in their article of 1963 have recognised that the value of the firm will increase or the cost of capital will decrease with the use of debt on account of deductibility of interest charges for tax purpose. Thus, the optimum capital structure can be achieved by maximising the debt mix in the equity of a firm.
According to the M & M approach, the value of a firm unlevered can be calculated as.
Value of unlevered firm= EBIT/cost of capital
Value of levered firm= Value of unlevered firm + tD
TD is the discounted present value of the tax savings resulting from the tax deductibility of the interest charges, t is the rate of tax and D the quantum of debt used in the mix.
Traditional Approach
The traditional approach, also known as Intermediate approach, is a compromise between the two extremes of net income approach and net operating income approach. According to this theory, the value of the firm can be increased initially or the cost of capital can be decreased by using more debt as the debt is a cheaper source of funds than equity. Thus, optimum capital structure can be reached by a proper debt-equity mix. Beyond a particular point, the cost of equity increases because increased debt increases the financial risk of the equity shareholders. The advantage of cheaper debt at this point of capital structure is offset by increased cost of equity. After this there comes a stage, when the increased cost of equity cannot be offset by the advantage of low-cost debt. Thus, overall cost of capital, according to this theory, decreases up to a certain point, remains more or less unchanged for moderate increase in debt thereafter; and increases or rises beyond a certain point. Even the cost of debt may increase at this stage due to increased financial risk.
Key takeaways
- Capital structure refers to the amount of debt and/or equity employed by a firm to fund its operations and finance its assets. A firm’s capital structure is typically expressed as a debt-to-equity or debt-to-capital ratio.
An ideal capital structure is crucial for an organisation. The financial manager must determine an optimum capital structure for the organisation. The determinants of capital structure of an organisation are discussed below-
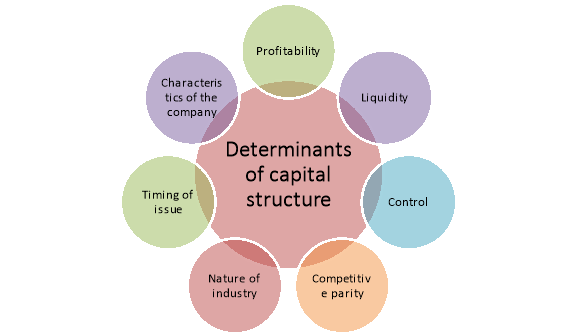
Figure: Determinants of capital structure
1. Profitability:
The key word in capital structure is leverage. It can be defined as the employment of an asset or sources of funds for which the firm has to incur a fixed cost or pay a fixed sum
2. Liquidity:
The analysis of the cash flow ability of the firm to service fixed charges is of considerable importance to carry out capital structure planning. In assessing the liquidity position of a firm in terms of its cash flow analysis, we use a ratio called the coverage ratio. It is the ratio of fixed charges to net cash inflows. It measures the coverage of fixed financial charges (interest plus repayment of principal, if any) to net cash inflows.
3. Control:
Another consideration in planning the types of funds to use is the attitude of existing management towards control. Lenders have no direct voice in the management of a company. In most cases, the power to choose the management team rests with the equity holders.
Accordingly, if the main objective of management is to maintain control, they may like to have a greater weight-age for debt and preference share in additional capital requirements. This is so because by obtaining funds through them the management sacrifices little or no control.
4. Competitive Parity:
Another factor determining a company’s optimal capital structure is the debt-equity ratios of other companies belonging to the same industry and facing a similar business risk. The rationale here is that the debt-equity ratios appropriate for other firms in a similar line of business should be appropriate for the company (under consideration) as well. The use of industry standards provides a benchmark. If a firm is deviating from its optimal capital structure, the market will give a red signal to the management that there is something wrong in the company’s debt-equity mix. If the firm is out of line, it should identify the causes of such deviation and be satisfied that the reasons are genuine.
5. The Nature of Industry:
The fifth determinant of a firm’s optimal capital structure is the nature of the industry to which it belongs. The nature of industry largely determines the degree of financial leverage the firm can carry safely without any risk of bankruptcy. If an industry’s sales are subject to periodic fluctuations, the firm should have a low degree of financial leverage. Such firms will always have high operating leverage.
6. Timing of Issue:
The question of timing of issue is also of considerable importance in determining a company’s capital structure. It is often possible to make substantial savings through proper timing of security issues. It is in the Tightness of things to make public offering at a time when the state of the economy as well as the capital market is ideal for providing the required funds.
7. Characteristics of the Company:
The nature and characteristics of the company in terms of its size, capital structure and goodwill (credit-standing) also play a very important role in determining the share of old securities and equity in its capital structure. In general, firms enjoying a higher credit-standing among investors and lenders in the capital market are in a better position to get funds from their choicest sources. If the credit-standing is poor, the firm has limited choice regarding acquisition of funds.
Key takeaways
- An ideal capital structure is crucial for an organisation. The financial manager must determine an optimum capital structure for the organisation.
Case study
Nike, Inc. Kimi Ford, a portfolio manager for NorthPoint Group, is looking for value opportunities. Specifically, Nike has caught Ford’s attention in its recent drop in share price, and she would like to know as to whether this would be a good company to add to the NorthPoint Large-Cap Fund, which Ms. Ford manages. After finding significantly conflicting conclusions from reputable analyst reports across the board, Ford decides her own independent research and forecasting will clear the air. Through a sensitivity analysis of a discounted cash flow forecast, Ms. Ford feels Nike would be a value opportunity at discount rates below 11.17%. Ford decides to delegate the task of calculating Nike’s weighted average cost of capital to Joanna Cohen, her assistant.
What is the WACC and why is it important to estimate a firm’s cost of capital? Do you agree with Joanna Cohen’s WACC calculation? Why or why not? WACC, or weighted average cost of capital, is a calculation of a company’s cost of financing proportionate to its degree of leverage. It is important to estimate a firm’s cost of capital as it serves as a type of benchmark when deciding where it would be most effective or worthwhile to deploy a company’s capital. We disagree with Joanna Cohen’s WACC calculation of 8.4% for Nike. This is due to her use of book values instead of market values in her calculation. Using a market value approach will more accurately reflect the most current opportunity cost to the company. Moreover, we noticed Joanna calculated Nike’s cost of debt by dividing the interest expense by the debt balance. We feel this calculation does not provide any meaningful information, and this approach would not be possible using only the information provided in the case study. Instead, we approach cost of debt by calculating the yield to maturity of Nike’s outstanding corporate bonds.
If you do not agree with Cohen’s analysis, calculate your own WACC for Nike and be prepared to justify your assumptions. We calculate Nike’s weighted average cost of capital to be 7.54% based on the following assumptions: Capital Structure: We started by verifying Nike’s capital structure weights. We used market values for both debt and equity. Preferred stock is given, however there is not enough information to calculate the cost of preferred stock, and its final weight is negligible regardless. Regarding debt, we used the sum of Current Portion of Long-term Debt, Notes Payable, and Market Value of long-term debt. We found MV of L.T. Debt by adjusting the book value of L.T. Debt against its current
trading price of .956 of par. Regarding equity, we simply multiplied shares outstanding by the most current price of Nike publicly traded common stock. Cost of Debt (7.17%) We calculated Nike’s cost of debt by finding the YTM of Nike’s corporate bonds. The information given includes the coupon rate of the bond, the maturity date, and the current price of the bonds. We then used the RATE function in excel while adjusting for semi-annual payments to arrive at a cost of debt of 7.17%. Cost of Equity (7.89%) We calculated Nike’s cost of equity by using the CAPM model. For the risk-free rate, we used 10-year U.S. Treasuries, as these more liquid than the also provided 10-year U.S. Treasuries. Regarding the equity risk premium, we decided to use the 2001 Implied Equity Risk Premium calculated by Aswath Damodaran of NYU Stern. We do not feel comfortable using the given 5.9% geometric mean or the arithmetic mean of 7.5% going back to 1926. Averages going back that far run the risk of being contaminated by “noise”, or variability cause by no longer relevant market environments. An example of the sensitivity of geometric mean of equity premiums can be found on page 4 of this report, and Damodaran’s risk premiums can be found here. Finally, we used the most recent market beta for Nike which is given at 0.69.
Calculate the costs of equity using CAPM, the dividend discount model, and the earnings capitalization ratio. What are the advantages and disadvantages of each method? CAPM (7.54%) CAPM is one of the most widely used models to estimate return on equity. It is very elegant in the way that it ties risk to return. This elegance comes at a cost. The degree to which the CAPM model is reliable is directly tied to the assumptions that are put into CAPM; in a sense, this is a second way in which CAPM ties risk to return. DDM (6.70%) The Dividend Discount model is also a popular tool when measuring return on equity. However, it does not account for risk in the way that beta does. In addition, DDM only uses two data points for dividends and then extrapolates the growth of those dividends at a constant rate. This type of assumption will degrade quickly over time periods of scale unless used on companies that have a very consistent track record of dividend payments as well as a solidified dividend policy. Earnings Capitalization Ratio (5.13%) We recently learned about the Earnings Capitalization Ratio and its uses. This model also does not account for risk, and it utilizes a given company’s P/E ratio and is simply [1 / (PE)]. The obvious downside to this model is the sharp variability of a company’s P/E ratio. P/E ratios are not easily forecasted, and are often most affected by investor sentiment more than fundamentals.
What should Kimi Ford recommend regarding an investment in Nike? Kimi Ford, a portfolio manager for NorthPoint Group, is looking for value opportunities. Through a sensitivity analysis of a discounted cash flow forecast, Ms. Ford feels Nike would be a value opportunity at discount rates below 11.17%. We calculated Nike’s current weighted average cost of capital to be 7.54%, which is well below the threshold required to flag this company as undervalued. Along with this value opportunity comes the financial state of the company. Ratio analysis for 200 and 2001 shows Liquidity metrics improving across the board year over year. Regarding Asset Management, metrics have overall remained constant at favorable levels, with the only change coming in Payables Turnover, which increased slightly. All of Nike’s Debt Ratios have fallen year over year, which is our most promising sign that the company will succeed in its plans to restructure in response to changing market environments. WACC, or weighted average cost of capital, is a calculation of a company’s cost of financing proportionate to its degree of leverage. It is important in estimating a firm’s cost of capital as it serves as a type of benchmark when deciding where it would be most effective or worthwhile to deploy a company’s capital. WACC is a powerful concept that is centrally significant to measuring a company’s value. One example of its application is for value investors such as NorthPoint in determining at what level of capital costs a company would be worth investing in or staying away from. Investors can then calculate what they believe the actual cost is, and compare these figures to make an investment decision. In this case, Ms. Ford’s decision should be to add Nike, Inc. To her portfolio, and to replace her assistant Joanna with an alumnus of Professor Sarmas’s FRL 440 class, who would make a more diligent and consistent analyst.
References:
1. Bhalla V.K – Financial Management – S.Chand.
2. Horne, J.C. Van and Wackowich. Fundamentals of Financial Management. 9thed. New Delhi Prentice Hall of India.
3. Johnson, R.W. Financial Management. Boston Allyn and Bacon.
4. Joy, O.M. Introduction to Financial Management. Homewood: Irwin.
5. Khan and Jain. Financial Management text and problems. 2nd ed. Tata McGraw Hill New Delhi.
6. Pandey, I.M. Financial Management. Vikas Publications.
7. Chandra, P. Financial Management- Theory and Practice. (Tata McGraw Hill).
8. Rustagi, R.P. Fundamentals of Financial Management. Taxmann Publication Pvt. Ltd.