UNIT 3
Market
Market is a place where commodities are bought and sold at a price( Wholesale or retail). A market refers to a place where buyer and seller come close to each other directly or indirectly to sell and buy goods. It also refers to place of demand and supply.
Definition
According to Prof. Behham – “We must therefore, define a market as any area over which buyers and sellers are in such close touch with one another either directly or through dealers that the prices obtainable in one part of the market affect the prices in other parts.”
Features of a market
- One commodity
- Market refers to market for a commodity. For example – tea market, cloth market, gold market
- Area
- Market refers to area of demand and supply. Where buyer and seller come together for transaction
- Buyers and sellers
- To create a market, group of potential buyers and potential sellers is needed.
- Sound monetary system
- Money exchange system be available in the market
- Knowledge of market
- Buyer and seller should have perfect knowledge of market regarding habbit, taste , etc
Types of market structure
Market structures are characterized based on the competition levels and the nature of these markets such as nature of goods, number of buyer, number of seller etc.
There are four types of market structure in an economy
|
- Perfect competition – in perfect competition, there are large number of buyers and sellers, where large number of small seller competes against each other. A single firm cannot influence the market price. So all the firms in perfect completion are price takers.
Features
- All firm only have the motive of maximize profits
- All firm sell homogenous goods
- No customer preferences
- Free exit and entry in the market
- All firms are price takers. Therefore the firms demand curves perfectly elastic
- All firm have perfect information and knowledge
2. Monopolistic competition – in Monopolistic competition there are large numbers of buyers and sellers which do not sell homogenous product unlike perfect competition. This is more realistic in the real world.
Features
- All firms maximize profit
- Free entry and exit in the market ie no barriers
- Firm sell differentiated products
- Customers have the preference of choosing products
- Seller becomes price setter
- Seller can charge marginally high price to enjoy market power
3. Oligopoly – in oligopoly there are small number of firms in the market. As per the norms, oligopoly consist of 3 -5 dominant firms. The firms can compete with each other or collaborate to earn more profits. Here the buyers are more than the sellers.
Features
- All firms maximize profit
- Barriers to entry and exit in the market. New firm finds difficulty to establish
- Consumers become price takers
- Only few firms dominate the market
- products may be homogenous or differentiated
- ability to set prices
- perfect knowledge of market
4. Monopoly – In monopoly market, single firm or one seller controls the entire market. The firm has all the market power, so he can set the prices to earn more profit as the consumers do not have any alternative.
Features
- The monopolist maximizes profits
- Monopolist set the prices
- Barriers to entry and exit
- One firm dominates the entire market
Key takeaways
- A market refers to a place where buyer and seller come close to each other directly or indirectly to sell and buy goods
- Market are of four types – perfect competition, monopolistic competition, monopoly and oligopoly
Perfect competition refers to ‘A market structure in which there are large number of buyers and sellers with a single uniforms price for the product which is determined by the forces of demand & supply.’ The price prevailing in perfect competition market is equilibrium price.
Definition:
It is identified by the existence of the many firm; they all sell an identical products an equivalent way. The supplier is the one who accepts the price."- Vilas
Such market gains when the request for product of every producer is totally elastic. Mrs Joan Robinson.
It is a market condition with an outsized number of sellers and buyers, similar products, free entry of enterprises into the industry is ideal knowledge between buyers and sellers of existing market conditions and free mobility of production factors between alternative uses. Lim Chong-ya
Characteristic of perfect competition:-
1) Large number of seller / seller are price takers: There are many potential sellers selling their commodity in the market. Their number is so large that a single seller cannot influence the market price because each seller sells a small fraction of total market supply. The price of the product is determined on the basis of market demand and market supply of the commodity which is accepted by the firms, thus seller is a price taker and not a price maker.
2) Large number of buyers: There are many buyers in the market. A single buyer cannot influence the price of the commodity because individual demand is a small fraction of total market demand.
3) Homogeneous product: The product sold in the market is homogeneous, i.e. identical in quality and size. There is no difference between the products. The products are perfect substitutes for each other.
4) Free entry and exit: There is freedom for new firms or sellers to enter into the market or industry. There is no legal, economic or any type of restrictions. Similarly, the seller is free to leave the market on industry.
5) Perfect knowledge: The seller and buyers have perfect knowledge about the market such as price, demand and supply. This will prevent the buyer from paying higher price than the market price. Similarly, sellers cannot change a different price than the prevailing market price.
6) Perfect mobility of factors of production: Factors of production are freely mobile from one firm to another or from one place to another. This ensures freedom of entry and exit firms. This also ensure that the factors cost are the same for all firms.
7) No transport cost: It is assumed that there are no transport costs. As a result, there is no possibility of changing a higher price on the behalf of transport costs.
8) Non intervention by the government: It is assumed that government does not interfere in the working of the market economy. Price is determined freely according to demand and supply conditions of the market.
9) Single Price: In Perfect Competition all units of a commodity have uniforms or a single price. It is determined by the forces of demand and supply.
Equilibrium of the firm and the industry in the short and the long runs
Equilibrium refers to when the firm has no inclination to expand or to contract its output. The producer can attain equilibrium under two situations.
- Perfect competition – the price remains constant and fixed by the industry which is accepted by the entire firm within the industry. Any quantity of commodity is sold at this price.
- Imperfect competition – under this condition, the firm has the freedom to set prices for their output. Price is not constant here, as the firm adopt independent pricing policy.
The Marginal Revenue-Marginal Cost Approach
Profit depends on revenue and cost. Thus equilibrium revolves around revenue and cost. According to the MR-MC approach, a producer is said to be in equilibrium when:
- MR = MC
- A Firm can maximise the profit when marginal revenue is equal to marginal cost
- MR is the addition to TR from the sale of one more unit
- MC is the addition to TC when an additional unit is produced.
- Thus when MR = MC, TR-TC result in maximum profit.
- If MR exceeds MC, then producer will produce more as it adds to the profit
- MC is greater than MR after the MC=MR Output Level
- MC= MR is a necessary condition, but its is not enough to ensure equilibrium. This condition happens more than one output level.
- To ensure equilibrium, it has to be supplemented by the condition that MR should be less than MC after this level
Producer’s Equilibrium when Price remains Constant
|
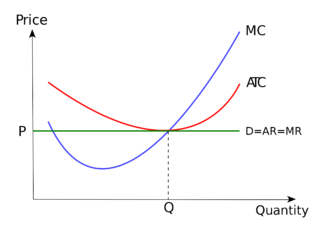
Price remains constant under conditions of perfect competition. Here price is equal to AR. When price is constant, revenue from each additional unit is equal to AR. It means AR curve is same as MR curve. The firm attains equilibrium when two condition are fulfilled , that is firm aims at producing that level of output at which MC is equal to MR and MC is greater than MR after MC = MR output level.
Producer’s Equilibrium when Price is not Constant
|
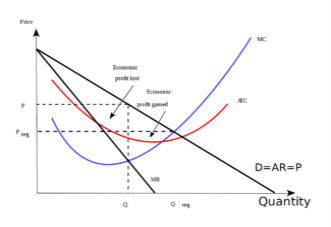
When there is no fixed price, price falls with an increase in output. The producer sells more units at a lower price. In this case MR slopes downwards. The firm aims at producing that level of output at which MC is equal to MR and MC is greater than MR.
Short run and long run supply curves
Supply curve shows the relationship between price and quantity supplied. According to Dorfman, “Supply curve is that curve which indicates various quantities supplied by the firm at different prices”.
Supply curve can be divided into two parts as:
- Short Run Supply Curve
- Long Run Supply Curve
Short run supply curve of a firm
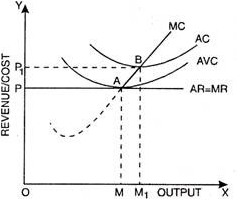
Under Short run , fixed cost remains constant, supply can be changed by changing the only the variable factors. Thus the firm has to bear fixed cost id it is shut down. Thus in short run, goods are supplied at price is either greater or equal to average variable cost. Average revenue is equal to marginal revenue under perfect competition. Hence the firm will produce at the point where marginal revenue and marginal cost are equal.
Prof. Bilas has defined it in simple words, “The Firm’s short period supply curve is that portion of its marginal cost curve that lies-above the minimum point of the average variable cost curve.”
|
From the above figure we can see that, the firm will not be covering its average variable cost, at price less than OP. At price OP, OM is the supply. MC and MR cut at point A, OM is equilibrium output. If price rise to OP1, the firm will produce OM1 output. This short run supply curve of a firm starts from A upwards i.e., thick line AB.
Long run supply curve
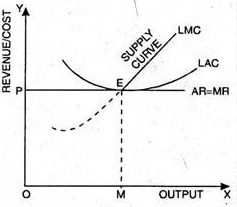
Under long run, the supply curve changes by changing all the factors of production. The firm produces only at minimum average cost in long run. In this case, long run marginal cost, marginal revenue, average revenue and long run average cost are equal. The firm enjoys normal profit.
Optimum production is the point where minimum average cost is equal to marginal cost. Long run supply curve is a portion where marginal cost curve that lies above the minimum point of the average cost curve.
|
Optimum point is the Point E, as at this point MR=LMCAR minimum LAC. The portion of LMC above point E is called long run supply curve
Key takeaways
- Perfect competition refers to a market situation in which there are a large number of buyers and sellers of homogeneous products.
- Equilibrium refers to when the firm has no inclination to expand or to contract its output.
- A Firm can maximise the profit when marginal revenue is equal to marginal cost
- Supply curve is that curve which indicates various quantities supplied by the firm at different prices
Shift in the demand curve
The shift in demand curve is when, the price of the commodity remains constant, but there is a change in quantity demanded due to some other factors, causing the curve to shift to a particular side.
Change in demand refers to increase or decrease in demand for a product due to various determinants of demand other than price.
- It is measured by shifts in the demand curve.
- The terms, change in demand means to increase or decrease in demand.
Increase and decrease in demand takes place due to changes in other factors, such as change in income, distribution of income, change in consumer’s tastes and preferences, change in the price of related goods. In this case, the price factor remains unchanged.
Increase in demand
Increase in demand refers to the rise in demand for a product at a specific price,
Decrease in demand
Decrease in demand is the fall in demand for a product at a given price.
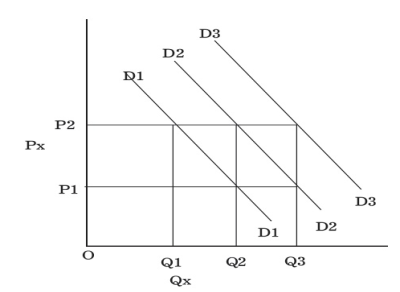
When other factors change, the demand curve changes its position which is referred to as a shift along the demand curve, which is shown in Figure.
|
Demand Curve Shift
Demand curve D2 is the original demand curve of commodity X. At price OP2, the demand is OQ2 units of commodity X.
When the consumer’s income decreases owing to high income tax, he is able to purchase only OQ1 unit of commodity X at the same price OP2. Therefore, the demand curve, D2 shifts downwards to D1.
Similarly, when the consumer’s disposable income increases due to a reduction in taxes, they are able to purchase OQ3 units of commodity X at the price OP2. Therefore, the demand curve, D2 shifts upwards to D3. Such changes in the position of the demand curve from its original position are referred to as a shift in the demand curve.
Shift in supply curve
The shift in supply curve is when, the price of the commodity remains constant, but there is a change in quantity supply due to some other factors, causing the curve to shift to a particular side.
Change in supply refers to increase or decrease in the supply of a product due to various determinants of supply other than price (in this case, price remaining constant).
- It is measured by shifts in supply curve.
- The terms, while a change in supply means an increase or decrease in supply.
Increase and Decrease In Supply
An increase in supply takes place when a supplier is willing to offer large quantities of products in the market at the same price due to various reasons, such as improvement in production techniques, fall in prices of factors of production, and reduction in taxes.
A decrease in supply occurs when a supplier is willing to offer small quantities of products in the market at the same price due to increase in taxes, low agricultural production, high costs of labour, unfavourable weather conditions, etc.
Supply curve shifts
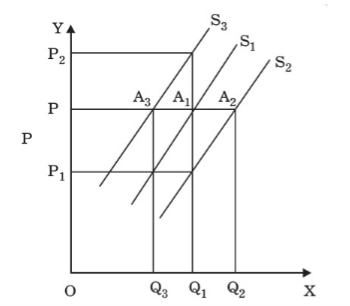
A shift takes place in supply curve due to the increase or decrease in supply, which is shown in Figure.
|
In the above Figure, an increase in supply in indicated by the shift of the supply curve from S1 to S2. Because of an increase in supply, there is a shift at the given price OP, from A1 on supply curve S1 to A2 on supply curve S2. At this point, large quantities (i.e. Q2 instead of Q1) are offered at the given price OP.
On the contrary, there is a shift in supply curve from S1 to S3 when there is a decrease in supply. The amount supplied at OP is decreased from OQ1 to OQ3 due to a shift from A1 on supply curve S1 to A3 on supply curve S3.
However, a decrease in supply also occurs when producers sell the same quantity at a higher price which is shown in Figure as OQ1 is supplied at a higher price OP2.
Key takeaways –
- Change in demand refers to increase or decrease in demand for a product due to various determinants of demand other than price.
- Change in supply refers to increase or decrease in the supply of a product due to various determinants of supply other than price
Sources
1. Lipsey, R.G. and K.A. Chrystal, Economics, Oxford Printing Press
2. Bilas, Richard A. Microeconomic Theory: A Graphical Analysis, McGraw Hill book Co.
Kogakusha co. Ltd.
3. Amit Sachdeva, Micro Economics, Kusum Lata Publishers.
4. Chopra, P.N. Micro Economics
5. Seth, M.L. Micro Economics
