Unit - 3
Electron Optics
The motion of an electron beam in a non-uniform electric field can be understood by studying Bethe’s law. The non-uniform electric field is a field in which electric intensity varies from point to point and field lines are not straight and evenly spaced. Electron motion in a non-uniform electric field is better understood with the help of equipotential surfaces.
Equipotential surfaces are those surfaces where electric potential remains constant and electric lines are perpendicular to the surface at any point. Therefore, the normal to the equipotential surface shows the line of action of the electric force on the electron.
Let us consider a uniform electric field produced in an infinitesimally thin region. This uniform electric field is set up by two metal plates charged to appropriate potentials. The electrons are allowed to pass through the electric field being set up by two closely spaced metal grids as shown in the figure.
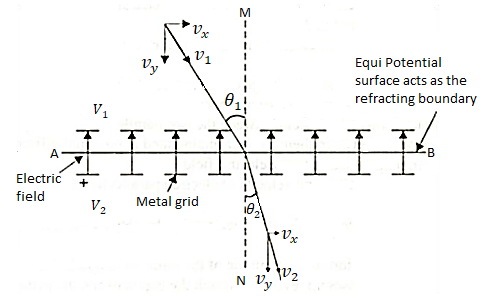
Figure: Electron Refraction
Consider an equipotential surface AB. It is considered as the boundary across which the potential V1abruptly changes to V2. Let electron travel through the region-I with a uniform velocity v1 and enter the region-II and moves with a velocity v2.
As the electrons pass through equipotential surface AB it experiences a force that alters its velocity. Because the electric field exists only in the vertical direction (Y-direction). Hence the normal component of electron velocity vy changes whereas the tangential component vx remains constant.
If V2 >V1, vy increases, and if V2<V1, vy decreases.
In the above figure, V2 > V1i. e. V2 is taken to be greater than V1and hence vy increases. The electron path is, therefore, bent nearer to the surface normal.
As the tangential component of the velocity remains constant in region-I and region-II we can write,
vx = vy

The velocity of the electron in terms of potential is given by
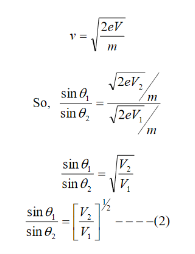
Equation (2) is similar to Snell’s law of refraction in optics and is known as Bethe’s law for electron refraction. When light enters from rarer to the denser medium it gets slowed down and bends towards the normal. However, when electrons are moving from the region of lower potential to a region of higher potential gets accelerated and bends toward the normal.
Eqn. (2) can be extended to any arbitrary electrostatic field which is non-uniform. The figure demonstrates the motion of an electron in a non-uniform electric field represented by equipotential surfaces separating equipotential regions of potentials V1, V2, V3, V4, etc.
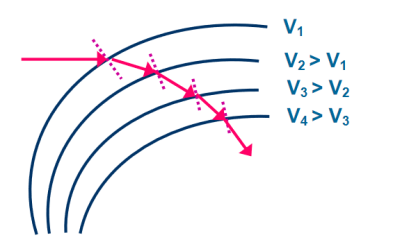
Figure: Electron Refraction in a Non -uniform Electric
At each surface electron path bends towards or away from the higher or lower potential region. It is seen that the electron motion occurs along a curved path in a non-uniform electric field.
Comparison between Snell’s Law and Bethe’s Law
Snell’s Law | Bethe’s Law |
1. It deals with the refraction of light. | 1. It deals with the refraction of electrons. |
2. A light entering from a rarer medium to a denser medium bends towards the normal. | 2. An electron entering from a region of low potential to high potential bends toward the normal (i. e. Bends toward the direction of the electric field). |
3. A light entering from a rarer medium to a denser medium decrease in velocity. | 3. An electron entering from a region of low potential to a region of high potential increases in velocity. |
  |   |
Key Takeaways
- The motion of an electron beam in a non-uniform electric field can be understood by studying Bethe’s law.
- It is similar to Snell’s law of refraction in optics
- However, when electrons are moving from the region of lower potential to a region of higher potential gets accelerated and bends toward the normal.
- Mathematically Bethe’s law is given by
 =
= 
- It is seen that the electron motion occurs along a curved path in a non-uniform electric field.
All transverse forces that vary linearly away from an axis can focus a parallel beam of particles to a common point on the axis. The parallel beam, shown in Figure, is a special case of laminar motion. Laminar flow (from lamina, or layer) implies that particle orbits at different radii follow streamlines and do not cross. The ideal laminar beam has no spread of transverse velocities. Such beams cannot be produced, but in many cases laminar motion is a valid first approximation. The derivation in this section also shows that linear forces preserve laminar flow. The radial force on particles is taken as Fr(r) = -A(z,vr) r. The paraxial electric forces obey this equation. It is not evident that magnetic forces are linear with radius since particles can gain azimuthal velocity passing through radial magnetic fields.
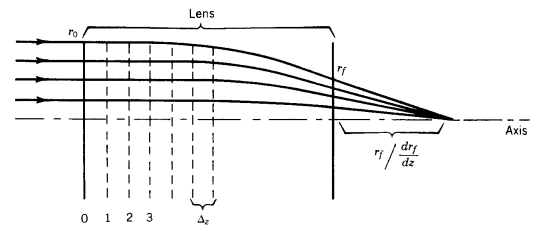
Fig: Finite difference calculation
Particle orbits are assumed paraxial; they make small angles with the axis. This means that vr « vz. The total velocity of a particle is vo 2 = vr 2 + vz 2 . If vo is constant, changes of axial velocity are related to changes of radial velocity by

Relative changes of axial velocity are proportional to the product of two small quantities in the paraxial approximation. Therefore, the quantity vz is almost constant in planes normal to z. The average axial velocity may vary with z because of acceleration in Ez fields. If vz is independent of r, time derivatives can be converted to spatial derivatives according to

Converting time derivatives to axial derivatives


A primed quantity denotes an axial derivative. The quantity r' is the angle between the particle orbit and the axis. The motion of a charged particle through a lens can be determined by a numerical solution of Eqs. (6.9). Assume that the particle has r=ro and r' = 0 at the lens entrance. Calculation of the final position, rf and angle, rf ’ determines the focal properties of the fields. Further, assume that Fr is linear and that vz(0, z) is a known function calculated from Ez(0, z). The region over which lens forces extend is divided into a number of elements of length z. The following numerical algorithm (the Eulerian difference method) can be used to find a particular orbit.

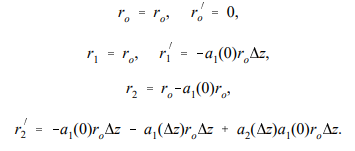
The conclusion is that any region of static, azimuthally symmetric electric fields acts as a lens in the paraxial approximation. If the radial force has the form +A(z,vz)r, the final radial velocity is positive. In this case, particle orbits form similar triangles that emanate from a point upstream. The lens, in this case, is said to have a negative focal length.
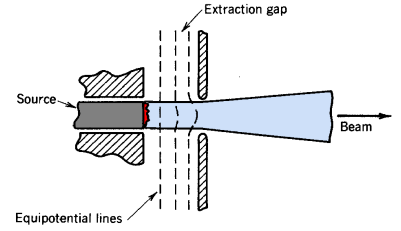
An electrostatic lens is a device that assists in the transport of charged particles. For instance, it can guide electrons emitted from a sample to an electron analyzer, analogous to the way an optical lens assists in the transport of light in an optical instrument. Systems of electrostatic lenses can be designed in the same way as optical lenses, so electrostatic lenses easily magnify or converge the electron trajectories. An electrostatic lens can also be used to focus an ion beam, for example to make a microbeam for irradiating individual cells.
The electrostatic aperture lens is an axicentered hole in an electrode separating two regions of axial electric field. The lens is illustrated in Figure 6.8. The fields may be produced by grids with applied voltage relative to the aperture plate. If the upstream and downstream electric fields differ, there will be radial components of electric field near the hole which focus or defocus particles. In Figure 6.8, axial electric fields on both sides of the plate are positive, and the field at the left is stronger. In this case, the radial fields point outward and the focal length is negative for positively charged particles traveling in either direction. With reversed field direction (keeping the same relative field strength) or with stronger field on the right side (keeping the same field polarity), the lens has positive focal length.

Fig.: Electrostatics aperture lens (a) Geometry (b) Electro potential lens
The transverse impulse on a particle passing through the hole is proportional to the time spent in the radial electric fields. This is inversely proportional to the particle velocity which is determined, in part, by the longitudinal fields. Furthermore, the final axial velocity will depend on the particle direction. These factors contribute to the fact that the focal length of the aperture lens depends on the transit direction of the particle, or f1 ≠ f2. Radial electric fields are localized at the aperture. Two assumptions allow a simple estimate of the focal length: (1) the relative change in radius passing through the aperture is small (or, the aperture is treated in the thin lens approximation) and (2) the relative change in axial velocity is small in the vicinity of the aperture. Consider a particle moving in the +z direction with vr = 0. The change in vr for nonrelativistic motion is given by the equation

In this, the time derivative was converted to a spatial derivative and Er was replaced according to Eq. With the assumption of constant r and vz in the region of nonzero radial field, Eq. Can be integrated directly to yield

Where vza is the particle velocity at the aperture and vrf is the radial velocity after exiting. The quantity vzf is the final axial velocity; it depends on the final location of the particle and the field Ez2. The focal length is related to the final radial position (r) and the ratio of the radial velocity to the final axial velocity by vrf/vzf ≈ r/f.
The focal length is

When the particle kinetic energy is large compared to the energy change passing through the lens, vza ≈vzf, and we find the usual approximation for the aperture lens focal length

CRT (Cathode Ray Tube):
A Cathode Ray Tube (CRT) is a specially constructed vacuum tube in which an electron beam controlled by electric or magnetic fields generates a visual display of input electrical signals on a fluorescent screen.
Construction
It consists of three important parts,
i) Electron Gun
Ii) Deflection System
Iii) Fluorescent Screen
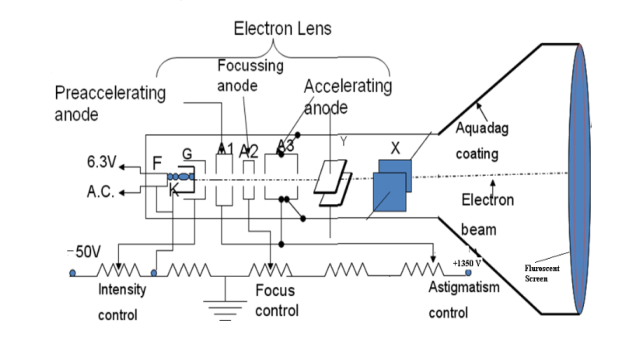
Figure: CRT (Cathode Ray Tube)
The CRT resembles a horizontally placed conical flask sealed at its open end.
The electron gun consisting of several electrodes is mounted at one end of the tube as a single unit and electrical connections are given to them through base pins. The deflection system consists of two pairs of parallel metal plates mounted in the neck of the tube. They are oriented in such a way that they are in mutually perpendicular directions to the axis of the CRT. The screen consists of a thin coating of phosphors deposited on the inner face of the wide end of the glass envelope. The inner surface of the flare of the envelope is coated with conductive graphite called acquadag. A power supply provides the required potentials to the various elements of CRT.
Working
In the CRT, the electron gun generates an electron beam, focuses it, and accelerates it towards a fluorescent screen located at the further end of the tube. The electron beam may be moved to any spot on the screen with the help of a deflection system.
I) Electron Gun: The indirectly heated cathode K emits a stream of electrons from its coated front face. The electrons pass through the control grid G held at a negative potential. The effective size of the aperture in the grid varies depending upon the potential difference between grid and cathode. The intensity of the glow produced at the screen is determined by the number of electrons striking the screen. Therefore, by varying the negative dc voltage on the grid, the intensity of the luminous spot on the screen is controlled. The grid bias is usually varied between 0 to -50V. The anodes A1 and A3 are internally connected and held at a higher positive potential of a few kilovolts and A2 is maintained at a relatively low positive potential. The anode A1 accelerates the incoming electrons. The Grid G and anode A1 forms the first lens system which refocuses the electron beam. The anode A2 and A3 constitute the second lens system which focuses the electron beam to a fine point on the fluorescent screen. The focus of the beam is adjusted by varying the positive potential on A2. The anode A3 imparts further acceleration to the electrons as they emerge out of the electron gun.
II) Deflection System: There are two types of deflection system namely electrostatic type and electromagnetic type.
In the electrostatic deflection system, two pairs of metal plates are employed for deflecting the electron beam. The two plates in each pair are aligned strictly parallel to each other as shown in the figure and the two pairs of plates are mounted at right angles to each other and also at right angles to the path of electrons.
One pair of plates is arranged horizontally. When a potential difference is applied to the plates then the uniform electric field is produced in the vertical direction. The fields act perpendicular to the beam and deflect the beam vertically, so these are called vertical deflecting plates or Y-plates.
The second set of plates is oriented vertically and produces the uniform horizontal field when a potential difference is applied between them. The field acts normal to the beam and deflects the beam horizontally so this set of plates is called horizontal deflection plates or X-plates.
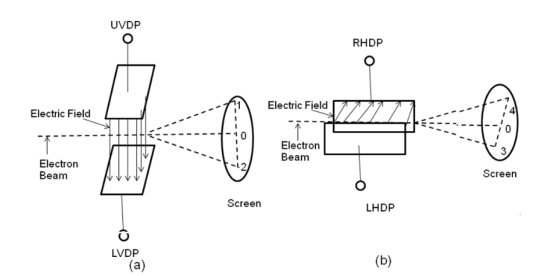
Figure: Electron beam deflection (a) Vertical deflection (b) Horizontal Deflection
When voltages are not applied to X-plates and Y-plates, the electron beam travels along the CRT axis and strikes the geometrical centre of the viewing screen. When a dc voltage is applied to Y-plates, the electron beam gets deflected vertically and when a dc voltage is applied to the X-plates, the electron beam is deflected horizontally as shown in figures. The amount of deflection depends on the magnitude of the applied voltage. When dc voltages are applied to both the X and Y plates, the electron beam will be acted upon simultaneously by two forces due to vertical and horizontal electric fields and gets deflected along the direction of their resultant is shown in fig. Thus, by varying the dc voltages of the vertical and horizontal planes, the luminous spot may be moved to any position in the plane of the screen.
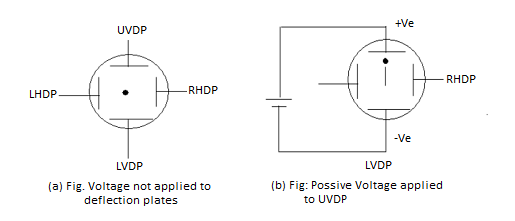
Figure (a) Voltage not applied to deflection plates (b) Positive voltage applied to UVDP
III) Fluorescent Screen: The interior surface of the circular front face of the CRT is coated with a thin translucent layer of phosphors. The phosphor coating glows at the point where it is struck by the high energy electron beam. At that spot, the coating continues to glow for a short period even after the electron beam moves away. So electron beam position can be located with the help of a fluorescent screen.
Aquadag Coating
Electrons impinging on the screen tend to charge it negatively and repel the electrons arriving afterward it will reduce the number of electrons reaching the screen leading to a decrease in the brightness of the glow. Therefore, the electrons are to be conducted away. Similarly, the cathode assumes gradually a positive charge as electrons are emitted from it in large numbers. It again leads to a reduction in the intensity of the glow on the screen. Therefore, the cathode is to be replenished with electrons. This is accomplished by the Aquadag coating. The inner surface of the flare of the glass envelope of CRT is coated with conductive graphite coating called Aquadag. It is used to complete the circuit from screen to cathode. The electrons striking the fluorescent screen not only causes the emission of light but also produce secondary emission of electrons. The secondary electrons are attracted by the Aquadag coating which is electrically connected to anode A3. The electrons are restricted to the cathode through the ground.
The electrostatic CRT is used in CRO as a display device and study of waveforms.
Key Takeaways
- The electrostatic CRT is used in CRO as a display device and study of waveforms.
- A Cathode Ray Tube (CRT) is a specially constructed vacuum tube in which an electron beam controlled by electric or magnetic fields generates a visual display of input electrical signals on a fluorescent screen.
- It consists of three important parts: Electron Gun, Deflection System, Fluorescent Screen
Cathode Ray Oscilloscope
Cathode Ray Oscilloscope is a very important electronic measuring instrument that is used to display and measure electrical signals, time intervals, and phase shift between two electrical signals. Non-electrical quantities such as pressure, strain, and temperature can be measured by first converting them into an equivalent voltage using an appropriate transducer.
Any CRO consists of the following seven major sections
i) Cathode Ray Tube (CRT)
Ii) Time base circuits
Iii) Trigger circuits
Iv) Vertical Circuits
v) Horizontal Circuits
Vi) High Voltage Power Supply
Vii) Low Voltage Power Supply
The arrangement of these sections in a CRO is shown in fig in the form of a Block diagram.
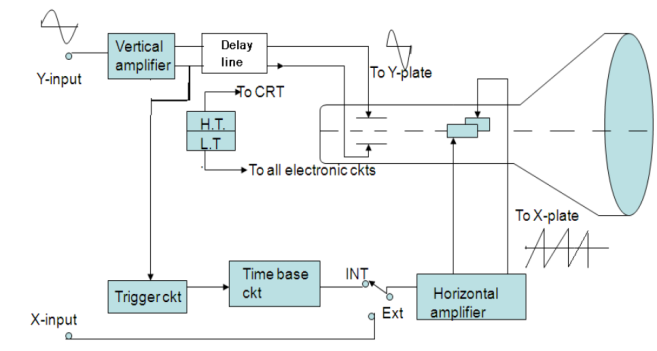
Figure: Block diagram of CRO
CATHODE RAY TUBE (CRT)
A cathode-ray tube with electrostatic deflection forms the central part of a CRO. The CRT generates the electron beam, focuses it, and accelerates it towards the fluorescent screen.
The rest of the sections are electronic circuits that cause the desired movement of a luminous spot on the screen. In its action, the electron beam is similar to a pen. It writes on the fluorescent screen in the form of a bright trace. Writing on paper involves two motions i. e. Horizontal motion of the pen sweeping across the page and other is vertical motion of the pen indicating the message. The electron beam should be made to move both horizontally and vertically. A transparent graph called graticule marked in centimeter lines (divisions) both vertically and horizontally is attached to the face of the CRT for making measurements. When a signal is to be displayed, it is applied to the Y-plates of CRO by connecting it to the Y input of CRO.
For example, let the signal be a simple harmonic wave. Because of the application of the signal to the Y plates, the luminous spot moves up and down on the screen at the same frequency as that of the applied voltage. The successive positions of the spot can be seen as shown in fig. 10(a)., when the frequency of the signal is less than about 20 Hz. At higher frequencies, the path of the beam is seen as a vertical line (fig 10b). This is due to the persistence of vision and the fluorescence of the coating. The luminous line is called a trace. The length of the vertical trace corresponds to the peak to the peak value of applied voltage.
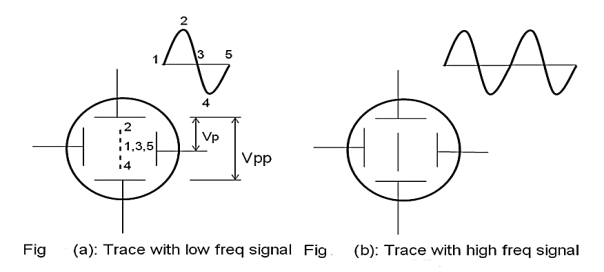
Figure: (a) Trace with low frequency signal (b) Trace with high frequency signal
II) TIME BASE CIRCUIT
The faithful display of the signal variation by the electron beam requires the beam to move horizontally at a uniform rate across the screen, covering equal distances in equal intervals of time. This condition is satisfied by ramp voltage or saw tooth voltage. The ramp voltage is generated by Time Base Circuit.
The time base circuit consists of a time base generator. The time base generator is a variable frequency oscillator that produces an output voltage of sawtooth shape.
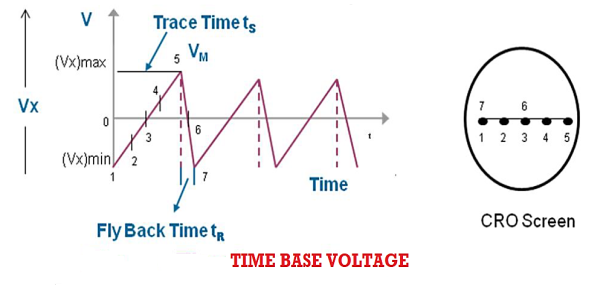
Figure: Time base voltage
To obtain a visual display of the waveform of applied voltage, it is necessary to apply this A. C. Voltage to one set of the deflection plates say Y-plates, and the other time base voltage or ramp voltage, generated by time base generator, to X-plates.
This time base voltage is periodic and its frequency can be varied. This voltage increases linearly with time and after reaching a maximum value (Vx)max, it suddenly drops to minimum value (Vx)min. When this voltage is applied to the horizontal deflection plates, the luminous spot sweeps the face of the screen at a uniform velocity from the left edge to the right edge depending on the polarity of the voltage. Because of this reason ramp voltage is also called sweep voltage. The deflection of the spot becomes maximum when the voltage reaches the value (Vx)max after which the spot suddenly returns to its original position. If the frequency of the time base voltage is sufficiently high the trace of the spot appears as a straight line.
Due to the resemblance of sweep voltage to teeth of a saw, it is also called saw-tooth voltage.
Sweep Time or Trace Time (ts):
The time taken by the sweep voltage to rise from its maximum negative voltage to its maximum positive voltage is called sweep time or a trace time tS.
Retrace Time or Flyback Time (tr):
The time taken by the sweep voltage to dip from its maximum positive voltage to its maximum negative voltage is called retrace time or fly back time tR.
Sweep Period (Tsweep):
The sum of sweep time and retrace time constitutes the sweep period Tsweep.
Tsweep= ts+ tr ≈ ts
Blanking:
The retrace path, if seen on the screen, gives a bad visual effect. By making the retrace time equal to zero, the retrace path can be eliminated. The trace during the flyback time or retrace time can be made invisible by applying a high negative voltage pulse to the control grid in the electron gun which turns off the electron beam momentarily. The process of making a retrace path invisible is known as Blanking of the trace.
Display of the signal shape:
As the signal is applied to the Y-plates and time base voltage (sweep voltage) to the X-plates, the electron beam is simultaneously subjected to two forces acting in a perpendicular direction. The deflection of the beam at any instant is determined by the resultant of these two forces. Referring to the below fig it is seen that
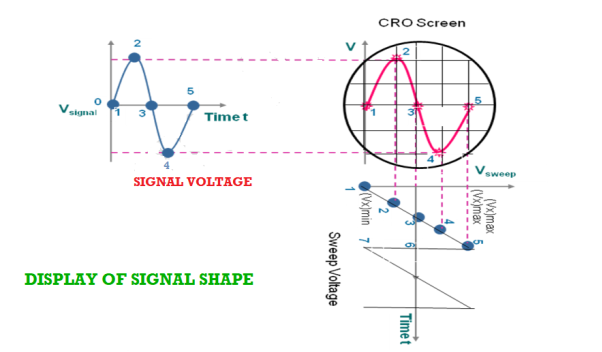
Figure: Display of signal shape
- At any instant 1, the input signal (signal voltage) is zero and sweep voltage is (Vx)min, the resultant of the forces due to them acts along the left direction and the beam is deflected to the left extreme.
- At instant 2, the signal amplitude is positive and the sweep voltage is at a lesser negative value. The beam is deflected left upward in the second quadrant of the screen.
- At instant 3, both the input and sweep voltages are zero. The resultant force is zero and the beam stays at the centre of the screen.
- At instant 4, the signal amplitude is negative and the sweep voltage is positive. The beam is deflected to right down in the fourth quadrant of the screen.
- At instant 5, the signal voltage is zero, and the sweep voltage is (vx)max, the electron beam is deflected toward the right extreme along the horizontal direction. Then the beam returns to position 1 and the process repeats.
- By joining the resultant positions of the spot, it is seen that waveform of the input voltage is faithfully displayed.
III) TRIGGER CIRCUIT
To display a stationary wave pattern on the CRO screen, the horizontal deflection should start at the same point of the input signal in each sweep cycle. When it occurs, it is said that the horizontal sweep voltage is synchronized with the input signal. If the sweep and signal voltages are not synchronized a standstill pattern is not displayed on the screen; the wave pattern moves continuously to the right or left of the screen.
Thus, synchronization is the method of locking the frequency of the time base generator to the frequency of the input signal so that a stationary display of wave pattern is seen on the CRO screen. The signal will be properly synchronized only when its frequency equals the sweep frequency or submultiple of sweep frequency. That is
fsignal = n fsweep
 =
= 
 =
= 
As an example, if the sweep frequency is 50Hz and the signal frequency is 50Hz, one wave is displayed on the screen. On the other hand, if the sweep frequency is 50Hz and the signal frequency is 100Hz, the period of sweep voltage is 20ms, and the period of the signal is 10ms.
In the sweep time which is horizontal trace length, the signal goes through two complete cycles. As a result, the two cycles of the signal voltage are displayed on the screen.
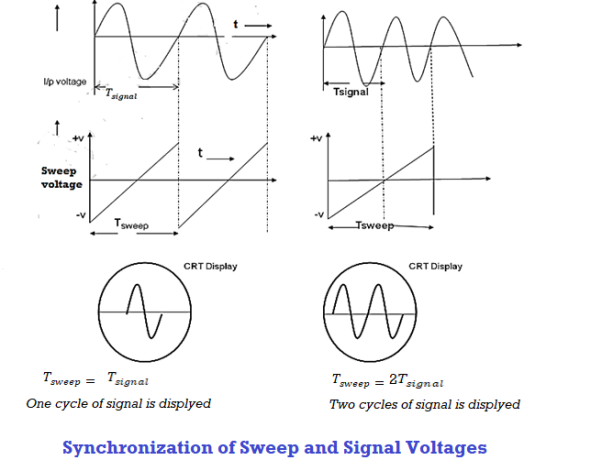
Figure: Synchronization of sweep and signal voltages
One of the methods of achieving synchronization is the use of a trigger circuit. The trigger circuit initiates the time base so that the horizontal deflection sweeps in synchronization with the vertical signal. For this, a delay line circuit is used which delays the signal before it reaches y-deflecting plates. A part of the output obtained from the vertical amplifier is fed to the trigger generator.
The trigger generator is sensitive to the level of the voltage applied at its input. The circuit monitors the input signal and detects the point when it reaches the selected level while moving towards the selected polarity. When the predetermined level is reached the circuit produces a trigger pulse. This trigger pulse is fed to the time base generator and it acts as a command signal to the time base generator and starts one sweep cycle of the time base.
The sweep voltage is not developed in the trigger mode if the input signal is not given. A portion of the trigger pulse is fed to a second circuit, which produces an unblanking bias voltage to bring the grid of CRT to a potential, which allows the electron beam to appear. Thus a stationary display of the wave is seen only above a predetermined level of the input voltage. It happens in each cycle. Because the signal voltage is initiating the sweep cycle, both voltages will be synchronized. By proper adjustment of controls, the trigger pulse may be made to originate when the input signal is going positive or negative or at any particular voltage level. However, in AUTO trigger mode the trigger circuit will automatically provide a trigger pulse to the sweep generator even when the input signal is not applied to it and the horizontal trace is seen even without signal at Y-input.
IV) VERTICAL CIRCUITS:
The vertical circuits mainly consist of an attenuator and a voltage amplifier. The signal is applied at the Y-input. It goes to the input of the attenuator. The signal amplitude is increased or decreased by changing the amount of attenuation and then fed to the input of the voltage amplifier so that adequate deflection is obtained on the screen.
V) HORIZONTAL CIRCUITS:
The sweep generator output cannot directly drive the horizontal plates. Therefore, it must be initially amplified. The horizontal circuits mainly consist of a voltage amplifier. When the sweep selector switch is in the ‘INT’ position, the sweep voltage is applied to the horizontal amplifier. The output of the amplifier is fed to the X-plates and a linear trace is produced on the CRO screen. When the sweep selector switch is held in the ’EXT’ position the horizontal amplifier input is disconnected from the internal sweep generator and is instead connected to the horizontal input jack. In this position, the electron beam remains stationary and produces a luminous spot on the CRO screen.
VI) LOW VOLTAGE POWER SUPPLY
The low voltage power supply powers the electronic circuits such as amplifiers, time base generator, trigger circuit. It gives an output of the order of few tens to a few hundreds of volts.
VII) HIGH VOLTAGE POWER SUPPLY
The high voltage power supply provides voltages to anodes in the electron gun assembly. It supplies voltages of the order of 1600V to 2200V.
DELAY LINE
All electronic circuitry in the CRO causes a certain amount of time delay in the transmission of signal voltages to the deflection plates. Comparing the vertical and horizontal circuits in the CRO block diagram, we obtain that a portion of the output signal applied to the vertical CRT plates triggers the horizontal signal. Signal processing in the horizontal circuit consists of generating a trigger pulse that starts the time base generator (sweep generator) then the output of this is given to the horizontal amplifier and then to the horizontal plates. This whole process takes time. The signal of the vertical CRT plates must therefore be delayed by the same amount of time to reach the signal at the same instant as that of a horizontal one. This is the function of the delay line.
Key Takeaways
- Cathode Ray Oscilloscope is a very important electronic measuring instrument which is used to display and measure electrical signals, time intervals and phase shift between two electrical signals.
- Non-electrical quantities such as pressure, strain and temperature can be measured by first converting them into an equivalent voltage using an appropriate transducer.
- Any CRO basically consists of the following seven major sections - Cathode Ray Tube (CRT), Time base circuits, Trigger circuits, Vertical Circuits, Horizontal Circuits, High Voltage Power Supply, Low Voltage Power Supply
- Delay line is because of the electronic circuitry in the CRO causes a certain amount of time delay in the transmission of signal voltages to the deflection plates.
APPLICATIONS OF CRO
The cathode ray oscilloscope is an electronic test instrument; it is used to obtain waveforms when the different input signals are given. In the early days, it is called an Oscillograph. The oscilloscope observes the changes in the electrical signals over time, thus the voltage and time describe a shape and it is continuously graphed beside a scale. By seeing the waveform, we can analyze some properties like amplitude, frequency, rise time, distortion, time interval, etc.
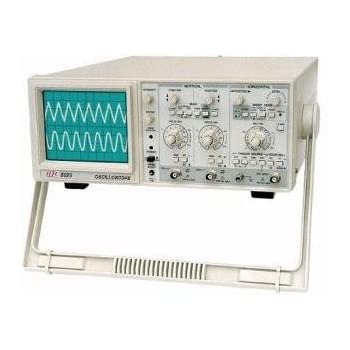
Figure: CRO
The main applications of CRO are to observe the properties of electrical and electronic signals, oscillation distortion testing, the frequency response of signals, etc. The important uses of CRO are the measurement of voltage, current, frequency, etc.
Application of CRO
1. There are huge applications of CRO in Radio stations. Indeed, our conventional CRO is not used in those radio stations but they almost the same as our conventional CRO. The CROs are used in the radio station to observe the sending and receiving signal properties.
2. CRO helps to view the characteristics and property of a signal that is why it also helps to control the analog signals.
3. The shape of voltage and current waveform can be observed by CRO which helps to take the necessary decision in a radio station or communication station.
4. CRO is used for research purposes. When scientists are designed a new circuit, they check the voltage, current waveforms of each part of the circuit using the Cathode Ray Oscilloscope.
5. CRO is used with the resonance circuit to observe the bandwidth, wave shape, etc.
6. CRO is also used to observe the characteristics of Amplitude Modulation Circuits, Frequency Modulation Circuits, etc.
USE OF CRO (CATHODE RAY OSCILLOSCOPE)
The CRO is a versatile electronic instrument and it is used in measuring a variety of electrical parameters.
a) Study of the Waveforms: CRO is widely used in maintenance and troubleshooting where the wave shapes of voltages in different electronic circuits are to be examined. The signal under study is applied at the Y-input terminal and the sweep voltage is internally applied to X-plates. The size of the figure displayed on the screen may be adjusted suitably by adjusting the gain control.
b) Measurement of D. C. Voltages: The D. C. Voltage understudy is applied at Y-input. The trace gets deflected upward or downward depending upon the polarity of the applied voltage. The deflection of the spot produces on the screen can be measured and by multiplying it with the deflection sensitivity (volts/div), the magnitude of unknown voltage can be obtained.
c) Measurement of A. C. Voltages: For this measurement, the trace is to be adjusted at the centre of the screen, and the A. C. Voltage understudy is applied at Y-input. The peak-to-peak distance is measured and by multiplying it with deflection sensitivity (volts/div), peak to the peak value of applied A. C. Voltage can be calculated. The rms value and average value of the voltage are calculated using the formulae,
VP = 
Vrms 
Vaver = 0. 636 VP
d) Measurement of Current: We can measure the value of current or magnitude and direction of current using CRO. By calculating the amplitude variation, horizontal and vertical cells in the CRO screen we can measure the current. We can measure both AC and DC in CRO.
For this measurement, the current has to be passed through the suitable known resistor and the potential developed across it can be measured as has been explained above. The current may then be calculated. However, if the cathode ray oscilloscope having a magnetic deflection system, the currents may be measured by passing it through one of the deflection coils.
e) Measurement of Frequency:
We not only measure voltage and current using CRO, but we can also measure the frequency of a signal by calculating the period. Once we measure the period of a signal then we can easily measure the frequency. The measurement of the period using CRO also very easy.
1) Calibration Method: A sinusoidal signal whose frequency is to be determined is applied to Y-input. The time base control is adjusted to obtain 2 or 3 cycles of the signal on the screen. The horizontal spread of one cycle is noted. By multiplying it with the time base sensitivity (time/div), the period of the signal is obtained. The reciprocal of the period gives the frequency of the signal.
2) Lissajous Method: Alternatively, the frequency of a test signal can be determined using Lissajous patterns. When two sine waves oscillating in mutually perpendicular planes are combined, different types of closed-loop patterns are obtained. They are called Lissajous patterns in honour of the French physicist Lissajous. The signal of unknown frequency is applied to vertical input (Y) and a voltage of known frequency obtained from the standard variable frequency generator is given to horizontal input (X). The frequency of this frequency generator can be varied until a suitable stationary Lissajous figure is obtained. Knowing the frequency from the frequency generator and counting the number of tangency points along horizontal and vertical axes, the unknown frequency can be determined. If fY and fX are the unknown and known frequencies of the sinusoidal voltage fed to the vertical and horizontal plates of CRO respectively and nx and ny are the number of tangency points along the X and Y-axis respectively then the unknown frequency is calculated from
 ………(1)
Where fx is the known frequency. Examples of measurements are:
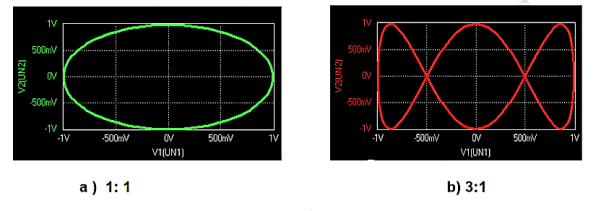
Figure: Measurement of Frequency
f) Measurement of phase difference:
Most of the CROs have two channels. We can apply two different signals at a time on the CRO. And we can measure easily the phase difference between the two different signals. Lissajous figures in the CRO screen help us to measure the phase difference between two signals. Using this method we can also measure the frequency of two signals at a time.
(i) Dual Sweep Method: It requires a dual trace CRO. The phase relationship between two sinusoidal signals of the same frequency may be directly measured by displaying both waveforms on the CRO screen and determining the delay time between the two waveforms.
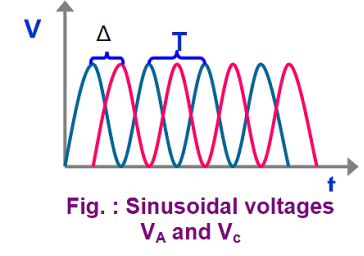
Figure: Measurement of phase difference
The sensitivity and trigger controls of each channel are adjusted for two stationary sinusoidal signals. The sweep speed is initially adjusted such that the period T of the sine wave is measured. Then the sweep speed is increased and the delay time Td between the two sine waves is accurately determined. The difference is calculated using the relation
= 
(ii) Lissajous Pattern Method: A second method for determining the phase difference of two sine waves of the same frequency is to feed one sine wave to vertical input and another sine wave to horizontal input. The sweep selector switch is kept in EXT position. A Lissajous pattern namely an ellipse is obtained on the screen. By measuring the lengths A= 2Y1and B=2Y2 of the elliptical
= sin-1(  )
)
Pattern the phase shift is calculated.
= sin-1 
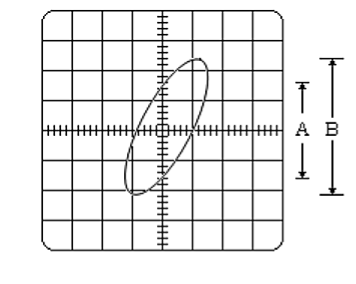
Figure: Lissajous Pattern Method
Key Takeaways
- The main applications of CRO are to observe the properties of electrical and electronic signals, oscillation distortion testing, the frequency response of signals, etc. The important uses of CRO are the measurement of voltage, current, frequency, etc.
- The CRO is a versatile electronic instrument and it is used in measuring a verity of electrical parameters such as Study of the wave forms, Measurement of D.C. Voltages, A.C. Voltages, Current, Frequency and phase difference.
Bainbridge mass spectrometer is an instrument used for the accurate determination of atomic masses.
PRINCIPLE
Uniform magnetic field acting normal to the path of ions having same velocity deflects the ions of different masses from a straight path to circular path of different radii.
CONSTRUCTION
(i) Ionization Chamber
Ionization chamber is used to ionize the gas whose mass or isotope is to be determined and positive ions are produced.
(ii) Velocity Selector
Velocity selector has two fields electric and magnetic field both are applied perpendicular to the moving ion beam. A potential (V) is applied between two electrodes to produce the electric field. A magnetic field (strength B) is applied at right angles to the electrostatic field and so the electrostatic and electromagnetic forces act in opposite directions to each other. A velocity selector is used to produce a monovelocity ion beam and a transverse magnetic field is employed to discriminate between ions of different masses.
(iii) Vacuum / Analyzing Chamber
Vacuum / Analyzing Chamber is a semi-spherical cavity in which another magnetic field B’ is applied perpendicular to the moving positive ion.
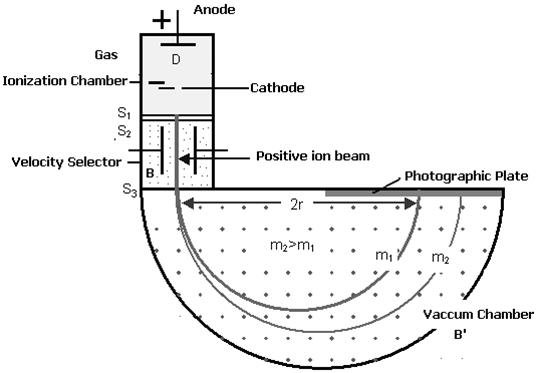
Figure: Bainbridge Mass Spectrograph
WORKING
Atoms with one or more electrons removed, have a net positive charge and they become positive ions. A beam of positive ions produced in a discharge tube is collimated into a fine beam by two narrow slits S1and S2 . This fine beam enters into a velocity selector.
The velocity selector allows the ions of a p articular velocity to come out of it, by the combined action of an electric and a magnetic field. The velocity selector consists of two plane parallel plates P1 and P2, which produces a uniform electric field E and an electromagnet, to produce uniform magnetic field B (represented by the dotted circle). These two fields are at right angles to each other and to the direction of the beam.
The electric field and magnetic field are so adjusted that the deflection produced by one field is nullified by the other, so that the ions do not suffer any deflection within the velocity selector.
Ions are formed in ionization chamber and pass through the cathode, then through collimating slits S1 and S2. The beam is then passed through velocity selector in which electric and magnetic fields are applied perpendicular to each other. The ion moves in straight line path for which both the forces acting on it are equal
Let E and B be the electric field intensity and magnetic induction respectively and q be the charge of the positive ion. The force exerted by the electric field is equal to qE and the force exerted by the magnetic field is equal to qvB where v is the velocity of the positive ion.
QE =qvB
The velocity of ion which passes undeflected through the velocity selector is
v = E/B
In the vacuum chamber the ions are affected by the magnetic field (B’) alone and so move in circular paths, the lighter ions having the larger path radius. If the mass of an ion is M, its charge q and its velocity v then
QvB’ =Mv2 /R
R =Mv/qB’
So radius of path is directly proportional to mass of the ion i.e. R ∝ M
Further substitute the value of v
R =ME/qBB’ or M =RqBB’/E
Ions with different masses trace semi-circular paths of different radii and produce dark lines on the plate. The distance between the opening of the chamber and the position of the dark line gives the diameter 2R from which radius R can be calculated.
Since, B,B′,E and R are known, the mass of the positive ions and hence isotopic masses can be calculated.
A cyclotron is a machine that accelerates charged particles or ions to high energies. It was invented to investigate the nuclear structure by E.O Lawrence and M.S Livingston in 1934. Both electric and magnetic fields are used in the cyclotron to increase the energy of the charged particles. As both the fields are perpendicular to each other, they are called cross fields.
In a cyclotron, charged particles accelerate outwards from the centre along a spiral path. These particles are held to a spiral trajectory by a static magnetic field and accelerated by a rapidly varying electric field.
Working
- A cyclotron accelerates a charged particle beam using a high frequency alternating voltage which is applied between two hollow “D”-shaped sheet metal electrodes known as the “dees” inside a vacuum chamber.
- The dees are placed face to face with a narrow gap between them, creating a cylindrical space within them for particles to move. Particles are injected into the center of this space.
- Dees are located between the poles of electromagnet which applies a static magnetic field B perpendicular to the electrode plane.
- The magnetic field causes the path of the particle to bend in a circle due to the Lorentz force perpendicular to their direction of motion.
- An alternating voltage of several thousand volts are applied between the dees. The voltage creates an oscillating electric field in the gap between the dees that accelerates the particles.
- The frequency of the voltage is set so that particles make one circuit during a single cycle of the voltage. To achieve this condition, the frequency must be set to particle’s cyclotron frequency.
Expression for Cyclotron Frequency
f=qB2πm
B is the magnetic field strength
q is the electric charge of the particle
m is the relativistic mass of the charged particle
Expression for Particle Energy
The energy of the particles depends on the strength of the magnetic field and the diameter of the dees.
The centripetal force required to keep the particles in a curved path is given by the formula:
Fc=mv2r
The force is provided by the Lorentz’s force FB on the magnetic field B
FB=qvB
Equating these equations, we get
Mv2r=qvB
v=qBRm
Hence, the output energy of the particles is given by the expression
E=q2B2R22m
Example:
A cyclotron has an oscillator frequency of 10 MHz. What should be the operating magnetic field for accelerating protons? Also, calculate the kinetic energy (in MeV) of the proton beam produced by the accelerator. (e = 1.60 × 10⁻¹⁹ C, mp = 1.67 × 10⁻²⁷ kg, 1 MeV = 1.6 × 10⁻¹³ J)
Solution:
The oscillator frequency should be equal to the proton’s cyclotron frequency.
We use the following formula to find the strength of the magnetic field:
B=2πmvq
Substituting the values in the above equation, we get
B=6.3×1.67×10−27×1071.6×10−19=0.66T
The final velocity of the proton can be calculated using the following formula:
v=r×2π
Substituting the values in the above equation, we get
v=0.6×6.3×107=3.78×10⁷m/s
To find the kinetic energy of the proton, we use the following formula:
E=12mv2
Substituting the values in the above equation, we get
E=1.67×10−27×14.3×10142×1.6×10−13=7MeV
The kinetic energy of the proton beam produced by the accelerator is 7 MeV.
References:
- LASERS: Theory and Applications: Thyagarajan K and Ghatak A.K.
- Nanomaterials & Nanotechnologies and Design: M.F.Ashby, Paulo Ferreira and Daniel L.Schodek, Elsevier Publications.
- University Physics: Young and Freedman (Pearson Education).
- Optics: Jenkins and White (Tata Mcgraw Hill)