Unit - 4
Digital Modulation Techniques
Digital Data transmission
The communication that occurs in our day-to-day life is in the form of signals. These signals, such as sound signals, generally, are analog in nature. When the communication needs to be established over a distance, then the analog signals are sent through wire, using different techniques for effective transmission.
The Necessity of Digitization
The conventional methods of communication used analog signals for long distance communications, which suffer from many losses such as distortion, interference, and other losses including security breach.
In order to overcome these problems, the signals are digitized using different techniques. The digitized signals allow the communication to be clearer and more accurate without losses.
The following figure indicates the difference between analog and digital signals. The digital signals consist of 1s and 0s which indicate High and Low values respectively.
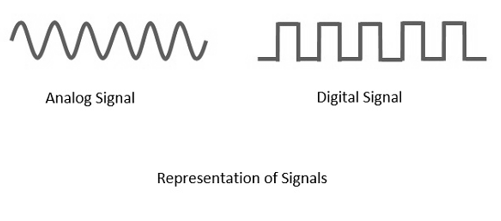
Fig. 1: Signals
Key Takeaways:
- The communication that occurs in our day-to-day life is in the form of signals. These signals, such as sound signals, generally, are analog in nature.
- The conventional methods of communication used analog signals for long distance communications, which suffer from many losses such as distortion, interference, and other losses including security breach.
Amplitude Shift Keying (ASK)
In ASK, the amplitude of the signal is varied to represent the signal levels, while frequency and phase remains constant. In order to represent 0 and 1, two different amplitudes are used.
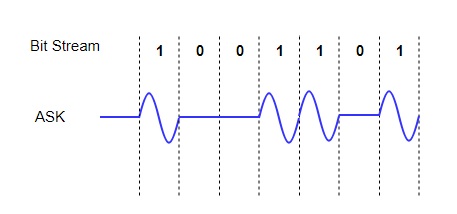
Fig. 2: ASK
Phase Shift Keying (PSK)
In this, the phase of the carrier signal is modulated to represent the signal levels, while amplitude and frequency remains constant.
Binary Phase Shift Keying (BPSK) is the simplest form of PSK where there are two signal elements represented by two different phases.
In Quadrature PSK (QPSK), two bits of information are transmitted per symbol by using four different phases.
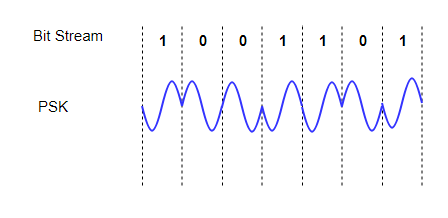
Fig. 3: PSK
Key Takeaways:
- In ASK, the amplitude of the signal is varied to represent the signal levels, while frequency and phase remains constant.
- In FSK, the frequency of the signal is modulated to represent the signal levels, while amplitude and phase remains constant.
- In PSK, the phase of the carrier signal is modulated to represent the signal levels, while amplitude and frequency remains constant.
Frequency Shift Keying (FSK)
In FSK, the frequency of the signal is modulated to represent the signal levels, while amplitude and phase remains constant.
To represent the signal levels 0 and 1, two different frequencies are used.
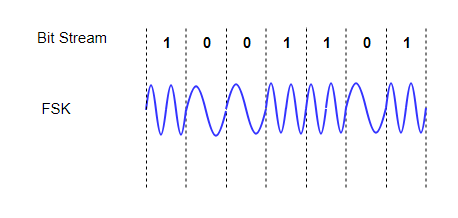
Fig. 4: FSK
FSK Modulator
The FSK modulator block diagram comprises of two oscillators with a clock and the input binary sequence. Following is its block diagram.
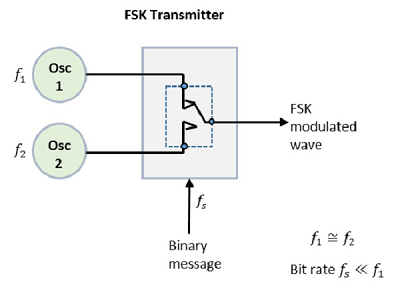
Fig.5: FSK modulator
The two oscillators, producing a higher and a lower frequency signals, are connected to a switch along with an internal clock. To avoid the abrupt phase discontinuities of the output waveform during the transmission of the message, a clock is applied to both the oscillators, internally. The binary input sequence is applied to the transmitter so as to choose the frequencies according to the binary input.
FSK Demodulator
There are different methods for demodulating a FSK wave. The main methods of FSK detection are asynchronous detector and synchronous detector. The synchronous detector is a coherent one, while asynchronous detector is a non-coherent one.
Asynchronous FSK Detector
The block diagram of Asynchronous FSK detector consists of two band pass filters, two envelope detectors, and a decision circuit. Following is the diagrammatic representation.
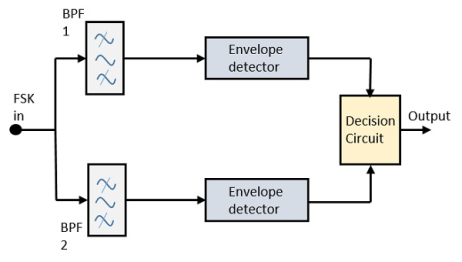
Fig.6: FSK demodulator
The FSK signal is passed through the two Band Pass Filters BPFs, tuned to Space and Mark frequencies. The output from these two BPFs look like ASK signal, which is given to the envelope detector. The signal in each envelope detector is modulated asynchronously.
The decision circuit chooses which output is more likely and selects it from any one of the envelope detectors. It also re-shapes the waveform to a rectangular one.
GENERATION AND COHERENT DETECTION OF QPSK SIGNALS
(i) Generation
The QPSK Modulator uses a bit-splitter, two multipliers with local oscillator, a 2-bit serial to parallel converter, and a summer circuit.
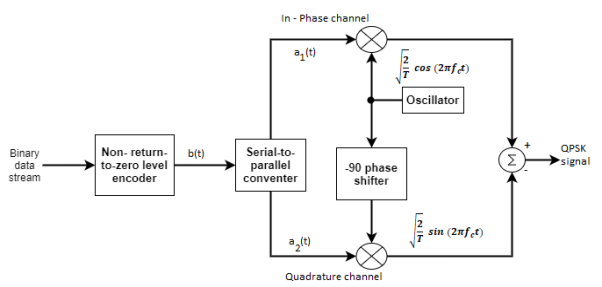
Fig.7: QPSK generation
At the modulator’s input, the message signal’s even bits (i.e., 2nd bit, 4th bit, 6th bit, etc.) and odd bits (i.e., 1st bit, 3rd bit, 5th bit, etc.) are separated by the bits splitter and are multiplied with the same carrier to generate odd BPSK (called as PSKI) and even BPSK (called as PSKQ). The PSKQ signal is anyhow phase shifted by 90° before being modulated.
The QPSK waveform for two-bits input is as follows, which shows the modulated result for different instances of binary inputs.
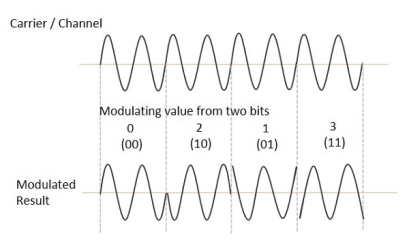
(ii) Detection
The QPSK Demodulator uses two product demodulator circuits with local oscillator, two band pass filters, two integrator circuits, and a 2-bit parallel to serial converter.
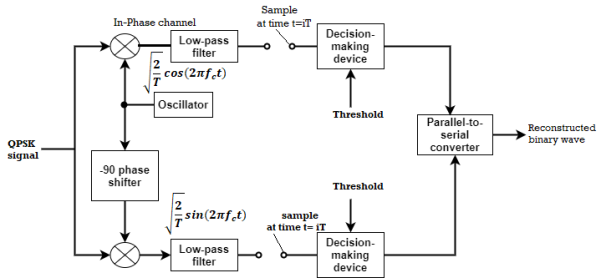
Fig.8: QPSK detectors
The two product detectors at the input of demodulator simultaneously demodulate the two BPSK signals. The pair of bits are recovered here from the original data. These signals after processing are passed to the parallel to serial converter.
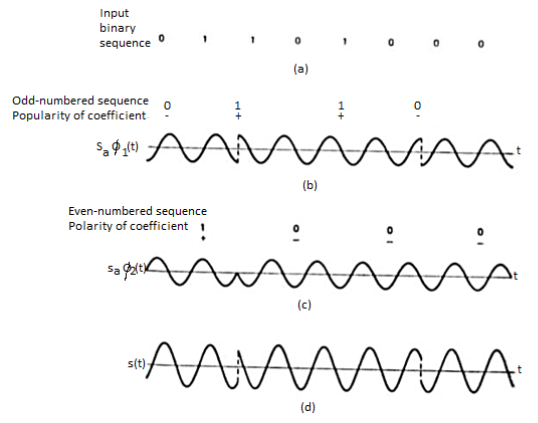
Fig.9: QPSK output
Key Takeaways:
- Minimum Shift Key Modulation is another type of digital modulation technique used to convert a digital signal into analog signals. It is also called Minimum-shift keying (MSK) or Advance Frequency Shift Keying because it is a type of continuous-phase frequency-shift keying.
- QPSK Modulator uses a bit-splitter, two multipliers with local oscillator, a 2-bit serial to parallel converter, and a summer circuit.
In the coherent detection of binary FSK signal, the phase information contained in the received signal is not fully exploited, other than to provide for synchronization of the receiver to the transmitter. We now show that by proper use of the continuous-phase property when performing detection, it is possible to improve the noise performance of the receiver significantly. Here again, this improvement is achieved at the expense of increased system complexity. Consider a continuous-phase frequency-shift keying (CPFSK) signal, which is defined for the signaling interval 0 t Tb as follows:

Where Eb is the transmitted signal energy per bit and Tb is the bit duration.
Another useful way of representing the CPFSK signal s(t) is to express it as a conventional angle-modulated signal:

Where (t) is the phase of s(t) at time t. When the phase (t) is a continuous function of time, we find that the modulated signal s(t) is itself also continuous at all times, including the inter-bit switching times. The phase (t) of a CPFSK signal increases or decreases linearly with time during each bit duration of Tb seconds, as shown by

Where the plus sign corresponds to sending symbol 1 and the minus sign corresponds to sending symbol 0; the dimensionless parameter h is to be defined. We deduce the following pair of relations:


Solving this pair of equations for fc and h, we get


Signal-Space Diagram of MSK
Using a well-known trigonometric identity of conventional angle modulated signal, we may expand the CPFSK signal s(t) in terms of its in-phase and quadrature components as

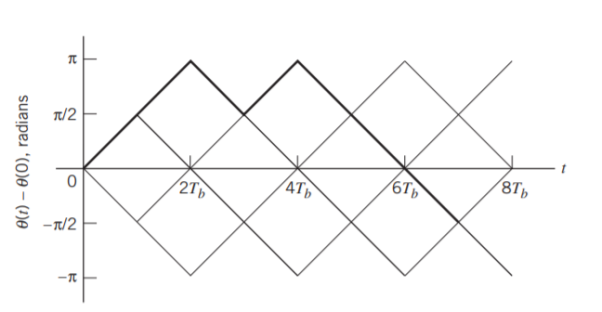
Fig 10. Boldfaced path represents the sequence 1101000.
Consider, first, the in-phase component √2Eb/Tbcos(t)

Where the plus sign corresponds to symbol 1 and the minus sign corresponds to symbol 0. A similar result holds for (t) in the interval –Tb t 0, except that the algebraic sign is not necessarily the same in both intervals. Since the phase (0) is 0 or depending on the past history of the modulation process, we find that in the interval –Tb t Tb, the polarity of cos(t) depends only on (0), regardless of the sequence of 1s and 0s transmitted before or after t = 0. Thus, for this time interval, the in-phase component consists of the half-cycle cosine pulse:


Where the plus sign corresponds to (0) = 0 and the minus sign corresponds to (0) = . In a similar way, we may show that, in the interval 0 t 2Tb, the quadrature component of s(t) consists of the half-cycle sine pulse:


Where the plus sign corresponds to (Tb) = 2 and the minus sign corresponds to (Tb)=–2. From the discussion just presented, we see that the in-phase and quadrature components of the MSK signal differ from each other in two important respects:
- They are in phase quadrature with respect to each other and
- The polarity of the in-phase component sI(t) depends on (0), whereas the polarity of the quadrature component sQ(t) depends on (Tb).
Moreover, since the phase states (0) and (Tb) can each assume only one of two possible values, any one of the following four possibilities can arise:
1. (0) = 0 and (Tb) = /2, which occur when sending symbol 1.
2. (0) = and (Tb) = /2, which occur when sending symbol 0.
3. (0) = and (Tb) = –/2 (or, equivalently, 3/2 modulo 2), which occur when sending symbol 1.
4. (0) = 0 and (Tb) = –/2, which occur when sending symbol 0.
This fourfold scenario, in turn, means that the MSK signal itself can assume one of four possible forms, depending on the values of the phase-state pair: (0) and (Tb).
Signal-Space Diagram
We see that there are two orthonormal basis functions 1(t) and 2(t) characterizing the generation of MSK; they are defined by the following pair of sinusoidally modulated quadrature carriers:


Where the coefficients s1 and s2 are related to the phase states (0) and (Tb), respectively. To evaluate s1, we integrate the product s(t)1(t) with respect to time t between the limits –Tb and Tb, obtaining

Similarly, to evaluate s2 we integrate the product s(t)2(t) with respect to time t between the limits 0 and 2Tb, obtaining

From above two equations we conclude that
1. Both integrals are evaluated for a time interval equal to twice the bit duration.
2. The lower and upper limits of the integral used to evaluate s1 are shifted by the bit duration Tb with respect to those used to evaluate s2.
3. The time interval 0 t Tb, for which the phase states (0) and (Tb) are defined, is common to both integrals.
It follows, therefore, that the signal constellation for an MSK signal is two-dimensional (i.e., N = 2), with four possible message points (i.e., M = 4), as illustrated in the signal space diagram of Figure below.
 and
and 
The possible values of (0) and (Tb), corresponding to these four message points, are also included in Figure below. The signal-space diagram of MSK is thus similar to that of QPSK in that both of them have four message points in a two-dimensional space. However, they differ in a subtle way that should be carefully noted:
- QPSK, moving from one message point to an adjacent one, is produced by sending a two-bit symbol (i.e., dibit).
- MSK, on the other hand, moving from one message point to an adjacent one, is produced by sending a binary symbol, 0 or 1. However, each symbol shows up in two opposite quadrants, depending on the value of the phase-pair: (0) and (Tb).
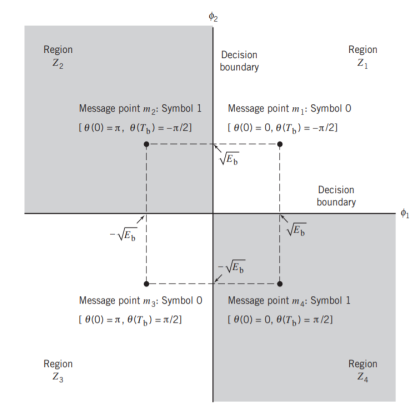
Fig 11. Signal-space diagram for MSK system
Generation and Coherent Detection of MSK Signals
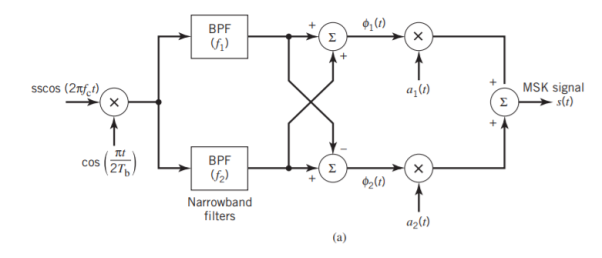
With h = 1/2, we may use the block diagram of Figure(a) below to generate the MSK signal. The advantage of this method of generating MSK signals is that the signal coherence and deviation ratio are largely unaffected by variations in the input data rate. Two input sinusoidal waves, one of frequency fc = nc4Tb for some fixed integer nc and the other of frequency 14Tb, are first applied to a product modulator. This modulator produces two phase-coherent sinusoidal waves at frequencies f1 and f2, which are related to the carrier frequency fc and the bit rate 1/Tb in accordance with above equations for deviation ratio h = 12. These two sinusoidal waves are separated from each other by two narrowband filters, one centered at f1 and the other at f2. The resulting filter outputs are next linearly combined to produce the pair of quadrature carriers or orthonormal basis functions 1(t) and 2(t). Finally, 1(t) and 2(t) is multiplied with two binary waves a1(t) and a2(t), both of which have a bit rate equal to 1/(2Tb)
(b)
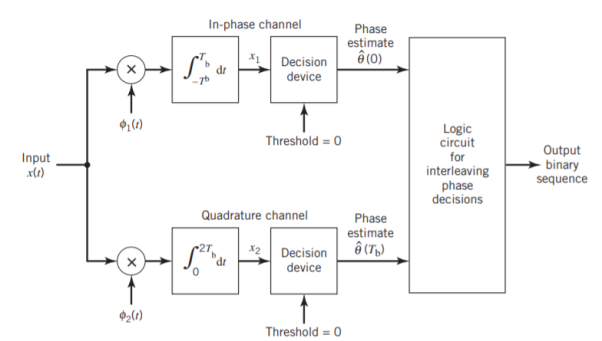
Fig 12. Block diagrams for (a) MSK transmitter and (b) coherent MSK receiver
Figure (b) above shows the block diagram of the coherent MSK receiver. The received signal x(t) is correlated with 1(t) and 2(t). In both cases, the integration interval is 2Tb seconds, and the integration in the quadrature channel is delayed by Tb seconds with respect to that in the in-phase channel. The resulting in-phase and quadrature channel correlator outputs, x1 and x2, are each compared with a threshold of zero
Error Probability of MSK
In the case of an AWGN channel, the received signal is given by
x(t) = s(t) + w(t)
Where s(t) is the transmitted MSK signal and w(t) is the sample function of a white Gaussian noise process of zero mean and power spectral density N0/2. To decide whether symbol 1 or symbol 0 was sent in the interval 0 t Tb, say, we have to establish a procedure for the use of x(t) to detect the phase states (0) and (Tb). For the optimum detection of (0), we project the received signal x(t) onto the reference signal over the interval –Tb t Tb, obtaining

w1 is the sample value of a Gaussian random variable of zero mean and variance N0/2. From the signal-space diagram, we see that if x1 > 0, the receiver chooses the estimate. On the other hand, if x1 0, it chooses the estimate. Similarly, for the optimum detection of (Tb), we project the received signal x(t) onto the second reference signal 2(t) over the interval 0 t 2Tb, obtaining

w2 is the sample value of another independent Gaussian random variable of zero mean and variance N02. Referring again to the signal space diagram, we see that if x2 0, the receiver chooses the estimate Tb = – 2. If, however, x2 0, the receiver chooses the estimate ˆ Tb = 2
It follows, therefore, that the BER for the coherent detection of MSK signals is given by

Key takeaway
- In M-ary PSK using coherent detection, increasing M improves the bandwidth efficiency, but the Eb/N0 required for the idealized condition of “error-free” transmission moves away from the Shannon limit as M is increased.
- In M-ary FSK, as the number of frequency-shift levels M is increased—which is equivalent to increased channel-bandwidth requirement—the operating point moves closer to the Shannon limit.

 = Amplitude information
 phase information
 the carrier frequency
Θ=the phase shift introduced by the channel
In coherent communications, θ is known to receivers
In non-coherent communications, θ is unknown to receivers and assumbed to be a random variable distributed uniformly over (-π , π)
The phase shift is treated as a random variable distributed uniformly over (-π , π) and no phase estimation is provided at the receiver.
We are now concerned with non-coherent communicaitons
The phase shift θ is the same during two consecutive signal transmission intervals [(n-1)T, nT] and [nT, (n+1)T).
The information phase sequence { } is still differentially encoded as before
The transmitted signal s(t) in the interval [(n-1)T, (n+1)T] is

 and
and  are independent. Both of them take values uniformly over

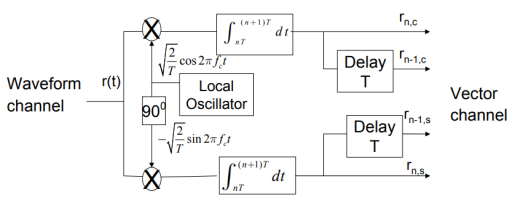
Fig.13: DPSK generation

 are i.i.d
Each of them ∼
Key Takeaways:
Here, the phase of the modulated signal is shifted relative to the previous signal element. No reference signal is considered here. The signal phase follows the high or low state of the previous element. This DPSK technique doesn’t need a reference oscillator.
Solved Examples
Q) For the QPSK modulator shown in Figure, construct the truth table, phasor diagram, and constellation diagram.
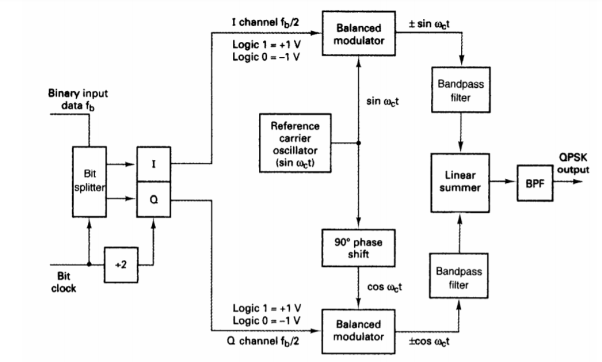
A) For a binary data input of Q = O and I= 0, the two inputs to the I balanced modulator are -1 and sin ωc t, and the two inputs to the Q balanced modulator are -1 and cos ωc t.
Consequently, the outputs are
I balanced modulator =(-1)(sin ωc t) = -1 sin ωc t
Q balanced modulator =(-1)(cos ωc t) = -1 cos ωc t and
The output of the linear summer is -1 cos ωc t - 1 sin ωc t = 1.414 sin(ωc t - 135°)
For the remaining dibit codes (01, 10, and 11), the procedure is the same.
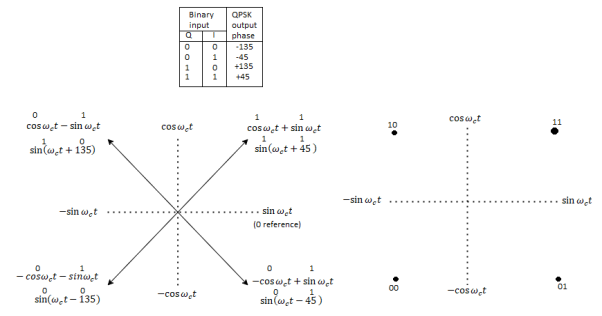
Fig 14. QPSK modulator: (a) truth table; (b) phasor diagram; (c) constellation diagram
In Figures b and c, it can be seen that with QPSK each of the four possible output phasors has exactly the same amplitude. Therefore, the binary information must be encoded entirely in the phase of the output signal.
Figure b, it can be seen that the angular separation between any two adjacent phasors in QPSK is 90°. Therefore, a QPSK signal can undergo almost a+45° or -45° shift in phase during transmission and still retain the correct encoded information when demodulated at the receiver. Figure shows the output phase-versus-time relationship for a QPSK modulator.

Fig 15. Output phase-versus-time relationship for a PSK modulator.
Q) For a QPSK modulator with an input data rate (fb) equal to 10 Mbps and a carrier frequency 70 MHz, determine the minimum double-sided Nyquist bandwidth (fN) and the baud.
A) The bit rate in both the I and Q channels is equal to one-half of the transmission bit rate, or
fbQ = fb1 = fb / 2 = 10 Mbps / 2 = 5 Mbps
The highest fundamental frequency presented to either balanced modulator is
Fa= fbQ / 2 = 5 Mbps / 2 = 2.5 MHz
The output wave from each balanced modulator is
(sin 2πfa t)(sin 2πfc t)
0.5 cos 2π(fc – fa)t – 0.5 cos 2π(fc + fa)t
0.5 cos 2π[(70 – 2.5)MHz]t – 0.5 cos 2π[(70 – 2.5)MHz]t
0.5 cos 2π(67.5MHz)t - 0.5 cos 2π(72.5MHz)t
The minimum Nyquist bandwidth is B=(72.5-67.5)MHz = 5MHz
The symbol rate equals the bandwidth: thus, symbol rate = 5 megabaud
Q) For an 8-PSK system, operating with an information bit rate of 24 kbps, determine (a) baud, (b) minimum bandwidth, and (c) bandwidth efficiency.
A)
a. Baud is determined by
Baud = 24 kbps / 3 = 8000
b. Bandwidth is determined by
B = 24 kbps / 3 = 8000
c. Bandwidth efficiency is calculated
Bη = 24, 000 / 8000 = 3 bits per second per cycle of bandwidth
Q) For a QPSK system and the given parameters, determine a. Carrier power in dBm. b. Noise power in dBm. c. Noise power density in dBm. d. Energy per bit in dBJ. e. Carrier-to-noise power ratio in dB. f. EblNo ratio. C = 10-12 W, Fb = 60 kbps, N = 1.2 x 10 -14W, B = 120 kHz
A) a. The carrier power in dBm is determined by
C = 10 log (10 -12 / 0.001) = - 90 dBm
b. The noise power in dBm is determined by
N = 10 log [(1.2x10⁻¹⁴) / 0.001] = -109.2 dBm
c. The noise power density is determined by
No = -109.2 dBm – 10 log 120 kHz = -160 dBm d.
The energy per bit is determined by Eb = 10 log (10-12 / 60 kbps) = -167.8 dBJ
e. The carrier-to-noise power ratio is determined by
C / N = 10 log (10-12 / 1.2 x 10⁻¹⁴) = 19.2 dB
f. The energy per bit-to-noise density ratio is determined by
Eb / No = 19.2 + 10 log 120 kHz / 60 kbps = 22.2 dB
Q) Determine the minimum bandwidth required to achieve a P(e) of 10-7 for an 8-PSK system operating at 10 Mbps with a carrier-to noise power ratio of 11.7 dB.
A) The minimum bandwidth is
B / fb = Eb / No = C / N = 14.7 dB – 11.7 dB = 3 dB
B / fb = antilog 3 = 2
B = 2 x 10 Mbps = 20 MHz
Q) We need to send data 3 bits at a time at 9 bit rate of 3mbps. The carrier frequency is 10MHz. Calculate the number of levels the baud rate and bandwidth?
A) n= 3 biits
R= 3Mbps
fc= 10MHz
L=2n = 23=8
The number of levels =8
Baud rate = Bit rate/n= 3Mpbs/3 =1Mbaud
Bandwidth = L*r=8*1Mbaud= 8MHz
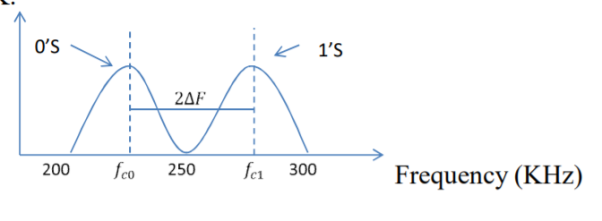
Q) We have an available bandwidth of 100kHz which spans from 200- 300kHz. What should be the carrier frequency and the bit rate if we modulated the data by using FSK?
A)


Q) A voice signal is sampled at the rate of 8000 samples/sec and each sample is encoded in to 8 bits using PCM. The binary data is transmitted into free space after modulation. Determine the bandwidth of modulated signal, if the modulation technique is ASK, FSK, PSK for f1 =10MHz, f2= 8MHz?
A)
Bit rate
Baud rate = 8000 samples/sec
No.of bits per sample=8

Band Width of ASK 

Band Width of FSK


Q) Find the maximum bit rates of an FSK signal in bps, if the bandwidth of the medium is 12 kHz and the difference between the two carriers is 2 kHz(given that transmission mode is full duplex)
A) As transmission is full duplex only 6kHz is allotted for each direction.
Bandwidth = 2Bit Rate + fc1-fc0
2Bit Rate= Bandwidth – (fc1-fc0)=6000-2000=4000
Bit rate= 2000bps
Q) A BPSK modulator has a carrier frequency of 70MHz and an input bit rate of 10Mbps. Calculate the maximum upper side band frequency in MHz?
A)

 is maximum fundamental frequency of binary input
 is input bit rate
 is reference carrier frequency
The output of a BPSK modulator with carrier frequency of 70 MHz and bit rate of 10 Mbps is


Therefore the maximum upper sideband frequency

Q) In digital communication channel employing FSK, the 0 and 1 bits are represented by sine waves of 10kHz and 25kHz respectively. These waveforms will be orthogonal for a bit interval of?
A)
For orthogonality of two sine waves in  duration there should be integral multiple of cycles of both sine waves.
Time period of first sine wave

Time period of the second sine wave

Therefore 200s is the integral multiple of both  and
and  . Hence the two given waveforms will be orthogonal for a bit interval of 200s
Q) Find the minimum bandwidth (in kHz) required for transmitting an ASK signal at 2 kbps in half duplex transmission mode.
A) In ASK, the baud rate and bit rate are the same. Therefore, baud rate is 2000 bauds. An ASK signal requires a minimum bandwidth equal to its baud rate. Therefore, minimum bandwidth = 2000 Hz = 2 kHz
Q) A communication system employs ASK to transmit a 10-kbps binary signal. Find the baud rate required in bauds.
A) For an ASK system, the minimum bandwidth is the same as the bit rate of the signal. Therefore, minimum bandwidth = 10000 Hz
Q) For the data given in the above Question, find the minimum bandwidth required in hertz
A) For an ASK system, the minimum bandwidth is the same as the bit rate of the signal. Therefore, minimum bandwidth = 10000 Hz
Q) Determine the peak frequency deviation, for a binary FSK signal with a mark frequency of 51 kHz, a space frequency of 49 kHz, and an input bit rate of 2.
A) The peak frequency deviation is ∆f = (mark frequency-space frequency)/2 =|49kHz - 51 kHz| / 2 =1 kHz kbps.
Q) Determine minimum bandwidth for a binary FSK signal with a mark frequency of 51 kHz, a space frequency of 49 kHz, and an input bit rate of 2.
A) Minimum bandwidth = 2(  + 2Rb) = 2(1+2) =6K
- The Orthogonal Frequency Division Multiplexing (OFDM) transmission scheme is the optimum version of the multicarrier transmission scheme. In the past, as well as in the present, the OFDM is referred in the literature Multi-carrier, Multi-tone and Fourier Transform.
- In mid-1960 parallel data transmission and frequency multiplexing came. In high speed digital communication OFMD is employed. OFMD has a drawback of massive complex computation and high-speed memory which are no more problems now due to introduction of DSP and VLSI.
- The implementation of this technology is cost effective as FFT eliminates array of sinusoidal generators and coherent demodulation required in parallel data systems· The data to be transmitted is spread overlarge number of carriers. Each of them is then modulated at low rates. By choosing proper frequency between them the carriers are made orthogonal to each other.
- In OFDM the spectral overlapping among the sun carrier is allowed, at the receiver due to orthogonality the subcarriers can be separated. This provides better spectral efficiency and use to steep BPF is eliminated.
- The problems arising in single carrier scheme are eliminated in OFDM transmission system. It has the advantage of spreading out a frequency selective fade over many symbols. This effectively randomizes burst errors caused by fading or impulse interference so that instead of several adjacent symbols being completely destroyed, many symbols are only slightly distorted.
- Because of this reconstruction of majority of them even without forward error correction is possible. As the entire bandwidth is divided into many narrow bandwidths, the sub and become smaller then the coherent bandwidth of the channel which makes the frequency response over individual subbands is relatively flat. Hence, equalization becomes much easier than in single carrier system and it can be avoided altogether if differential encoding is employed.
- The orthoganality of subchannles in OFDM can be maintained and individual subchannels can be completely separated by the FFT at the receiver when there are no intersymbol interference (ISI) and intercarrier interference (ICI) introduced by the transmission channel distortion.
- Since the spectra of an OFDM signal is not strictly band limited, linear distortions such as multipath propagation causes each subchannel to spread energy into the adjacent channels and consequently cause ISI.
- One way to prevent ISI is to create a cyclically extended guard interval, where each OFDM symbol is preceded by a periodic extension of the signal itself. When the guard interval is longer than the channel impulse response or multipath delay, the ISI can be eliminated.
- By using time and frequency diversity, OFDM provides a means to transmit data in a frequency selective channel. However, it does not suppress fading itself. Depending on their position in the frequency domain, individual subchannels could be affected by fading.
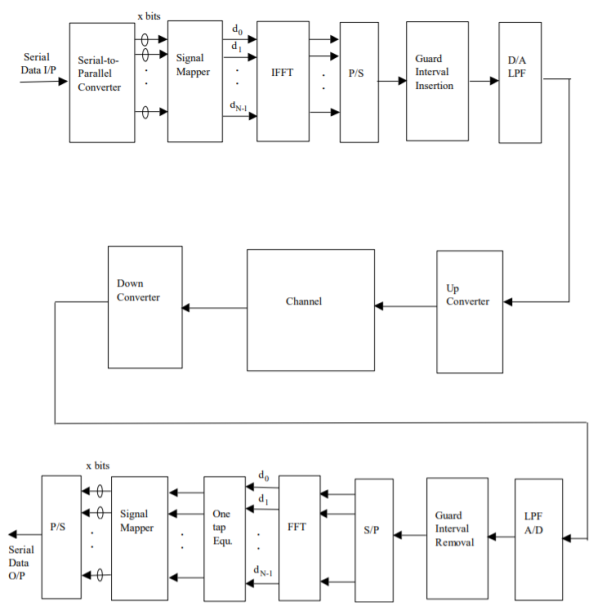
Fig 16. General OFDM System
The incoming signal is converted to parallel form by serial to parallel converter. After that it is grouped in x bits to form a complex number. These numbers are then modulated in a baseband manner by IFFT. Then through parallel to serial converted they are converted to serial data and transmitted. In order to avoid inter symbol interference a guard interval is inserted between the symbols. The discrete symbols are converted to analog and lowpass filtered for RF up-conversion. The receiver performs the inverse process of the transmitter. One tap equalizer is used to correct channel distortion. The tap coefficients of the filter are calculated based on channel information.
Key takeaway
The OFDM scheme differs from traditional FDM in the following interrelated ways:
- Multiple carriers (called subcarriers) carry the information stream
- The subcarriers are orthogonal to each other.
- A guard interval is added to each symbol to minimize the channel delay spread and inter-symbol interference.
Comparison of Digital modulation systems
Modulation Scheme |  | BW | Probability error  | Comments |
Coherent ASK
Non Coherent ASK |   |  |  | Rarely used |
  |  |  | Rarely used | |
Coherent FSK
Non Coherent FSK |  
|  |  | 2.2 dB more power required than PSK Requires more Bandwidth |
 
|  |  | No advantage over PSK, so seldom used | |
Coherent FSK
Non Coherent PSK
DPSK |  
|  |  | 3 dB Power advantage over ASK |
 
|  |  | DPSK is non-coherent version of PSK, but only little inferior than coherent PSK (1 dB more power) |
 Probability of error, /2-two sided noise PSD,
  bit duration,
  is bit rate
Energy  where
where  carrier amplitude
The meaning of the word “information” in Information Theory is the message or intelligence. The message may be an electrical message such as voltage, current or power or speech message or picture message such as facsimile or television or music message.
A source which produces these messages is called Information source.
Basics of Information System
Information system can be defined as the message that is generated from the information source and transmitted towards the receiver through transmission medium.
The block diagram of an information system can be drawn as shown in the figure.

Information sources can be classified into
- Analog Information Source
- Digital Information Source
Analog Information source such as microphone actuated by speech or a TV camera scanning a scene, emit one or more continuous amplitude electrical signals with respect to time.
Discrete Information source such as teletype or numerical output of computer consists of a sequence of discrete symbols or letters.
An analog information source can be transformed into discrete information source through the process of sampling and quantizing.
Discrete Information source are characterized by
- Source Alphabet
- Symbol rate
- Source alphabet probabilities
- Probabilistic dependence of symbol in a sequence.
In the block diagram of the Information system as shown in the figure, let us assume that the information source is a discrete source emitting discrete message symbols S1, S2………………. Sq with probabilities of occurrence given by P1, P2…………. Pq respectively. The sum of all these probabilities must be equal to 1.
Therefore P1+ P2 + ………………. + Pq = 1----------------------(1)
Or  --------------------(2)
Symbols from the source alphabet S = {s1, s2……………….sn} occurring at the rate of “rs” symbols/sec.
The source encoder converts the symbol sequence into a binary sequence of 0’s and 1s by assigning code-words to the symbols in the input sequence.
Transmitter
The transmitter couples the input message signal to the channel. Signal processing operations are performed by the transmitter include amplification, filtering and modulation.
Channel
A communication channel provides the electrical connection between the source and the destination.The cahnnel may be a pair of wires or a telephone cable or a free space over the information bearing symbol is radiated.
When the binary symbols are transmitted over the channel the effect of noise is to convert some of the 0’s into 1’s and some of the 1’s into 0’s. The signals are then said to be corrupted by noise.
Decoder and Receiver
The source decoder converts binary output of the channel decoder into a symbol sequence. Therefore the function of the decoder is to convert the corrupted sequence into a symbol sequence and the function of the receiver is to identify the symbol sequence and match it with the correct sequence.
A channel is said to be symmetric or uniform channel if the second and subsequent rows of the channel matrix contain the same elements as that of the first row but in different order.
For example
P(Y/X) = 
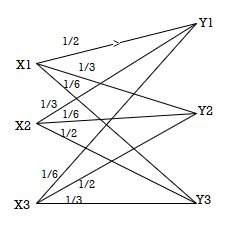
Channel matrix and diagram of symmetric/uniform channel.
The equivocation H(B/A) is given by
H(B/A) =  log 1/P(bi/ai)
But p (ai, bj) = P(ai) P(bj/ai)
H(B/A) = 
 log 1/P(bj/ai)
Since  log 1/P(bj/ai) = h
H(B/A) = 1.h
H=  log 1/P(j)
Therefore, the mutual information I (A, B) is given by
I (A, B) is given by H(B) –H(B/A)
I (A, B) = H(B) –h
Now the channel capacity is defined as
C = Max [I (A, B)]
= Max[H(B) – h]
C = Max[H(b) –h] -----------------------(X)
But H(B) the entropy of the output symbol becomes maximum if and only if when all the received symbols become equiprobable and since there are ‘S’ number of output symbols we have H(B) max = max[H(B) = log s----------------------(Y)
Substituting (Y) in (X) we get
C = log 2 s – h
For the channel matrix shown find the channel capacity
P(bj/ai) = 
The given matrix belongs to a symmetric or uniform channel
H(B/A) = h =  log 1/Pj
= ½ log 2 + 1/3 Log 3 + 1/6 log 6
H(B/A) = 1.4591 bits/msg symbol.
The channel capacity is given by
C = (log S – h) rs rs = 1 msgsymbol/sec
C = log 3 – 1.4591
C = 0.1258 bits/sec
Determine the capacity of the channel as shown in the figure.
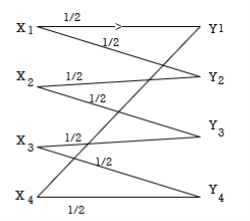
The channelmatrix can be written as
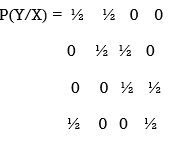
Now h = H(Y/X) =  log 1/Pj
H = ½ log 2 + ½ log 2 +0+ 0 = 1 bits/Msg symbol.
Channelcapacity
C = log s – h
= log 4 – 1
= 1 bits/msg symbol.
First the source symbols are listed in the non-increasing order of probabilities
Consider the equation
q = r + (r-1 ) 
Where q = number of source symbols
r = no of different symbols used in the code alphabet
The quantity  is calculated and it should be an integer . If it is not then dummy symbols with zero probabilities are added to q to make the quantity )
  an integer. To explain this procedure consider some examples.
Given the messages X1,X2,X3,X4,X5 and X6 with respective probabilities of 0.4,0.2,0.2,0.1,0.07 and 0.03. Construct a binary code by applying Huffman encoding procedure . Determine the efficiency and redundancy of the code formed.
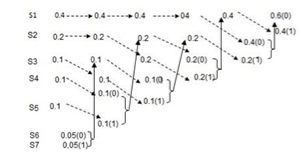
Now Huffmann code is listed below:
Source Symbols | Pi | Code | Length (li) |
X1 | 0.4 | 1 | 1 |
X2 | 0.2 | 01 | 2 |
X3 | 0.2 | 000 | 3 |
X4 | 0.1 | 0010 | 4 |
X5 | 0.07 | 00110 | 5 |
X6 | 0.03 | 00111 | 5 |
Now Average length (L) =  li
li
L = 0.4 x 1 + 0.2 x 2 + 0.2 x 3 + 0.1 x 4 + 0.07x 5 + 0.03 x 5
L = 2.3 bits/msg symbol.
Entropy H(s) = =  log 1/Pi
0.4 log 1/0.4 + 0.2 log 1/0.2 + 0.1 log 1/0.1 + 0.07 log 1/0.07 + 0.03 log 1/0.03
H(s) = 2.209 bits /msg symbol.
Code effeciency = nc = H(s) /L = 2.209/2.3 = 96.04%.
A prefix code is a code such that no codeword is a prefix of any other codeword. This definition is awkward at first glance, but it can be understood more easily noting the following
(Binary tree representation of a prefix code)
Any prefix code can be represented as a binary tree, such that each codeword is a leaf. i.e. For a prefix code on an N symbol alphabet, the binary tree has N leaves which correspond to the N codewords of the code. By convention, the left child is labelled 0 and right child is labelled 1. Typically, we are interested in encoding a sequence of symbols from an alphabet. The most straightforward way to encode a sequence of symbols is as follows.
(Extension of a Code)
The extension of a code is the mapping from finite sequences of symbols of the alphabet to finite binary strings. The mapping is defined by replacing each symbol in the string by its code. For example.
Example: C(α) = 0, C(β) = 10, C(γ) = 11
C(bcbca) = 101110110.
Suppose we are given a sequence of bits and we want to decode this sequence. That is, we want to find out what sequence of symbols is encoded. If the code is a prefix code, then there is a simple method for decoding the sequence of bits. Just repeatedly traverse the binary tree from root to leaf. Each time you reach a leaf, read off the symbol at the leaf, then return to the root. Repeat until all bits of the string have been accounted for.
For Example above, if we are given the binary sequence, 101110110 we can decode it to recover the original sequence bcbca just by traversing the corresponding binary tree. Note: given a prefix code, there can exist strings which cannot be decoded using this method. First, if the code’s tree has internal nodes that do not have a sibling. e.g. C(A1) = 001, C(A2) = 1, then you can define binary strings which cannot be decoded, e.g. 01 . . . Second, if the string ends with an incomplete traversal, then the last symbol is not well defined e.g. 001110010. In both cases, such a string produces an error. We would say that it was incorrectly encoded.
A drawback of the Huffman code is that it requires knowledge of a probabilistic model of the source; unfortunately, in practice, source statistics are not always known a priori. Thereby compromising the efficiency of the code. To overcome these practical limitations, we may use the Lempel-Ziv algorithm/ which is intrinsically adaptive and simpler to implement than Huffman coding. Basically, encoding in the Lempel-Ziv algorithm is accomplished by parsing the source data stream into segments that are the shortest sub sequences not encountered previously. To illustrate this simple yet elegant idea, consider the example of an input binary sequence specified as follows: 000101110010100101 ... It is assumed that the binary symbols 0 and 1 are already stored in that order in the code book. We thus write
Sub sequences stored: 0, 1
Data to be parsed: 000101110010100101 . . .
The encoding process begins at the left. With symbols 0 and 1 already stored, the shortest subsequence of the data stream encountered for the first time and not seen before is 00; so we write
Sub sequences stored: 0, 1, 00
Data to be parsed: 0101110010100101 . . .
The second shortest subsequence not seen before is 01; accordingly, we go on to write
Sub sequences stored: 0, 1, 00, 01
Data to be parsed: 01110010100101 . . .
The next shortest subsequence not encountered previously is 011; hence, we write
Sub sequences stored: 0, 1, 00, 01, 011
Data to be parsed: 10010100101 . . .
We continue in the manner until the given data stream has been completely parsed. Thus, for the example at hand, we get the code book of binary sub sequences shown in the second row below:
Numerical positions | 1 | 2 | 3 | 4 | 5 | 6 | 7 | 8 | 9 |
Subsequences | 0 | 1 | 00 | 01 | 011 | 10 | 010 | 100 | 101 |
Numerical representation |
|
| 11 | 12 | 42 | 21 | 41 | 61 | 62 |
Binary encoded blocks |
|
| 0010 | 0011 | 1001 | 0100 | 1000 | 1100 | 1101 |
The decoder is just as simple as the encoder. Specifically, it uses the pointer to identify the root subsequence and then appends the innovation symbol. Consider, for example, the binary encoded block 1101 in position 9. The last bit, 1, is the innovation symbol. The remaining bits, 110, point to the root subsequence 10 in position 6. Hence, the block 1101 is decoded into 101, which is correct.
Another procedure (the o/p code here is variable length code), given that 0 & 1 are not stored in the encoder, The method of compression is to replace a substring with a pointer to an earlier occurrence of the same substring.
Example: If we want to encode the string:
1011010100010. . . ,
We parse it into an ordered dictionary of substrings that have not appeared before as follows:
λ, 1, 0, 11, 01, 010, 00, 10, . . . .
We include the empty substring λ as the first substring in the dictionary and order the substrings in the dictionary by the order in which they emerged from the source. After every comma, we look along the next part of the input sequence until we have read a substring that has not been marked off before. A moment's reflection will confirm that this substring is longer by one bit than a substring that has occurred earlier in the dictionary. This means that we can encode each substring by giving a pointer to the earlier occurrence of that prefix and then sending the extra bit by which the new substring in the dictionary differs from the earlier substring. If, at the nth bit, we have enumerated s(n) substrings, then we can give the value of the pointer in (log2 s(n)) bits. The code for the above sequence is then as shown in the fourth line of the following table (with punctuation included for clarity), the upper lines indicating the source string and the value of s(n):
Source substrings 1 0 11 01 010 00 10
 0 1 2 3 4 5 6 7
 000 001 010 011 100 101 110 111
(pointer , bit) (,1) (0,0) (01,1) (10,1) (100,0)(010,0)(001,0)
Notice that the first pointer we send is empty, because, given that there is only one substring in the dictionary - the string λ no bits are needed to convey the choice' of that substring as the prefix. The encoded string is 100011101100001000010. The encoding, in this simple case, is actually a longer string than the source string, because there was no obvious redundancy in the source string. In simple words (the idea is to check the first row (substring), remove the least bit (innovation bit) and see the remaining bits (pointer) – which must point to an earlier code then we must take the binary equivalent of that code & add the innovation symbol. For example: the last substring is (10) (0) is innovation- to be added later, & we have remaining (1) which points to substring (1) with binary equivalent (001), so the subcode should be constructed from the pointer & the innovation bit, which yields (001,0)
Rate Distortion Basics
When it comes to rate distortion about random variables, there are four important equations to keep in mind.
1. The entropy |  |
2. Conditional entropy |  |
3. Joint entropy |  |
4. Mutual Information |  |

For a binary file which is of our interest, we use Hamming Distance (probability of error distortion) for distortion function. Another important case is Quantization. Suppose we are given a Gaussian random variable, we quantize it and represent it by bits. Thus we lose some information. What is the best Quantization level that we can achieve? Here is what we do. Define a random variable X  . Our source produces a n length vector and we denote it by Xn = X1, X2, ......, Xn, where the vector is i.i.d. And produced according to the distribution of random variable X and p(x) = P r(X = x). What we do is to encode the file. After the encoder, the function fn gives us a compressed string. Then we map the point in the space to the nearest codeword and we obtain an index which is represented by log Mn bits. Finally, we use a decoder to map the index back which gives us one of the codeword ˆx in the space.

Above is a figure of rate distortion encoder and decoder. Where fn = Xn ! {1, 2, .......Mn} is the encoder, and Xˆ n is the actual code we choose.
The distortion between sequences xn and xˆn is defined by

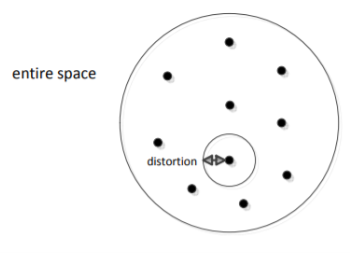
There are  points in the entire space, each point is a chosen codeword (center). We map each data point to the nearest centre
Thus, we know that the distortion of a sequence is the average distortion of the symbol-to-symbol distortion. We would like d(xn, xˆn) D. The compression rate we could achieve is

The Rate distortion function R(D) is the minimization of log Mn/n such that
 at the limit of n
Theorem(Fundamental theory of source coding): The information rate distortion function R(D) for a source X with distortion measure d(x, xˆ) is defined as

From the above equation, we could see that no n involved. This is called a single letter characterization. For the subscript of the summation, we know that

First of all, let’s see what is Chain Rule. It is defined as below: H(X1, X2, X3, ......, Xn) = H(X1) + H(X2|X1) + H(X3|X1, X2) + ...... + H(Xn|X1, X2, ......, Xn1) Chain rule can be easily proved by induction.
Two Properties of R(D)
We now show two properties of R(D) that are useful in proving the converse to the rate-distortion theorem.
1. R(D) is a decreasing function of D.
2. R(D) is a convex function in D.
For the first property, we can prove its correctness intuitively: If R(D) is an increasing function, this means that the more the distortion, the worse the compression. This is definitely what we don’t want. Now, let’s prove that second property.


Therefore, R(D) is a convex function of D.
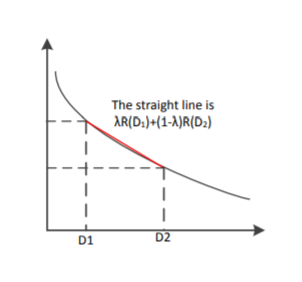
For the above proof, we need to make the argument that distortion D is a linear function of p(ˆx|x). We know that the D is the expected distortion and it is given as D = Pp(x, xˆ)d(ˆx, x) = Pp(x)p(ˆx|x)d(x, xˆ). If we treat p(ˆx|x) as a variable and both p(x) and d(x, xˆ) as known quantities, we know that D is a linear function of p(ˆx|x). Therefore, R(D) is a convex function of p(ˆx|x). The proof that I(X; Xˆ) is a convex function of p(ˆx|x) will not be shown here.
Scalar Quantization
Let us begin by considering the case of a real-valued (scalar) memoryless source. Such a source is modeled as a real-valued random variable, thus fully characterized by a probability density function (pdf) fX. Recall that a pdf fX satisfies the following properties: fX(x) ≥ 0, for any x ∈ R,


Where P[X ∈ [a, b]] denotes the probability that the random variable X takes values in the interval [a, b]. To avoid technical issues, in this text we only consider continuous pdfs.
Consider the objective of transmitting a sample x of the source X over a binary channel that can only carry R bits, each time it is used. That is, we can only use R bits to encode each sample of X. Naturally, this restriction implies that we are forced to encoding any outcome of X into one of N = 2R different symbols (binary words). Of course, this can be easily generalized for D-ary channels (instead of binary), for which the number of different words is DR; however, to keep the notation simple, and without loss of generality, we will only consider the case of binary channels. Having received one of the N = 2R possible words, the receiver/decoder has to do its best to recover/approximate the original sample x, and it does so by outputting one of a set of N values. The procedure described in the previous paragraph can be formalized as follows. The encoder is a function E : R → I, where I = {0, 1, ..., N − 1} is the set of possible binary words that can be sent through the channel to represent the original sample x. Since the set I is much smaller than R, this function is non-injective and there are many different values of the argument that produce the same value of the function; each of this sets is called a quantization region, and is defined as
Ri = {x ∈ R : E(x) = i}.
Since E is a function defined over all R, this definition implies that the collection of quantization regions (also called cells) R = {R0, ..., RN−1} defines a partition of R, that is,
(i 6= j) ⇒ Ri ∩ Rj = ∅
The decoder is a real-valued function D : I → R; notice that since the argument of D only takes N different values, and D is a deterministic function, it can also only take N different values, thus its range is a finite set C = {y0, ..., yN−1} ⊂ R. The set C is usually called the codebook. The i-th element of the codebook, yi , is sometimes called the representative of the region/cell Ri . Considering that there are no errors in the channel, the sample x is reproduced by the decoder as D (E(x)), that is, the result of first encoding and then decoding x. The composition of the functions E and D defines the so-called quantization function Q : R → C, where Q(x) = D (E(x)). The quantization function has the following obvious property
(x ∈ Ri) ⇔ Q(x) = yi ,
Which justifies the term quantization. In other other, any x belonging to region Ri is represented at the output of the system by the corresponding yi . A quantizer (equivalently a pair encoder/decoder) is completely defined by the set of regions R = {R0, ..., RN } and the corresponding representatives C = {y0, ..., yN−1} ⊂ R. If all the cells are intervals (for example, Ri = [ai , bi [ or Ri = [ai , ∞[) that contain the corresponding representative, that is, such that yi ∈ Ri , the quantizer is called regular. A regular quantizer in which all the regions have the same length (except two of them, which may be unbounded on the left and the right) is called a uniform quantizer. For example, the following set of regions
And codebook define a 2-bit (R = 2, thus N = 4) regular (but not uniform) quantizer:
R = {] − ∞, −0.3], ] − 0.3, 1.5], ]1.5, 4[, [4, ∞[} and
C = {−1, 0, 2, 5}.
As another example, the following set of regions/cells and codebook define a 3-bit (R = 3, thus N = 8) uniform quantizer:
R = {] − ∞, 0.3], ]0.3, 1.3], ]1.3, 2.3], ]2.3, 3.3], ]3.3, 4.3], ]4.3, 5.3], ]5.3, 6.3], ]6.3, ∞[}
C = {0, 1, 2, 3, 4, 5, 6, 7}.
Vector Quantization
In vector quantization the input to the encoder, that is, the output of the source to be quantized, is not a scalar quantity but a vector in Rn. Formally, the source is modeled as a vector random variable X ∈ R n , characterized by a pdf fX(x). Any pdf defined on R n has to satisfy the following properties: fX(x) ≥ 0, for any x ∈ Rn,


Where P[X ∈ R] denotes the probability that the random variable X takes values in
Some set R ⊆ R n . To avoid technical issues, we consider only continuous pdfs. In the vector case, the encoder is a function E : R n → I, where I = {0, 1, ..., N − 1}. As in the scalar case, this function is non-injective and there are many different values of the argument that produce the same value of the function; each of this sets is called a quantization region (or cell), and is defined as

Since E is a function defined over all R n , this definition implies that the collection of quantization regions/cells R = {R0, ..., RN−1} defines a partition of R n , that is

The decoder is a function D : I → R n ; as in the scalar case, since the argument of D only takes N different values, and D is a deterministic function, it can also only take N different values, thus its range is a finite set C = {y0, ..., yN−1} ⊂ R n . The set C is still called the codebook. The i-th element of the codebook, yi , is the representative of the region/cell Ri . Considering that there are no errors in the channel, the sample x is reproduced by the decoder as D (E(x)), that is, the result of first encoding and then decoding x. The composition of the functions E and D defines the so-called vector quantization function Q : R n → C, where Q(x) = D (E(x)). As in the scalar case, the quantization function has the following obvious property
(x ∈ Ri) ⇔ Q(x) = yi .
Similarly to the scalar case, a vector quantizer (VQ) (equivalently a pair encoder/decoder) is completely defined by the set of regions R = {R0, ..., RN } and the corresponding codebook C = {y0, ...yN−1} ⊂ R n . A VQ in which all the cells are convex and contain its representative is called a regular VQ. Recall that a set S is said to be convex if it satisfies the condition
x, y ∈ S ⇒ λx + (1 − λ)y ∈ S, for any λ ∈ [0, 1];
In words, a set is convex when the line segment joining any two of its points also belongs to the set. Observe that this definition covers the scalar case, since the only type of convex sets in R are intervals (regardless of being open or close).
CASE STUDY
QAM for Wireless Communication
Another major development occurred in 1987 when Sundberg, Wong and Steele published a pair of papers. Considering QAM for voice transmission over Rayleigh fading channels, the first major paper considering QAM for mobile radio applications. In these papers, it was recognized that when a Gray code mapping scheme was used, some of the bits constituting a symbol had different error rates from other bits. Gray coding is a method of assigning bits to be transmitted to constellation points in an optimum manner. For the 16-level constellation two classes of bits occurred, for the 64-level three classes and so on. Efficient mapping schemes for pulse code modulated (PCM) speech coding was, discussed where the most significant bits (MSBs) were mapped onto the class with the highest integrity. A number of other schemes including variable threshold systems and weighted systems were also discussed. Simulation and theoretical results were compared and found to be in reasonable agreement. They used no carrier recovery, clock recovery or AGC, assuming these to be ideal, and came to the conclusion that channel coding and post-enhancement techniques would be required to achieve acceptable performance.
This work was continued, resulting in a publication in 1990 by Hanzo, Steele and Fortune, again considering QAM for mobile radio transmission, where again a theoretical argument was used to show that with a Gray encoded square constellation, the bits encoded onto a single symbol could be split into a number of subclasses, each subclass having a different average BER. The authors then showed that the difference in BER of these different subclasses could be reduced by constellation distortion at the cost of slightly increased total BER, but was best dealt with by using different error correction powers on the different 16- QAM subclasses. A 16 kbit/s sub-band speech coder was subjected to bit sensitivity analysis and the most sensitive bits identified were mapped onto the higher integrity 16-QAM subclasses, relegating the less sensitive speech bits to the lower integrity classes. Furthermore, different error correction coding powers were considered for each class of bits to optimise performance. Again, ideal clock and carrier recovery were used, although this time the problem of automatic gain control (AGC) was addressed. It was suggested that as bandwidth became increasingly congested in mobile radio, microcells would be introduced supplying the required high SNRs with the lack of bandwidth being an incentive to use QAM.
In the meantime, CNET were still continuing their study of QAM for point-to-point applications, and detailing an improved carrier recovery system using a novel combination of phase and frequency detectors which seemed promising. However, interest was now increasing in QAM for mobile radio usage and a paper was published in 1989 by J. Chuang of Bell Labs considering NLF-QAM for mobile radio and concluding that NLF offered slight improvements over raised cosine filtering when there was mild intersymbol interference (ISI).
A technique, known as the transparent tone in band method (TTIB) was proposed by McGeehan and Bateman from Bristol University, UK, which facilitated coherent detection of the square QAM scheme over fading channels and was shown to give good per-formance but at the cost of an increase in spectral occupancy. At an IEE colloquium on multilevel modulation techniques in March 1990 a number of papers were presented considering QAM for mobile radio and point-to-point applications. Matthews proposed the use of a pilot tone located in the centre of the frequency band for QAM transmissions over mobile channels. Huish discussed the use of QAM over fixed links, which was becoming increasingly widespread. Webb et al. Presented two papers describing the problems of square QAM constellations when used for mobile radio transmissions and introduced the star QAM constellation with its inherent robustness in fading channels.
Further QAM schemes for hostile fading channels characteristic of mobile telephony can be found in the following recent references. If Feher’s previously mentioned NLA concept cannot be applied, then power-inefficient class A or AB linear amplification has to be used, which might become an impediment in lightweight, low-consumption handsets. However, the power consumption of the low-efficiency class A amplifier is less critical than that of the digital speech and channel codecs. In many applications 16- QAM, transmitting 4 bits per symbol reduces the signalling rate by a factor of 4 and hence mitigates channel dispersion, thereby removing the need for an equaliser, while the higher SNR demand can be compensated by diversity reception.
A further important research trend is hallmarked by Cavers’ work targeted at pilot symbol assisted modulation (PSAM), where known pilot symbols are inserted in the information stream in order to allow the derivation of channel measurement information. The recovered received symbols are then used to linearly predict the channel’s attenuation and phase. A range of advanced QAM modems have also been proposed by Japanese researchers doing cutting-edge research in the field.
References:
1. P Ramkrishna Rao, Digital Communication, McGraw-Hill Publication
2. J.G. Proakis, Digital Communication.
3. S. Haykin, Communication Systems
4. Leon W. Couch: Analog/Digital Communication, 5thEdition, PHI,2008