Unit - 4
Graphs
A graph can be defined as group of vertices and edges that are used to connect these vertices. A graph can be seen as a cyclic tree, where the vertices (Nodes) maintain any complex relationship among them instead of having parent child relationship.
Definition
A graph G can be defined as an ordered set G (V, E) where V(G) represents the set of vertices and E(G) represents the set of edges which are used to connect these vertices.
A Graph G (V, E) with 5 vertices (A, B, C, D, E) and six edges ((A, B), (B, C), (C, E), (E, D), (D, B), (D, A)) is shown in the following figure.
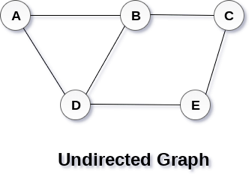
Fig 1– Undirected graph
Directed and Undirected Graph
A graph can be directed or undirected. However, in an undirected graph, edges are not associated with the directions with them. An undirected graph is shown in the above figure since its edges are not attached with any of the directions. If an edge exists between vertex A and B then the vertices can be traversed from B to A as well as A to B.
In a directed graph, edges form an ordered pair. Edges represent a specific path from some vertex A to another vertex B. Node A is called the initial node while node B is called terminal node.
A directed graph is shown in the following figure.
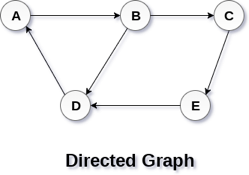
Fig 2– Directed graph
Graph Terminology
Path
A path can be defined as the sequence of nodes that are followed in order to reach some terminal node V from the initial node U.
Closed Path
A path will be called as closed path if the initial node is same as terminal node. A path will be closed path if V0=VN.
Simple Path
If all the nodes of the graph are distinct with an exception V0=VN, then such path P is called as closed simple path.
Cycle
A cycle can be defined as the path which has no repeated edges or vertices except the first and last vertices.
Connected Graph
A connected graph is the one in which some path exists between every two vertices (u, v) in V. There are no isolated nodes in connected graph.
Complete Graph
A complete graph is the one in which every node is connected with all other nodes. A complete graph contain n(n-1)/2 edges where n is the number of nodes in the graph.
Weighted Graph
In a weighted graph, each edge is assigned with some data such as length or weight. The weight of an edge e can be given as w(e) which must be a positive (+) value indicating the cost of traversing the edge.
Digraph
A digraph is a directed graph in which each edge of the graph is associated with some direction and the traversing can be done only in the specified direction.
Loop
An edge that is associated with the similar end points can be called as Loop.
Adjacent Nodes
If two nodes u and v are connected via an edge e, then the nodes u and v are called as neighbours or adjacent nodes.
Degree of the Node
A degree of a node is the number of edges that are connected with that node. A node with degree 0 is called as isolated node.
Key takeaway
- A graph can be defined as group of vertices and edges that are used to connect these vertices.
- A graph can be seen as a cyclic tree, where the vertices (Nodes) maintain any complex relationship among them instead of having parent child relationship.
Graph traversal is a method for finding a vertex in a graph. It's also utilised to determine the order in which vertices should be visited during the search.
Without producing loops, a graph traversal finds the edges to be employed in the search process. This means that using graph traversal, we can visit all of the graph's vertices without being stuck in a loop. There are two methods for traversing a graph:
● DFS (Depth First Search)
● BFS (Breadth-First Search)
Depth First Search
Depth First Search is an algorithm for traversing or searching a graph.
It starts from some node as the root node and explores each and every branch of that node before backtracking to the parent node.
DFS is an uninformed search that progresses by expanding the first child node of the graph that appears and thus going deeper and deeper until a goal node is found, or until it hits a node that has no children.
Then the search backtracks, returning to the most recent node it hadn't finished exploring. In a non-recursive implementation, all freshly expanded nodes are added to a LIFO stack for expansion.
Steps for implementing Depth first search
Step 1: - Define an array A or Vertex that store Boolean values, its size should be greater or equal to the number of vertices in the graph G.
Step 2: - Initialize the array A to false
Step 3: - For all vertices v in G
If A[v] = false
Process (v)
Step 4: - Exit
Algorithm for DFS
DFS(G)
{
for each v in V, //for loop V+1 times
{
Color[v]=white; // V times
p[v]=NULL; // V times
}
time=0; // constant time O (1)
for each u in V, //for loop V+1 times
if (color[u]==white) // V times
DFSVISIT(u) // call to DFSVISIT(v), at most V times O(V)
}
DFSVISIT(u)
{
color[u]=gray; // constant time
t[u] = ++time;
for each v in Adj(u) // for loop
if (color[v] == white)
{
p[v] = u;
DFSVISIT(v); // call to DFSVISIT(v)
}
color[u] = black; // constant time
f[u]=++time; // constant time
}
DFS algorithm used to solve following problems:
● Testing whether graph is connected.
● Computing a spanning forest of graph.
● Computing a path between two vertices of graph or equivalently reporting that no such path exists.
● Computing a cycle in graph or equivalently reporting that no such cycle exists.
Analysis of DFS
In the above algorithm, there is only one DFSVISIT(u) call for each vertex u in the vertex set V. Initialization complexity in DFS(G) for loop is O(V). In second for loop of DFS(G), complexity is O(V) if we leave the call of DFSVISIT(u).
Now, let us find the complexity of function DFSVISIT(u)
The complexity of for loop will be O(deg(u)+1) if we do not consider the recursive call to DFSVISIT(v). For recursive call to DFSVISIT(v), (complexity will be O(E) as
Recursive call to DFSVISIT(v) will be at most the sum of degree of adjacency for all vertex v in the vertex set V. It can be written as ∑ |Adj(v)|=O(E) vεV
The running time of DSF is (V + E).
Breadth First Search
It is an uninformed search methodology which first expand and examine all nodes of graph systematically in search of the solution in the sequence and then go at the deeper level. In other words, it exhaustively searches the entire graph without considering the goal until it finds it.
From the standpoint of the algorithm, all child nodes obtained by expanding a node are added to a FIFO queue. In typical implementations, nodes that have not yet been examined for their neighbors are placed in some container (such as a queue or linked list) called "open" and then once examined are placed in the container "closed".
Steps for implementing Breadth first search
Step 1: - Initialize all the vertices by setting Flag = 1
Step 2: - Put the starting vertex A in Q and change its status to the waiting state by setting Flag = 0
Step 3: - Repeat through step 5 while Q is not NULL
Step 4: - Remove the front vertex v of Q. Process v and set the status of v to the processed status by setting Flag = -1
Step 5: - Add to the rear of Q all the neighbour of v that are in the ready state by setting Flag = 1 and change their status to the waiting state by setting flag = 0
Step 6: - Exit
Algorithm for BFS
BFS (G, s)
{
for each v in V - {s} // for loop {
color[v]=white;
d[v]= INFINITY;
p[v]=NULL;
}
color[s] = gray;
d[s]=0;
p[s]=NULL;
Q = ø; // Initialize queue is empty
Enqueue(Q, s); /* Insert start vertex s in Queue Q */
while Q is nonempty // while loop
{
u = Dequeue[Q]; /* Remove an element from Queue Q*/
for each v in Adj[u] // for loop
{ if (color[v] == white) /*if v is unvisted*/
{
color[v] = gray; /* v is visted */
d[v] = d[u] + 1; /*Set distance of v to no. Of edges from s to u*/
p[v] = u; /*Set parent of v*/
Enqueue(Q,v); /*Insert v in Queue Q*/
}
}
color[u] = black; /*finally visted or explored vertex u*/
}
}
Breadth First Search algorithm used in
● Prim's MST algorithm.
● Dijkstra's single source shortest path algorithm.
● Testing whether graph is connected.
● Computing a cycle in graph or reporting that no such cycle exists.
Analysis of BFS
In this algorithm first for loop executes at most O(V) times.
While loop executes at most O(V) times as every vertex v in V is enqueued only once in the Queue Q. Every vertex is enqueued once and dequeued once so queuing will take at most O(V) time.
Inside while loop, there is for loop which will execute at most O(E) times as it will be at most the sum of degree of adjacency for all vertex v in the vertex set V.
Which can be written as
∑ |Adj(v)|=O(E)
vεV
Total running time of BFS is O(V + E).
Like depth first search, BFS traverse a connected component of a given graph and defines a spanning tree.
Space complexity of DFS is much lower than BFS (breadth-first search). It also lends itself much better to heuristic methods of choosing a likely-looking branch. Time complexity of both algorithms are proportional to the number of vertices plus the number of edges in the graphs they traverse.
Key takeaways
- Depth First Search is an algorithm for traversing or searching a graph.
- DFS is an uninformed search that progresses by expanding the first child node of the graph that appears and thus going deeper and deeper until a goal node is found, or until it hits a node that has no children.
- BFS is an uninformed search methodology which first expand and examine all nodes of graph systematically in search of the solution in the sequence and then goes to the deeper level.
- In other words, it exhaustively searches the entire graph without considering the goal until it finds it.
Graph Representation
By Graph representation, we simply mean the technique which is to be used in order to store some graph into the computer's memory.
There are two ways to store Graph into the computer's memory.
1. Sequential Representation
In sequential representation, we use an adjacency matrix to store the mapping represented by vertices and edges. In adjacency matrix, the rows and columns are represented by the graph vertices. A graph having n vertices, will have a dimension n x n.
An entry Mij in the adjacency matrix representation of an undirected graph G will be 1 if there exists an edge between Vi and Vj.
An undirected graph and its adjacency matrix representation is shown in the following figure.
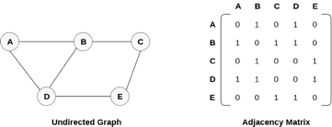
Fig 3– Undirected graph and its adjacency matrix
In the above figure, we can see the mapping among the vertices (A, B, C, D, E) is represented by using the adjacency matrix which is also shown in the figure.
There exists different adjacency matrices for the directed and undirected graph. In directed graph, an entry Aij will be 1 only when there is an edge directed from Vi to Vj.
A directed graph and its adjacency matrix representation is shown in the following figure.
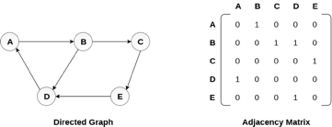
Fig 4- Directed graph and its adjacency matrix
Representation of weighted directed graph is different. Instead of filling the entry by 1, the Non- zero entries of the adjacency matrix are represented by the weight of respective edges.
The weighted directed graph along with the adjacency matrix representation is shown in the following figure.
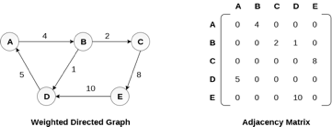
Fig 5 - Weighted directed graph
Adjacency list
Linked Representation
In the linked representation, an adjacency list is used to store the Graph into the computer's memory.
Consider the undirected graph shown in the following figure and check the adjacency list representation.

Fig 6- Undirected graph in adjacency list
An adjacency list is maintained for each node present in the graph which stores the node value and a pointer to the next adjacent node to the respective node. If all the adjacent nodes are traversed then store the NULL in the pointer field of the last node of the list. The sum of the lengths of adjacency lists is equal to twice of the number of edges present in an undirected graph.
Consider the directed graph shown in the following figure and check the adjacency list representation of the graph.
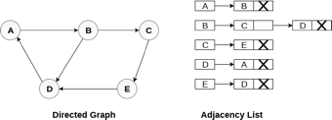
Fig 7- Directed graph in adjacency list
In a directed graph, the sum of lengths of all the adjacency lists is equal to the number of edges present in the graph.
In the case of weighted directed graph, each node contains an extra field that is called the weight of the node. The adjacency list representation of a directed graph is shown in the following figure.

Fig 8- Weighted directed graph
Key takeaway
- By Graph representation, we simply mean the technique which is to be used in order to store some graph into the computer's memory.
- There are two ways to store Graph into the computer's memory.
- In the linked representation, an adjacency list is used to store the Graph into the computer's memory.
- An adjacency list is maintained for each node present in the graph which stores the node value and a pointer to the next adjacent node to the respective node.
Bellman-Ford Algorithm shortest path
Solves single shortest path problem in which edge weight may be negative but no negative cycle exists.
This algorithm works correctly when some of the edges of the directed graph G may have negative weight. When there are no cycles of negative weight, then we can find out the shortest path between source and destination.
It is slower than Dijkstra's Algorithm but more versatile, as it capable of handling some of the negative weight edges.
This algorithm detects the negative cycle in a graph and reports their existence.
Based on the "Principle of Relaxation" in which more accurate values gradually recovered an approximation to the proper distance by until eventually reaching the optimum solution.
Given a weighted directed graph G = (V, E) with source s and weight function w: E → R, the Bellman-Ford algorithm returns a Boolean value indicating whether or not there is a negative weight cycle that is attainable from the source. If there is such a cycle, the algorithm produces the shortest paths and their weights. The algorithm returns TRUE if and only if a graph contains no negative - weight cycles that are reachable from the source.
Recurrence Relation
Distk [u] = [min[distk-1 [u],min[ distk-1 [i]+cost [i,u]]] as i except u.
k → k is the source vertex
u → u is the destination vertex
i → no of edges to be scanned concerning a vertex.
BELLMAN -FORD (G, w, s)
1. INITIALIZE - SINGLE - SOURCE (G, s)
2. For i ← 1 to |V[G]| - 1
3. Do for each edge (u, v) ∈ E [G]
4. Do RELAX (u, v, w)
5. For each edge (u, v) ∈ E [G]
6. Do if d [v] > d [u] + w (u, v)
7. Then return FALSE.
8. Return TRUE.
Example: Here first we list all the edges and their weights.
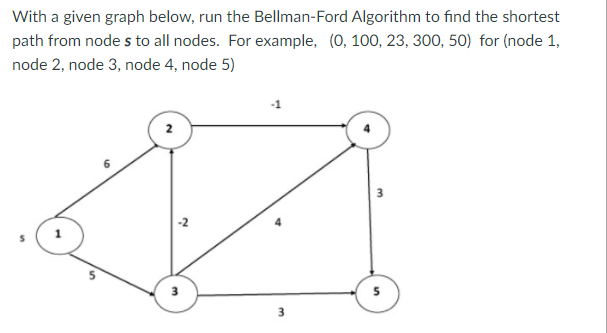
Solution:
Distk [u] = [min[distk-1 [u],min[distk-1 [i]+cost [i,u]]] as i ≠ u.
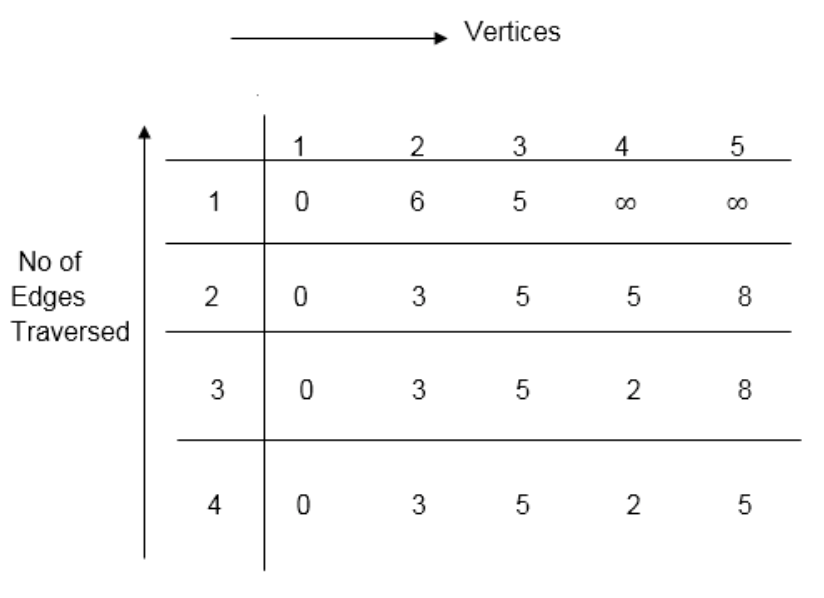
Dist2 [2]=min[dist1 [2],min[dist1 [1]+cost[1,2],dist1 [3]+cost[3,2],dist1 [4]+cost[4,2],dist1 [5]+cost[5,2]]]
Min = [6, 0 + 6, 5 + (-2), ∞ + ∞ , ∞ +∞] = 3
Dist2 [3]=min[dist1 [3],min[dist1 [1]+cost[1,3],dist1 [2]+cost[2,3],dist1 [4]+cost[4,3],dist1 [5]+cost[5,3]]]
Min = [5, 0 +∞, 6 +∞, ∞ + ∞ , ∞ + ∞] = 5
Dist2 [4]=min[dist1 [4],min[dist1 [1]+cost[1,4],dist1 [2]+cost[2,4],dist1 [3]+cost[3,4],dist1 [5]+cost[5,4]]]
Min = [∞, 0 +∞, 6 + (-1), 5 + 4, ∞ +∞] = 5
Dist2 [5]=min[dist1 [5],min[dist1 [1]+cost[1,5],dist1 [2]+cost[2,5],dist1 [3]+cost[3,5],dist1 [4]+cost[4,5]]]
Min = [∞, 0 + ∞,6 + ∞,5 + 3, ∞ + 3] = 8
Dist3 [2]=min[dist2 [2],min[dist2 [1]+cost[1,2],dist2 [3]+cost[3,2],dist2 [4]+cost[4,2],dist2 [5]+cost[5,2]]]
Min = [3, 0 + 6, 5 + (-2), 5 + ∞ , 8 + ∞ ] = 3
Dist3 [3]=min[dist2 [3],min[dist2 [1]+cost[1,3],dist2 [2]+cost[2,3],dist2 [4]+cost[4,3],dist2 [5]+cost[5,3]]]
Min = [5, 0 + ∞, 3 + ∞, 5 + ∞,8 + ∞ ] = 5
Dist3 [4]=min[dist2 [4],min[dist2 [1]+cost[1,4],dist2 [2]+cost[2,4],dist2 [3]+cost[3,4],dist2 [5]+cost[5,4]]]
Min = [5, 0 + ∞, 3 + (-1), 5 + 4, 8 + ∞ ] = 2
Dist3 [5]=min[dist2 [5],min[dist2 [1]+cost[1,5],dist2 [2]+cost[2,5],dist2 [3]+cost[3,5],dist2 [4]+cost[4,5]]]
Min = [8, 0 + ∞, 3 + ∞, 5 + 3, 5 + 3] = 8
Dist4 [2]=min[dist3 [2],min[dist3 [1]+cost[1,2],dist3 [3]+cost[3,2],dist3 [4]+cost[4,2],dist3 [5]+cost[5,2]]]
Min = [3, 0 + 6, 5 + (-2), 2 + ∞, 8 + ∞ ] =3
Dist4 [3]=min[dist3 [3],min[dist3 [1]+cost[1,3],dist3 [2]+cost[2,3],dist3 [4]+cost[4,3],dist3 [5]+cost[5,3]]]
Min = 5, 0 + ∞, 3 + ∞, 2 + ∞, 8 + ∞ ] =5
Dist4 [4]=min[dist3 [4],min[dist3 [1]+cost[1,4],dist3 [2]+cost[2,4],dist3 [3]+cost[3,4],dist3 [5]+cost[5,4]]]
Min = [2, 0 + ∞, 3 + (-1), 5 + 4, 8 + ∞ ] = 2
Dist4 [5]=min[dist3 [5],min[dist3 [1]+cost[1,5],dist3 [2]+cost[2,5],dist3 [3]+cost[3,5],dist3 [5]+cost[4,5]]]
Min = [8, 0 +∞, 3 + ∞, 8, 5] = 5
Minimum spanning tree
In the Greedy approach MST (Minimum Spanning Trees) is used to find the cost or the minimum path. Let G= (V, E) be an undirected connected graph, also T= (V’, E’) be a subgraph of the spanning tree G if and only if T is a tree.
Spanning trees are usually used to get an independent set of circuit’s equations in the electrical network. Once the spanning tree is obtained, suppose B is a set of edges not present in the spanning tree then adding one edge from B will form an electrical cycle.
A spanning tree is a minimal subgraph G’ of G such that V (G’) =V (G) and G’ is connected by a minimal subgraph. Any connected graph with n vertices must have at least n-1 edges and all connected graphs with n-1 edges are trees. The spanning trees of G will represent all feasible choices. The best spanning tree is tree with the minimum cost.
The cost of the spanning tree is nothing but the sum of the cost of the edges in that tree. Any tree consisting of edges of a graph and including all the vertices of the graph is known as a “Spanning Tree”.
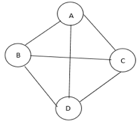
Fig 9: Graph with vertices
The above figure shows a graph with four vertices and some of its spanning tree are shown as below:
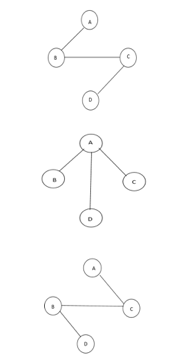
Fig 10: Spanning tree
Minimum Cost Spanning Tree
Definition: Let G= (V, E) be an undirected connected graph. A sub-graph t= (V, E’) of G is a spanning tree of G if t is a tree.
Spanning trees have many applications. It can be used to obtain an independent set of circuit equations for an electric network.
In Greedy approach a Minimum Cost Spanning Tree is created using the given graph G. Let us consider a connected weighted graph G our aim here is to create a spanning tree T for G such that the sum of the weights of the tree edges in T is as small as possible.
To do so the greedy approach is to draw the tree by selecting edge by edge. Initially the first edge is selected and then the next edge is selected by considering the lowest cost. The process selecting edges one by one goes on till all the vertices have been visited with the edges of the minimum cost.
There are two ways to do so: -
- Kruskal’s Algorithm: - Here edges of the graph are considered in non-decreasing order of cost. The set of T of edges so far selected for the spanning tree should be such that it is possible to complete T into a tree.
- Prim’s Algorithm: - Here the set of edges so far selected should from a tree. Now if A is the set of edges selected so far, then A has to form a tree. The next edge (u, v) to be included in A is a minimum cost edge not in A with the property that A ∪ {(u, v)} also results in a tree.
Key takeaways
- In the Greedy approach Minimum Spanning Trees is used to find the cost or the minimum path.
- Spanning trees have many applications. It can be used to obtain an independent set of circuit equations for an electric network.
- A spanning tree is a minimal subgraph G’ of G such that V (G’) =V (G) and G’ is connected by a minimal subgraph.
Application of BFS
The following are some of the most important BFS applications:
Un-weighted Graphs
The BFS technique can quickly generate the shortest path and a minimum spanning tree in order to visit all of the graph's vertices in the lowest amount of time while maintaining excellent accuracy.
P2P networks
In a peer-to-peer network, BFS can be used to locate all of the closest or nearby nodes. This will help you discover the information you need faster.
Web Crawlers
Using BFS, search engines or web crawlers may quickly create many tiers of indexes. The BFS implementation begins with the source, which is a web page, and then proceeds through all of the links on that page.
Networking broadcasting
The BFS algorithm guides a broadcast packet to find and reach all of the nodes for whom it has an address.
Application of DFS
The following are some of the most important DFS applications:
Weighted Graph
DFS graph traversal provides the shortest path tree and least spanning tree in a weighted graph.
Detecting a Cycle in a Graph
If we discovered a back edge during DFS, the graph exhibits a cycle. As a result, we should perform DFS on the graph and double-check the back edges.
Path Finding
We can specialize in finding a path between two vertices using the DFS algorithm.
Topological Sorting
It's mostly used to schedule jobs based on the interdependence between groups of jobs. It is utilized in instruction scheduling, data serialization, logic synthesis, and selecting the order of compilation processes in computer science.
Searching Strongly Connected Components of a Graph
When there is a path from each and every vertex in the graph to the remaining vertex, it is employed in a DFS graph.
Solving Puzzles with Only One Solution
By incorporating nodes on the existing path in the visited set, the DFS algorithm may easily be extended to find all solutions to a maze.
Hashing is implemented using one of two methods:
● Hashing with Chaining
● Hashing with open addressing
Hashing with chaining
The element in S is stored in Hash table T [0...m-1] of size m, where m is somewhat greater than n, the size of S, in Hashing with Chaining. There are m slots in the hash table. A hash function h is associated with the hashing technique, and it maps from U to {0...m-1}. We say that k is hashed into slot h since each key k ∈ S is kept in location T [h (k)] (k). A collision occurs when more than one key in S is hashed into the same slot.
All keys that hash into the same slot are placed in a linked list associated with that slot, which is referred to as the chain at slot. A hash table's load factor is defined as ∝=n/m, which represents the average amount of keys per slot. Because we frequently work in the m=θ(n) range, ∝ is usually a constant of ∝<1.
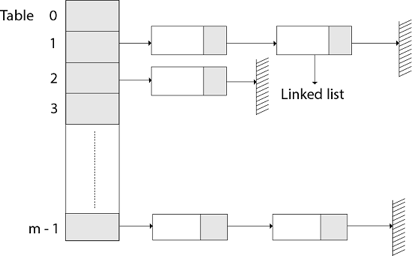
Fig 11: Hashing with chaining
Hashing with open address
All components in Open Addressing are kept in the hash table. That is, each table entry contains a dynamic set component or NIL. When looking for anything, we check table slots until we either find the item or establish that it isn't in the table. As a result, the load factor in open addressing can never exceed 1.
Open addressing has the advantage of avoiding Pointer. We compute the sequence of slots to be examined in this step. Because no pointers are shared, the hash table can have a larger number of slots for the same amount of memory, potentially resulting in fewer collisions and faster retrieval.
Probing is the process of inspecting a position in the hash table.
As a result, the hash function is transformed.
h : U x {0,1,....m-1} → {0,1,....,m-1}.
With open addressing, we need the probe sequence for every key k.
{h, (k, 0), h (k, 1)....h (k, m-1)}
Be a Permutation of (0, 1...... m-1)
A hash table T and a key k are passed to the HASH-INSERT method as inputs.
HASH-INSERT (T, k)
1. i ← 0
2. Repeat j ← h (k, i)
3. If T [j] = NIL
4. Then T [j] ← k
5. Return j
6. Else ← i= i +1
7. Until i=m
8. Error "hash table overflow"
The procedure HASH-SEARCH takes a hash table T and a key k as input and returns j if key k is found in slot j or NIL if key k is not found in table T.
HASH-SEARCH.T (k)
1. i ← 0
2. Repeat j ← h (k, i)
3. If T [j] =j
4. Then return j
5. i ← i+1
6. Until T [j] = NIL or i=m
7. Return NIL
Compilers construct and maintain symbol tables to record information about the presence of various entities such as variable names, function names, objects, classes, and interfaces, among other things. Both the analysis and synthesis components of a compiler use the symbol table.
Depending on the language, a symbol table may be used for the following purposes:
● To keep all of the names of all entities in one place in a systematic format.
● To determine whether or not a variable has been declared.
● Type checking is implemented by ensuring that assignments and expressions in source code are semantically accurate.
● to figure out what a name's scope is (scope resolution).
A symbol table is a simple table that can be linear or hash-based. It keeps track of each name using the following format:
<symbol name, type, attribute>
The compiler creates and maintains the Symbol Table in order to keep track of variable semantics, i.e. it keeps information about the scope and binding information about names, information about instances of various things such as variable and function names, classes, objects, and so on.
● It has lexical and syntax analysis steps built in.
● The information is collected by the compiler's analysis phases and used by the compiler's synthesis phases to build code.
● The compiler uses it to improve compile-time performance.
Symbol Table entries –
Each entry in the symbol table is linked to a set of properties that assist the compiler at various stages.
Items stored in Symbol table:
● Constants and variable names
● Names of procedures and functions.
● Strings and literal constants
● Temporaries were created by the compiler.
● Labels in the languages of origin.
Information used by the compiler from Symbol table:
● Data type and name
● Declaring procedures
● Offset in storage
● If structure or record then, a pointer to structure table.
● For parameters, whether parameter passing by value or by reference
● Number and type of arguments passed to function
● Base Address
Static data structure
The size of a static data structure is predetermined. The data structure's content can be changed without affecting the memory space allotted to it.

Fig 12: Example of static tree table
Dynamic data structure
The size of a dynamic data structure is not fixed and can be changed while operations are being performed on it. Dynamic data structures are intended to allow for data structure changes in real time.

Static Data Structure vs Dynamic Data Structure
The memory size of a static data structure is fixed, whereas the size of a dynamic data structure can be arbitrarily modified during runtime, making it more efficient in terms of memory complexity. In comparison to dynamic data structures, static data structures give easier access to elements. Dynamic data structures, unlike static data structures, are adaptable.
A hash table is a type of data structure that employs a particular function known as a hash function to map a given value to a key in order to retrieve elements more quickly.
A hash table is a data structure that stores information with two major components: key and value. With the help of an associative array, a hash table can be created. The effectiveness of the hash function used for mapping is determined by the efficiency of the hash function used for mapping.
A hash table is a data structure that stores data in a way that is associative. Data is stored in an array format in a hash table, with each data value having its own unique index value. If we know the index of the needed data, data access becomes very quick.
As a result, it becomes a data structure in which insertion and search operations are extremely quick, regardless of data size. Hash Tables store data in an array and utilize the hash technique to generate an index from which an element can be inserted or located.
For example, if the key value is John and the value is the phone number, we may use the following hash function to pass the key value:
Hash(key)= index;
The index is returned when the key is passed to the hash function.
Hash(john) = 3;
The john is added to the index 3 in the example above.
Hashing
Hashing is a method of converting a set of key values into a set of array indexes. To get a range of key values, we'll utilise the modulo operator. Consider an example of hash table of size 20, and the following items are to be stored. Item are in the (key,value) format.

● (1,20)
● (2,70)
● (42,80)
● (4,25)
● (12,44)
● (14,32)
● (17,11)
● (13,78)
● (37,98)
Sr.No. | Key | Hash | Array Index |
1 | 1 | 1 % 20 = 1 | 1 |
2 | 2 | 2 % 20 = 2 | 2 |
3 | 42 | 42 % 20 = 2 | 2 |
4 | 4 | 4 % 20 = 4 | 4 |
5 | 12 | 12 % 20 = 12 | 12 |
6 | 14 | 14 % 20 = 14 | 14 |
7 | 17 | 17 % 20 = 17 | 17 |
8 | 13 | 13 % 20 = 13 | 13 |
9 | 37 | 37 % 20 = 17 | 17 |
The Hash Function is used to index the original value or key, and it is then utilized to obtain the data associated with the value or key. As a result, hashing is always a one-way process. By studying the hashed values, there is no need to "reverse engineer" the hash algorithm.
Characteristics of Good Hash Function:
● The data being hashed completely determines the hash value.
● All of the input data is used by the hash function.
● The hash function distributes the data "uniformly" across all potential hash values.
● For comparable strings, the hash function gives complicated hash values.
Some hash function
Division method
Select a number m that is less than the number of n keys in k. (The number m is usually chosen to be a prime number or a number without small divisors, since this frequently has a minimum number of collisions).
The hash function is as follows:
h (k) = k mod m h (k) = k mod m + 1
Example - If m = 12 is the size of the hash table and k = 100 is the key, then h (k) = 4. Hashing via division is quick since it just requires one division operation.
Multiplication method
There are two phases to producing hash functions using the multiplication approach. First, we extract the fractional component of kA by multiplying the key k by a constant A in the range 0 A 1. Then we multiply this value by m and take the result's floor.
The hash function is as follows:
h (k) = m(k A mod 1
The fractional component of k A, k A -k A, is denoted by "k A mod 1."
Mid square method
The letter k has been squared. The function H is therefore defined as follows:
H (k) = L
L is found by subtracting digits from both ends of k2. We underline that k2 must be used in the same place for all keys.
Folding method
The key k is divided into a number of components k1, k2,... Kn, each with the same amount of digits as the needed address except maybe the last.
The pieces are then combined together, with the last carry ignored.
H (k) = k1+ k2+.....+kn
Key takeaway
The Hash Function is used to index the original value or key, and it is then utilized to obtain the data associated with the value or key.
As a result, hashing is always a one-way process.
● The hash function is utilized to find the array's index in this case.
● The hash value is used as an index in the hash table to hold the key.
● For two or more keys, the hash function can return the same hash value.
● A collision occurs when two or more keys are given the same hash value. Collision resolution strategies are used to deal with this collision.
Collision resolution techniques
Collision resolution strategies are divided into two categories.
● Separate chaining (open hashing)
● Open addressing (closed hashing)
Separate chaining
This strategy involves creating a linked list from the slot where the collision occurred, then inserting the new key into the linked list. Separate chaining refers to the linked list of slots that resembles a chain. When we don't know how many keys to insert or remove, we use it more.
Time complexity
● Its worst-case searching complexity is o (n).
● Its worst-case deletion complexity is o (n).
Advantages of separate chaining
● It is simple to put into practice.
● We can add more elements to the chain because the hash table never fills up.
● It is less sensitive to the hashing function.
Disadvantages of separate chaining
● Chaining cache performance is poor in this case.
● In this strategy, there is far too much memory waste.
● It necessitates a larger amount of space for element linkages.
Open addressing
Open addressing is a collision-resolution technique for preventing collisions in hashing tables. Outside of the hash table, no key is stored. As a result, the hash table's size is always more than or equal to the number of keys. Closed hashing is another name for it.
In open addressing, the following strategies are used:
● Linear probing
● Quadratic probing
● Double hashing
Key takeaway
The hash function is utilized to find the array's index in this case.
The hash value is used as an index in the hash table to hold the key.
For two or more keys, the hash function can return the same hash value.
The size of a static data structure is predetermined. The data structure's content can be changed without affecting the memory space allotted to it. When the home bucket for a new pair (key, element) is full, an overflow occurs.
We might be able to deal with overflows by
Look through the hash table in a systematic manner for an empty bucket.
● Linear probing (linear open addressing).
● Quadratic probing.
● Random probing.
Allow each bucket to preserve a list of all pairings for which it is the home bucket to avoid overflows.
● Array linear list.
● Chain.
Open addressing is used to ensure that all elements are placed directly in the hash table, and it uses a variety of approaches to resolve collisions.
To resolve collisions, Linear Probing is used to place the data into the next available space in the table.
Performance of Linear Probing
● The worst-case time for find/insert/erase is (m), where m is the number of pairings in the table.
● When all pairings are in the same cluster, this happens.
Problem of Linear Probing
● Identifiers have a tendency to group together.
● Adjacent clusters are forming a ring.
● Increase or improve the time spent searching.
Random Probing
Random Probing performs incorporating with random numbers.
H(x):= (H’(x) + S[i]) % b
S[i] is a table along with size b-1
S[i] is indicated as a random permutation of integers [1, b-1].
References:
- Data Structures and program design in C by Robert Kruse, Bruce Leung & Clovis Tondo.
- Data Structures: A Pseudocode Approach with C by Richard F. Gilberg and
Behrouz Forouzan.
3. Data Structures using C by Tanenbaum, Pearson Education
4. Data structures and Algorithm Analysis in C, 2nd edition, M.A.Weiss, Pearson
Unit - 4
Graphs
A graph can be defined as group of vertices and edges that are used to connect these vertices. A graph can be seen as a cyclic tree, where the vertices (Nodes) maintain any complex relationship among them instead of having parent child relationship.
Definition
A graph G can be defined as an ordered set G (V, E) where V(G) represents the set of vertices and E(G) represents the set of edges which are used to connect these vertices.
A Graph G (V, E) with 5 vertices (A, B, C, D, E) and six edges ((A, B), (B, C), (C, E), (E, D), (D, B), (D, A)) is shown in the following figure.
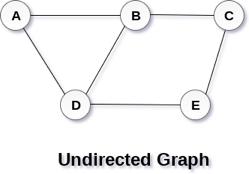
Fig 1– Undirected graph
Directed and Undirected Graph
A graph can be directed or undirected. However, in an undirected graph, edges are not associated with the directions with them. An undirected graph is shown in the above figure since its edges are not attached with any of the directions. If an edge exists between vertex A and B then the vertices can be traversed from B to A as well as A to B.
In a directed graph, edges form an ordered pair. Edges represent a specific path from some vertex A to another vertex B. Node A is called the initial node while node B is called terminal node.
A directed graph is shown in the following figure.
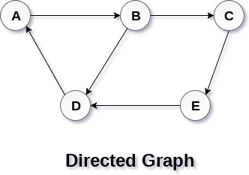
Fig 2– Directed graph
Graph Terminology
Path
A path can be defined as the sequence of nodes that are followed in order to reach some terminal node V from the initial node U.
Closed Path
A path will be called as closed path if the initial node is same as terminal node. A path will be closed path if V0=VN.
Simple Path
If all the nodes of the graph are distinct with an exception V0=VN, then such path P is called as closed simple path.
Cycle
A cycle can be defined as the path which has no repeated edges or vertices except the first and last vertices.
Connected Graph
A connected graph is the one in which some path exists between every two vertices (u, v) in V. There are no isolated nodes in connected graph.
Complete Graph
A complete graph is the one in which every node is connected with all other nodes. A complete graph contain n(n-1)/2 edges where n is the number of nodes in the graph.
Weighted Graph
In a weighted graph, each edge is assigned with some data such as length or weight. The weight of an edge e can be given as w(e) which must be a positive (+) value indicating the cost of traversing the edge.
Digraph
A digraph is a directed graph in which each edge of the graph is associated with some direction and the traversing can be done only in the specified direction.
Loop
An edge that is associated with the similar end points can be called as Loop.
Adjacent Nodes
If two nodes u and v are connected via an edge e, then the nodes u and v are called as neighbours or adjacent nodes.
Degree of the Node
A degree of a node is the number of edges that are connected with that node. A node with degree 0 is called as isolated node.
Key takeaway
- A graph can be defined as group of vertices and edges that are used to connect these vertices.
- A graph can be seen as a cyclic tree, where the vertices (Nodes) maintain any complex relationship among them instead of having parent child relationship.
Graph traversal is a method for finding a vertex in a graph. It's also utilised to determine the order in which vertices should be visited during the search.
Without producing loops, a graph traversal finds the edges to be employed in the search process. This means that using graph traversal, we can visit all of the graph's vertices without being stuck in a loop. There are two methods for traversing a graph:
● DFS (Depth First Search)
● BFS (Breadth-First Search)
Depth First Search
Depth First Search is an algorithm for traversing or searching a graph.
It starts from some node as the root node and explores each and every branch of that node before backtracking to the parent node.
DFS is an uninformed search that progresses by expanding the first child node of the graph that appears and thus going deeper and deeper until a goal node is found, or until it hits a node that has no children.
Then the search backtracks, returning to the most recent node it hadn't finished exploring. In a non-recursive implementation, all freshly expanded nodes are added to a LIFO stack for expansion.
Steps for implementing Depth first search
Step 1: - Define an array A or Vertex that store Boolean values, its size should be greater or equal to the number of vertices in the graph G.
Step 2: - Initialize the array A to false
Step 3: - For all vertices v in G
If A[v] = false
Process (v)
Step 4: - Exit
Algorithm for DFS
DFS(G)
{
for each v in V, //for loop V+1 times
{
Color[v]=white; // V times
p[v]=NULL; // V times
}
time=0; // constant time O (1)
for each u in V, //for loop V+1 times
if (color[u]==white) // V times
DFSVISIT(u) // call to DFSVISIT(v), at most V times O(V)
}
DFSVISIT(u)
{
color[u]=gray; // constant time
t[u] = ++time;
for each v in Adj(u) // for loop
if (color[v] == white)
{
p[v] = u;
DFSVISIT(v); // call to DFSVISIT(v)
}
color[u] = black; // constant time
f[u]=++time; // constant time
}
DFS algorithm used to solve following problems:
● Testing whether graph is connected.
● Computing a spanning forest of graph.
● Computing a path between two vertices of graph or equivalently reporting that no such path exists.
● Computing a cycle in graph or equivalently reporting that no such cycle exists.
Analysis of DFS
In the above algorithm, there is only one DFSVISIT(u) call for each vertex u in the vertex set V. Initialization complexity in DFS(G) for loop is O(V). In second for loop of DFS(G), complexity is O(V) if we leave the call of DFSVISIT(u).
Now, let us find the complexity of function DFSVISIT(u)
The complexity of for loop will be O(deg(u)+1) if we do not consider the recursive call to DFSVISIT(v). For recursive call to DFSVISIT(v), (complexity will be O(E) as
Recursive call to DFSVISIT(v) will be at most the sum of degree of adjacency for all vertex v in the vertex set V. It can be written as ∑ |Adj(v)|=O(E) vεV
The running time of DSF is (V + E).
Breadth First Search
It is an uninformed search methodology which first expand and examine all nodes of graph systematically in search of the solution in the sequence and then go at the deeper level. In other words, it exhaustively searches the entire graph without considering the goal until it finds it.
From the standpoint of the algorithm, all child nodes obtained by expanding a node are added to a FIFO queue. In typical implementations, nodes that have not yet been examined for their neighbors are placed in some container (such as a queue or linked list) called "open" and then once examined are placed in the container "closed".
Steps for implementing Breadth first search
Step 1: - Initialize all the vertices by setting Flag = 1
Step 2: - Put the starting vertex A in Q and change its status to the waiting state by setting Flag = 0
Step 3: - Repeat through step 5 while Q is not NULL
Step 4: - Remove the front vertex v of Q. Process v and set the status of v to the processed status by setting Flag = -1
Step 5: - Add to the rear of Q all the neighbour of v that are in the ready state by setting Flag = 1 and change their status to the waiting state by setting flag = 0
Step 6: - Exit
Algorithm for BFS
BFS (G, s)
{
for each v in V - {s} // for loop {
color[v]=white;
d[v]= INFINITY;
p[v]=NULL;
}
color[s] = gray;
d[s]=0;
p[s]=NULL;
Q = ø; // Initialize queue is empty
Enqueue(Q, s); /* Insert start vertex s in Queue Q */
while Q is nonempty // while loop
{
u = Dequeue[Q]; /* Remove an element from Queue Q*/
for each v in Adj[u] // for loop
{ if (color[v] == white) /*if v is unvisted*/
{
color[v] = gray; /* v is visted */
d[v] = d[u] + 1; /*Set distance of v to no. Of edges from s to u*/
p[v] = u; /*Set parent of v*/
Enqueue(Q,v); /*Insert v in Queue Q*/
}
}
color[u] = black; /*finally visted or explored vertex u*/
}
}
Breadth First Search algorithm used in
● Prim's MST algorithm.
● Dijkstra's single source shortest path algorithm.
● Testing whether graph is connected.
● Computing a cycle in graph or reporting that no such cycle exists.
Analysis of BFS
In this algorithm first for loop executes at most O(V) times.
While loop executes at most O(V) times as every vertex v in V is enqueued only once in the Queue Q. Every vertex is enqueued once and dequeued once so queuing will take at most O(V) time.
Inside while loop, there is for loop which will execute at most O(E) times as it will be at most the sum of degree of adjacency for all vertex v in the vertex set V.
Which can be written as
∑ |Adj(v)|=O(E)
vεV
Total running time of BFS is O(V + E).
Like depth first search, BFS traverse a connected component of a given graph and defines a spanning tree.
Space complexity of DFS is much lower than BFS (breadth-first search). It also lends itself much better to heuristic methods of choosing a likely-looking branch. Time complexity of both algorithms are proportional to the number of vertices plus the number of edges in the graphs they traverse.
Key takeaways
- Depth First Search is an algorithm for traversing or searching a graph.
- DFS is an uninformed search that progresses by expanding the first child node of the graph that appears and thus going deeper and deeper until a goal node is found, or until it hits a node that has no children.
- BFS is an uninformed search methodology which first expand and examine all nodes of graph systematically in search of the solution in the sequence and then goes to the deeper level.
- In other words, it exhaustively searches the entire graph without considering the goal until it finds it.
Graph Representation
By Graph representation, we simply mean the technique which is to be used in order to store some graph into the computer's memory.
There are two ways to store Graph into the computer's memory.
1. Sequential Representation
In sequential representation, we use an adjacency matrix to store the mapping represented by vertices and edges. In adjacency matrix, the rows and columns are represented by the graph vertices. A graph having n vertices, will have a dimension n x n.
An entry Mij in the adjacency matrix representation of an undirected graph G will be 1 if there exists an edge between Vi and Vj.
An undirected graph and its adjacency matrix representation is shown in the following figure.
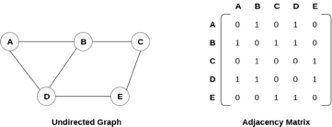
Fig 3– Undirected graph and its adjacency matrix
In the above figure, we can see the mapping among the vertices (A, B, C, D, E) is represented by using the adjacency matrix which is also shown in the figure.
There exists different adjacency matrices for the directed and undirected graph. In directed graph, an entry Aij will be 1 only when there is an edge directed from Vi to Vj.
A directed graph and its adjacency matrix representation is shown in the following figure.
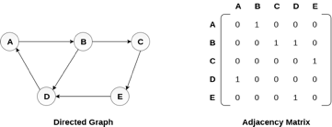
Fig 4- Directed graph and its adjacency matrix
Representation of weighted directed graph is different. Instead of filling the entry by 1, the Non- zero entries of the adjacency matrix are represented by the weight of respective edges.
The weighted directed graph along with the adjacency matrix representation is shown in the following figure.
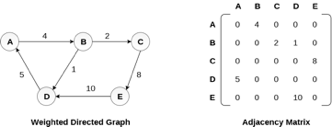
Fig 5 - Weighted directed graph
Adjacency list
Linked Representation
In the linked representation, an adjacency list is used to store the Graph into the computer's memory.
Consider the undirected graph shown in the following figure and check the adjacency list representation.

Fig 6- Undirected graph in adjacency list
An adjacency list is maintained for each node present in the graph which stores the node value and a pointer to the next adjacent node to the respective node. If all the adjacent nodes are traversed then store the NULL in the pointer field of the last node of the list. The sum of the lengths of adjacency lists is equal to twice of the number of edges present in an undirected graph.
Consider the directed graph shown in the following figure and check the adjacency list representation of the graph.
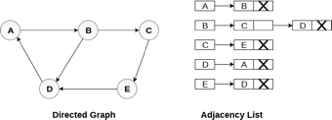
Fig 7- Directed graph in adjacency list
In a directed graph, the sum of lengths of all the adjacency lists is equal to the number of edges present in the graph.
In the case of weighted directed graph, each node contains an extra field that is called the weight of the node. The adjacency list representation of a directed graph is shown in the following figure.

Fig 8- Weighted directed graph
Key takeaway
- By Graph representation, we simply mean the technique which is to be used in order to store some graph into the computer's memory.
- There are two ways to store Graph into the computer's memory.
- In the linked representation, an adjacency list is used to store the Graph into the computer's memory.
- An adjacency list is maintained for each node present in the graph which stores the node value and a pointer to the next adjacent node to the respective node.
Bellman-Ford Algorithm shortest path
Solves single shortest path problem in which edge weight may be negative but no negative cycle exists.
This algorithm works correctly when some of the edges of the directed graph G may have negative weight. When there are no cycles of negative weight, then we can find out the shortest path between source and destination.
It is slower than Dijkstra's Algorithm but more versatile, as it capable of handling some of the negative weight edges.
This algorithm detects the negative cycle in a graph and reports their existence.
Based on the "Principle of Relaxation" in which more accurate values gradually recovered an approximation to the proper distance by until eventually reaching the optimum solution.
Given a weighted directed graph G = (V, E) with source s and weight function w: E → R, the Bellman-Ford algorithm returns a Boolean value indicating whether or not there is a negative weight cycle that is attainable from the source. If there is such a cycle, the algorithm produces the shortest paths and their weights. The algorithm returns TRUE if and only if a graph contains no negative - weight cycles that are reachable from the source.
Recurrence Relation
Distk [u] = [min[distk-1 [u],min[ distk-1 [i]+cost [i,u]]] as i except u.
k → k is the source vertex
u → u is the destination vertex
i → no of edges to be scanned concerning a vertex.
BELLMAN -FORD (G, w, s)
1. INITIALIZE - SINGLE - SOURCE (G, s)
2. For i ← 1 to |V[G]| - 1
3. Do for each edge (u, v) ∈ E [G]
4. Do RELAX (u, v, w)
5. For each edge (u, v) ∈ E [G]
6. Do if d [v] > d [u] + w (u, v)
7. Then return FALSE.
8. Return TRUE.
Example: Here first we list all the edges and their weights.
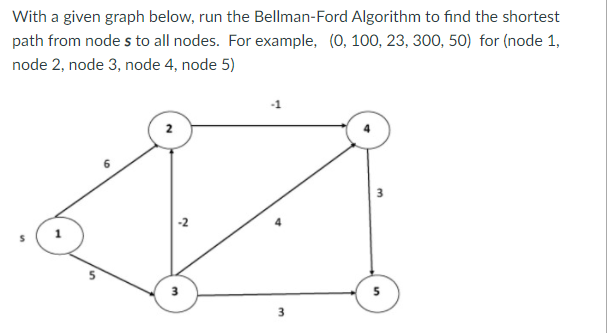
Solution:
Distk [u] = [min[distk-1 [u],min[distk-1 [i]+cost [i,u]]] as i ≠ u.
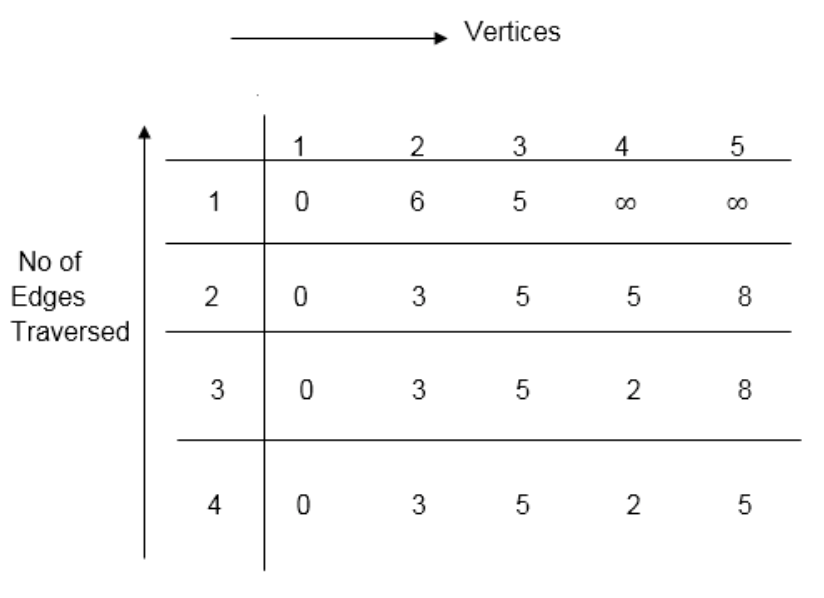
Dist2 [2]=min[dist1 [2],min[dist1 [1]+cost[1,2],dist1 [3]+cost[3,2],dist1 [4]+cost[4,2],dist1 [5]+cost[5,2]]]
Min = [6, 0 + 6, 5 + (-2), ∞ + ∞ , ∞ +∞] = 3
Dist2 [3]=min[dist1 [3],min[dist1 [1]+cost[1,3],dist1 [2]+cost[2,3],dist1 [4]+cost[4,3],dist1 [5]+cost[5,3]]]
Min = [5, 0 +∞, 6 +∞, ∞ + ∞ , ∞ + ∞] = 5
Dist2 [4]=min[dist1 [4],min[dist1 [1]+cost[1,4],dist1 [2]+cost[2,4],dist1 [3]+cost[3,4],dist1 [5]+cost[5,4]]]
Min = [∞, 0 +∞, 6 + (-1), 5 + 4, ∞ +∞] = 5
Dist2 [5]=min[dist1 [5],min[dist1 [1]+cost[1,5],dist1 [2]+cost[2,5],dist1 [3]+cost[3,5],dist1 [4]+cost[4,5]]]
Min = [∞, 0 + ∞,6 + ∞,5 + 3, ∞ + 3] = 8
Dist3 [2]=min[dist2 [2],min[dist2 [1]+cost[1,2],dist2 [3]+cost[3,2],dist2 [4]+cost[4,2],dist2 [5]+cost[5,2]]]
Min = [3, 0 + 6, 5 + (-2), 5 + ∞ , 8 + ∞ ] = 3
Dist3 [3]=min[dist2 [3],min[dist2 [1]+cost[1,3],dist2 [2]+cost[2,3],dist2 [4]+cost[4,3],dist2 [5]+cost[5,3]]]
Min = [5, 0 + ∞, 3 + ∞, 5 + ∞,8 + ∞ ] = 5
Dist3 [4]=min[dist2 [4],min[dist2 [1]+cost[1,4],dist2 [2]+cost[2,4],dist2 [3]+cost[3,4],dist2 [5]+cost[5,4]]]
Min = [5, 0 + ∞, 3 + (-1), 5 + 4, 8 + ∞ ] = 2
Dist3 [5]=min[dist2 [5],min[dist2 [1]+cost[1,5],dist2 [2]+cost[2,5],dist2 [3]+cost[3,5],dist2 [4]+cost[4,5]]]
Min = [8, 0 + ∞, 3 + ∞, 5 + 3, 5 + 3] = 8
Dist4 [2]=min[dist3 [2],min[dist3 [1]+cost[1,2],dist3 [3]+cost[3,2],dist3 [4]+cost[4,2],dist3 [5]+cost[5,2]]]
Min = [3, 0 + 6, 5 + (-2), 2 + ∞, 8 + ∞ ] =3
Dist4 [3]=min[dist3 [3],min[dist3 [1]+cost[1,3],dist3 [2]+cost[2,3],dist3 [4]+cost[4,3],dist3 [5]+cost[5,3]]]
Min = 5, 0 + ∞, 3 + ∞, 2 + ∞, 8 + ∞ ] =5
Dist4 [4]=min[dist3 [4],min[dist3 [1]+cost[1,4],dist3 [2]+cost[2,4],dist3 [3]+cost[3,4],dist3 [5]+cost[5,4]]]
Min = [2, 0 + ∞, 3 + (-1), 5 + 4, 8 + ∞ ] = 2
Dist4 [5]=min[dist3 [5],min[dist3 [1]+cost[1,5],dist3 [2]+cost[2,5],dist3 [3]+cost[3,5],dist3 [5]+cost[4,5]]]
Min = [8, 0 +∞, 3 + ∞, 8, 5] = 5
Minimum spanning tree
In the Greedy approach MST (Minimum Spanning Trees) is used to find the cost or the minimum path. Let G= (V, E) be an undirected connected graph, also T= (V’, E’) be a subgraph of the spanning tree G if and only if T is a tree.
Spanning trees are usually used to get an independent set of circuit’s equations in the electrical network. Once the spanning tree is obtained, suppose B is a set of edges not present in the spanning tree then adding one edge from B will form an electrical cycle.
A spanning tree is a minimal subgraph G’ of G such that V (G’) =V (G) and G’ is connected by a minimal subgraph. Any connected graph with n vertices must have at least n-1 edges and all connected graphs with n-1 edges are trees. The spanning trees of G will represent all feasible choices. The best spanning tree is tree with the minimum cost.
The cost of the spanning tree is nothing but the sum of the cost of the edges in that tree. Any tree consisting of edges of a graph and including all the vertices of the graph is known as a “Spanning Tree”.
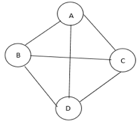
Fig 9: Graph with vertices
The above figure shows a graph with four vertices and some of its spanning tree are shown as below:
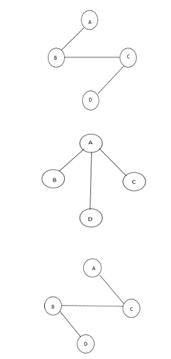
Fig 10: Spanning tree
Minimum Cost Spanning Tree
Definition: Let G= (V, E) be an undirected connected graph. A sub-graph t= (V, E’) of G is a spanning tree of G if t is a tree.
Spanning trees have many applications. It can be used to obtain an independent set of circuit equations for an electric network.
In Greedy approach a Minimum Cost Spanning Tree is created using the given graph G. Let us consider a connected weighted graph G our aim here is to create a spanning tree T for G such that the sum of the weights of the tree edges in T is as small as possible.
To do so the greedy approach is to draw the tree by selecting edge by edge. Initially the first edge is selected and then the next edge is selected by considering the lowest cost. The process selecting edges one by one goes on till all the vertices have been visited with the edges of the minimum cost.
There are two ways to do so: -
- Kruskal’s Algorithm: - Here edges of the graph are considered in non-decreasing order of cost. The set of T of edges so far selected for the spanning tree should be such that it is possible to complete T into a tree.
- Prim’s Algorithm: - Here the set of edges so far selected should from a tree. Now if A is the set of edges selected so far, then A has to form a tree. The next edge (u, v) to be included in A is a minimum cost edge not in A with the property that A ∪ {(u, v)} also results in a tree.
Key takeaways
- In the Greedy approach Minimum Spanning Trees is used to find the cost or the minimum path.
- Spanning trees have many applications. It can be used to obtain an independent set of circuit equations for an electric network.
- A spanning tree is a minimal subgraph G’ of G such that V (G’) =V (G) and G’ is connected by a minimal subgraph.
Application of BFS
The following are some of the most important BFS applications:
Un-weighted Graphs
The BFS technique can quickly generate the shortest path and a minimum spanning tree in order to visit all of the graph's vertices in the lowest amount of time while maintaining excellent accuracy.
P2P networks
In a peer-to-peer network, BFS can be used to locate all of the closest or nearby nodes. This will help you discover the information you need faster.
Web Crawlers
Using BFS, search engines or web crawlers may quickly create many tiers of indexes. The BFS implementation begins with the source, which is a web page, and then proceeds through all of the links on that page.
Networking broadcasting
The BFS algorithm guides a broadcast packet to find and reach all of the nodes for whom it has an address.
Application of DFS
The following are some of the most important DFS applications:
Weighted Graph
DFS graph traversal provides the shortest path tree and least spanning tree in a weighted graph.
Detecting a Cycle in a Graph
If we discovered a back edge during DFS, the graph exhibits a cycle. As a result, we should perform DFS on the graph and double-check the back edges.
Path Finding
We can specialize in finding a path between two vertices using the DFS algorithm.
Topological Sorting
It's mostly used to schedule jobs based on the interdependence between groups of jobs. It is utilized in instruction scheduling, data serialization, logic synthesis, and selecting the order of compilation processes in computer science.
Searching Strongly Connected Components of a Graph
When there is a path from each and every vertex in the graph to the remaining vertex, it is employed in a DFS graph.
Solving Puzzles with Only One Solution
By incorporating nodes on the existing path in the visited set, the DFS algorithm may easily be extended to find all solutions to a maze.
Hashing is implemented using one of two methods:
● Hashing with Chaining
● Hashing with open addressing
Hashing with chaining
The element in S is stored in Hash table T [0...m-1] of size m, where m is somewhat greater than n, the size of S, in Hashing with Chaining. There are m slots in the hash table. A hash function h is associated with the hashing technique, and it maps from U to {0...m-1}. We say that k is hashed into slot h since each key k ∈ S is kept in location T [h (k)] (k). A collision occurs when more than one key in S is hashed into the same slot.
All keys that hash into the same slot are placed in a linked list associated with that slot, which is referred to as the chain at slot. A hash table's load factor is defined as ∝=n/m, which represents the average amount of keys per slot. Because we frequently work in the m=θ(n) range, ∝ is usually a constant of ∝<1.
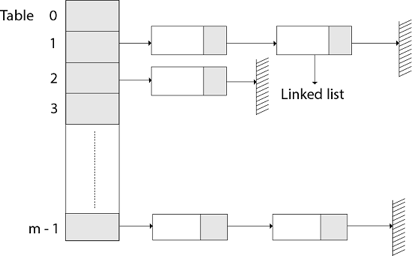
Fig 11: Hashing with chaining
Hashing with open address
All components in Open Addressing are kept in the hash table. That is, each table entry contains a dynamic set component or NIL. When looking for anything, we check table slots until we either find the item or establish that it isn't in the table. As a result, the load factor in open addressing can never exceed 1.
Open addressing has the advantage of avoiding Pointer. We compute the sequence of slots to be examined in this step. Because no pointers are shared, the hash table can have a larger number of slots for the same amount of memory, potentially resulting in fewer collisions and faster retrieval.
Probing is the process of inspecting a position in the hash table.
As a result, the hash function is transformed.
h : U x {0,1,....m-1} → {0,1,....,m-1}.
With open addressing, we need the probe sequence for every key k.
{h, (k, 0), h (k, 1)....h (k, m-1)}
Be a Permutation of (0, 1...... m-1)
A hash table T and a key k are passed to the HASH-INSERT method as inputs.
HASH-INSERT (T, k)
1. i ← 0
2. Repeat j ← h (k, i)
3. If T [j] = NIL
4. Then T [j] ← k
5. Return j
6. Else ← i= i +1
7. Until i=m
8. Error "hash table overflow"
The procedure HASH-SEARCH takes a hash table T and a key k as input and returns j if key k is found in slot j or NIL if key k is not found in table T.
HASH-SEARCH.T (k)
1. i ← 0
2. Repeat j ← h (k, i)
3. If T [j] =j
4. Then return j
5. i ← i+1
6. Until T [j] = NIL or i=m
7. Return NIL
Compilers construct and maintain symbol tables to record information about the presence of various entities such as variable names, function names, objects, classes, and interfaces, among other things. Both the analysis and synthesis components of a compiler use the symbol table.
Depending on the language, a symbol table may be used for the following purposes:
● To keep all of the names of all entities in one place in a systematic format.
● To determine whether or not a variable has been declared.
● Type checking is implemented by ensuring that assignments and expressions in source code are semantically accurate.
● to figure out what a name's scope is (scope resolution).
A symbol table is a simple table that can be linear or hash-based. It keeps track of each name using the following format:
<symbol name, type, attribute>
The compiler creates and maintains the Symbol Table in order to keep track of variable semantics, i.e. it keeps information about the scope and binding information about names, information about instances of various things such as variable and function names, classes, objects, and so on.
● It has lexical and syntax analysis steps built in.
● The information is collected by the compiler's analysis phases and used by the compiler's synthesis phases to build code.
● The compiler uses it to improve compile-time performance.
Symbol Table entries –
Each entry in the symbol table is linked to a set of properties that assist the compiler at various stages.
Items stored in Symbol table:
● Constants and variable names
● Names of procedures and functions.
● Strings and literal constants
● Temporaries were created by the compiler.
● Labels in the languages of origin.
Information used by the compiler from Symbol table:
● Data type and name
● Declaring procedures
● Offset in storage
● If structure or record then, a pointer to structure table.
● For parameters, whether parameter passing by value or by reference
● Number and type of arguments passed to function
● Base Address
Static data structure
The size of a static data structure is predetermined. The data structure's content can be changed without affecting the memory space allotted to it.

Fig 12: Example of static tree table
Dynamic data structure
The size of a dynamic data structure is not fixed and can be changed while operations are being performed on it. Dynamic data structures are intended to allow for data structure changes in real time.

Static Data Structure vs Dynamic Data Structure
The memory size of a static data structure is fixed, whereas the size of a dynamic data structure can be arbitrarily modified during runtime, making it more efficient in terms of memory complexity. In comparison to dynamic data structures, static data structures give easier access to elements. Dynamic data structures, unlike static data structures, are adaptable.
A hash table is a type of data structure that employs a particular function known as a hash function to map a given value to a key in order to retrieve elements more quickly.
A hash table is a data structure that stores information with two major components: key and value. With the help of an associative array, a hash table can be created. The effectiveness of the hash function used for mapping is determined by the efficiency of the hash function used for mapping.
A hash table is a data structure that stores data in a way that is associative. Data is stored in an array format in a hash table, with each data value having its own unique index value. If we know the index of the needed data, data access becomes very quick.
As a result, it becomes a data structure in which insertion and search operations are extremely quick, regardless of data size. Hash Tables store data in an array and utilize the hash technique to generate an index from which an element can be inserted or located.
For example, if the key value is John and the value is the phone number, we may use the following hash function to pass the key value:
Hash(key)= index;
The index is returned when the key is passed to the hash function.
Hash(john) = 3;
The john is added to the index 3 in the example above.
Hashing
Hashing is a method of converting a set of key values into a set of array indexes. To get a range of key values, we'll utilise the modulo operator. Consider an example of hash table of size 20, and the following items are to be stored. Item are in the (key,value) format.

● (1,20)
● (2,70)
● (42,80)
● (4,25)
● (12,44)
● (14,32)
● (17,11)
● (13,78)
● (37,98)
Sr.No. | Key | Hash | Array Index |
1 | 1 | 1 % 20 = 1 | 1 |
2 | 2 | 2 % 20 = 2 | 2 |
3 | 42 | 42 % 20 = 2 | 2 |
4 | 4 | 4 % 20 = 4 | 4 |
5 | 12 | 12 % 20 = 12 | 12 |
6 | 14 | 14 % 20 = 14 | 14 |
7 | 17 | 17 % 20 = 17 | 17 |
8 | 13 | 13 % 20 = 13 | 13 |
9 | 37 | 37 % 20 = 17 | 17 |
The Hash Function is used to index the original value or key, and it is then utilized to obtain the data associated with the value or key. As a result, hashing is always a one-way process. By studying the hashed values, there is no need to "reverse engineer" the hash algorithm.
Characteristics of Good Hash Function:
● The data being hashed completely determines the hash value.
● All of the input data is used by the hash function.
● The hash function distributes the data "uniformly" across all potential hash values.
● For comparable strings, the hash function gives complicated hash values.
Some hash function
Division method
Select a number m that is less than the number of n keys in k. (The number m is usually chosen to be a prime number or a number without small divisors, since this frequently has a minimum number of collisions).
The hash function is as follows:
h (k) = k mod m h (k) = k mod m + 1
Example - If m = 12 is the size of the hash table and k = 100 is the key, then h (k) = 4. Hashing via division is quick since it just requires one division operation.
Multiplication method
There are two phases to producing hash functions using the multiplication approach. First, we extract the fractional component of kA by multiplying the key k by a constant A in the range 0 A 1. Then we multiply this value by m and take the result's floor.
The hash function is as follows:
h (k) = m(k A mod 1
The fractional component of k A, k A -k A, is denoted by "k A mod 1."
Mid square method
The letter k has been squared. The function H is therefore defined as follows:
H (k) = L
L is found by subtracting digits from both ends of k2. We underline that k2 must be used in the same place for all keys.
Folding method
The key k is divided into a number of components k1, k2,... Kn, each with the same amount of digits as the needed address except maybe the last.
The pieces are then combined together, with the last carry ignored.
H (k) = k1+ k2+.....+kn
Key takeaway
The Hash Function is used to index the original value or key, and it is then utilized to obtain the data associated with the value or key.
As a result, hashing is always a one-way process.
● The hash function is utilized to find the array's index in this case.
● The hash value is used as an index in the hash table to hold the key.
● For two or more keys, the hash function can return the same hash value.
● A collision occurs when two or more keys are given the same hash value. Collision resolution strategies are used to deal with this collision.
Collision resolution techniques
Collision resolution strategies are divided into two categories.
● Separate chaining (open hashing)
● Open addressing (closed hashing)
Separate chaining
This strategy involves creating a linked list from the slot where the collision occurred, then inserting the new key into the linked list. Separate chaining refers to the linked list of slots that resembles a chain. When we don't know how many keys to insert or remove, we use it more.
Time complexity
● Its worst-case searching complexity is o (n).
● Its worst-case deletion complexity is o (n).
Advantages of separate chaining
● It is simple to put into practice.
● We can add more elements to the chain because the hash table never fills up.
● It is less sensitive to the hashing function.
Disadvantages of separate chaining
● Chaining cache performance is poor in this case.
● In this strategy, there is far too much memory waste.
● It necessitates a larger amount of space for element linkages.
Open addressing
Open addressing is a collision-resolution technique for preventing collisions in hashing tables. Outside of the hash table, no key is stored. As a result, the hash table's size is always more than or equal to the number of keys. Closed hashing is another name for it.
In open addressing, the following strategies are used:
● Linear probing
● Quadratic probing
● Double hashing
Key takeaway
The hash function is utilized to find the array's index in this case.
The hash value is used as an index in the hash table to hold the key.
For two or more keys, the hash function can return the same hash value.
The size of a static data structure is predetermined. The data structure's content can be changed without affecting the memory space allotted to it. When the home bucket for a new pair (key, element) is full, an overflow occurs.
We might be able to deal with overflows by
Look through the hash table in a systematic manner for an empty bucket.
● Linear probing (linear open addressing).
● Quadratic probing.
● Random probing.
Allow each bucket to preserve a list of all pairings for which it is the home bucket to avoid overflows.
● Array linear list.
● Chain.
Open addressing is used to ensure that all elements are placed directly in the hash table, and it uses a variety of approaches to resolve collisions.
To resolve collisions, Linear Probing is used to place the data into the next available space in the table.
Performance of Linear Probing
● The worst-case time for find/insert/erase is (m), where m is the number of pairings in the table.
● When all pairings are in the same cluster, this happens.
Problem of Linear Probing
● Identifiers have a tendency to group together.
● Adjacent clusters are forming a ring.
● Increase or improve the time spent searching.
Random Probing
Random Probing performs incorporating with random numbers.
H(x):= (H’(x) + S[i]) % b
S[i] is a table along with size b-1
S[i] is indicated as a random permutation of integers [1, b-1].
References:
- Data Structures and program design in C by Robert Kruse, Bruce Leung & Clovis Tondo.
- Data Structures: A Pseudocode Approach with C by Richard F. Gilberg and
Behrouz Forouzan.
3. Data Structures using C by Tanenbaum, Pearson Education
4. Data structures and Algorithm Analysis in C, 2nd edition, M.A.Weiss, Pearson
Unit - 4
Graphs
A graph can be defined as group of vertices and edges that are used to connect these vertices. A graph can be seen as a cyclic tree, where the vertices (Nodes) maintain any complex relationship among them instead of having parent child relationship.
Definition
A graph G can be defined as an ordered set G (V, E) where V(G) represents the set of vertices and E(G) represents the set of edges which are used to connect these vertices.
A Graph G (V, E) with 5 vertices (A, B, C, D, E) and six edges ((A, B), (B, C), (C, E), (E, D), (D, B), (D, A)) is shown in the following figure.
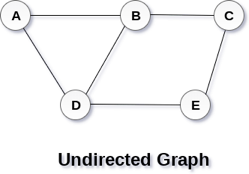
Fig 1– Undirected graph
Directed and Undirected Graph
A graph can be directed or undirected. However, in an undirected graph, edges are not associated with the directions with them. An undirected graph is shown in the above figure since its edges are not attached with any of the directions. If an edge exists between vertex A and B then the vertices can be traversed from B to A as well as A to B.
In a directed graph, edges form an ordered pair. Edges represent a specific path from some vertex A to another vertex B. Node A is called the initial node while node B is called terminal node.
A directed graph is shown in the following figure.
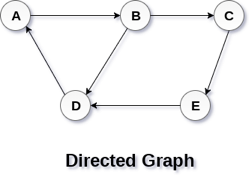
Fig 2– Directed graph
Graph Terminology
Path
A path can be defined as the sequence of nodes that are followed in order to reach some terminal node V from the initial node U.
Closed Path
A path will be called as closed path if the initial node is same as terminal node. A path will be closed path if V0=VN.
Simple Path
If all the nodes of the graph are distinct with an exception V0=VN, then such path P is called as closed simple path.
Cycle
A cycle can be defined as the path which has no repeated edges or vertices except the first and last vertices.
Connected Graph
A connected graph is the one in which some path exists between every two vertices (u, v) in V. There are no isolated nodes in connected graph.
Complete Graph
A complete graph is the one in which every node is connected with all other nodes. A complete graph contain n(n-1)/2 edges where n is the number of nodes in the graph.
Weighted Graph
In a weighted graph, each edge is assigned with some data such as length or weight. The weight of an edge e can be given as w(e) which must be a positive (+) value indicating the cost of traversing the edge.
Digraph
A digraph is a directed graph in which each edge of the graph is associated with some direction and the traversing can be done only in the specified direction.
Loop
An edge that is associated with the similar end points can be called as Loop.
Adjacent Nodes
If two nodes u and v are connected via an edge e, then the nodes u and v are called as neighbours or adjacent nodes.
Degree of the Node
A degree of a node is the number of edges that are connected with that node. A node with degree 0 is called as isolated node.
Key takeaway
- A graph can be defined as group of vertices and edges that are used to connect these vertices.
- A graph can be seen as a cyclic tree, where the vertices (Nodes) maintain any complex relationship among them instead of having parent child relationship.
Graph traversal is a method for finding a vertex in a graph. It's also utilised to determine the order in which vertices should be visited during the search.
Without producing loops, a graph traversal finds the edges to be employed in the search process. This means that using graph traversal, we can visit all of the graph's vertices without being stuck in a loop. There are two methods for traversing a graph:
● DFS (Depth First Search)
● BFS (Breadth-First Search)
Depth First Search
Depth First Search is an algorithm for traversing or searching a graph.
It starts from some node as the root node and explores each and every branch of that node before backtracking to the parent node.
DFS is an uninformed search that progresses by expanding the first child node of the graph that appears and thus going deeper and deeper until a goal node is found, or until it hits a node that has no children.
Then the search backtracks, returning to the most recent node it hadn't finished exploring. In a non-recursive implementation, all freshly expanded nodes are added to a LIFO stack for expansion.
Steps for implementing Depth first search
Step 1: - Define an array A or Vertex that store Boolean values, its size should be greater or equal to the number of vertices in the graph G.
Step 2: - Initialize the array A to false
Step 3: - For all vertices v in G
If A[v] = false
Process (v)
Step 4: - Exit
Algorithm for DFS
DFS(G)
{
for each v in V, //for loop V+1 times
{
Color[v]=white; // V times
p[v]=NULL; // V times
}
time=0; // constant time O (1)
for each u in V, //for loop V+1 times
if (color[u]==white) // V times
DFSVISIT(u) // call to DFSVISIT(v), at most V times O(V)
}
DFSVISIT(u)
{
color[u]=gray; // constant time
t[u] = ++time;
for each v in Adj(u) // for loop
if (color[v] == white)
{
p[v] = u;
DFSVISIT(v); // call to DFSVISIT(v)
}
color[u] = black; // constant time
f[u]=++time; // constant time
}
DFS algorithm used to solve following problems:
● Testing whether graph is connected.
● Computing a spanning forest of graph.
● Computing a path between two vertices of graph or equivalently reporting that no such path exists.
● Computing a cycle in graph or equivalently reporting that no such cycle exists.
Analysis of DFS
In the above algorithm, there is only one DFSVISIT(u) call for each vertex u in the vertex set V. Initialization complexity in DFS(G) for loop is O(V). In second for loop of DFS(G), complexity is O(V) if we leave the call of DFSVISIT(u).
Now, let us find the complexity of function DFSVISIT(u)
The complexity of for loop will be O(deg(u)+1) if we do not consider the recursive call to DFSVISIT(v). For recursive call to DFSVISIT(v), (complexity will be O(E) as
Recursive call to DFSVISIT(v) will be at most the sum of degree of adjacency for all vertex v in the vertex set V. It can be written as ∑ |Adj(v)|=O(E) vεV
The running time of DSF is (V + E).
Breadth First Search
It is an uninformed search methodology which first expand and examine all nodes of graph systematically in search of the solution in the sequence and then go at the deeper level. In other words, it exhaustively searches the entire graph without considering the goal until it finds it.
From the standpoint of the algorithm, all child nodes obtained by expanding a node are added to a FIFO queue. In typical implementations, nodes that have not yet been examined for their neighbors are placed in some container (such as a queue or linked list) called "open" and then once examined are placed in the container "closed".
Steps for implementing Breadth first search
Step 1: - Initialize all the vertices by setting Flag = 1
Step 2: - Put the starting vertex A in Q and change its status to the waiting state by setting Flag = 0
Step 3: - Repeat through step 5 while Q is not NULL
Step 4: - Remove the front vertex v of Q. Process v and set the status of v to the processed status by setting Flag = -1
Step 5: - Add to the rear of Q all the neighbour of v that are in the ready state by setting Flag = 1 and change their status to the waiting state by setting flag = 0
Step 6: - Exit
Algorithm for BFS
BFS (G, s)
{
for each v in V - {s} // for loop {
color[v]=white;
d[v]= INFINITY;
p[v]=NULL;
}
color[s] = gray;
d[s]=0;
p[s]=NULL;
Q = ø; // Initialize queue is empty
Enqueue(Q, s); /* Insert start vertex s in Queue Q */
while Q is nonempty // while loop
{
u = Dequeue[Q]; /* Remove an element from Queue Q*/
for each v in Adj[u] // for loop
{ if (color[v] == white) /*if v is unvisted*/
{
color[v] = gray; /* v is visted */
d[v] = d[u] + 1; /*Set distance of v to no. Of edges from s to u*/
p[v] = u; /*Set parent of v*/
Enqueue(Q,v); /*Insert v in Queue Q*/
}
}
color[u] = black; /*finally visted or explored vertex u*/
}
}
Breadth First Search algorithm used in
● Prim's MST algorithm.
● Dijkstra's single source shortest path algorithm.
● Testing whether graph is connected.
● Computing a cycle in graph or reporting that no such cycle exists.
Analysis of BFS
In this algorithm first for loop executes at most O(V) times.
While loop executes at most O(V) times as every vertex v in V is enqueued only once in the Queue Q. Every vertex is enqueued once and dequeued once so queuing will take at most O(V) time.
Inside while loop, there is for loop which will execute at most O(E) times as it will be at most the sum of degree of adjacency for all vertex v in the vertex set V.
Which can be written as
∑ |Adj(v)|=O(E)
vεV
Total running time of BFS is O(V + E).
Like depth first search, BFS traverse a connected component of a given graph and defines a spanning tree.
Space complexity of DFS is much lower than BFS (breadth-first search). It also lends itself much better to heuristic methods of choosing a likely-looking branch. Time complexity of both algorithms are proportional to the number of vertices plus the number of edges in the graphs they traverse.
Key takeaways
- Depth First Search is an algorithm for traversing or searching a graph.
- DFS is an uninformed search that progresses by expanding the first child node of the graph that appears and thus going deeper and deeper until a goal node is found, or until it hits a node that has no children.
- BFS is an uninformed search methodology which first expand and examine all nodes of graph systematically in search of the solution in the sequence and then goes to the deeper level.
- In other words, it exhaustively searches the entire graph without considering the goal until it finds it.
Graph Representation
By Graph representation, we simply mean the technique which is to be used in order to store some graph into the computer's memory.
There are two ways to store Graph into the computer's memory.
1. Sequential Representation
In sequential representation, we use an adjacency matrix to store the mapping represented by vertices and edges. In adjacency matrix, the rows and columns are represented by the graph vertices. A graph having n vertices, will have a dimension n x n.
An entry Mij in the adjacency matrix representation of an undirected graph G will be 1 if there exists an edge between Vi and Vj.
An undirected graph and its adjacency matrix representation is shown in the following figure.
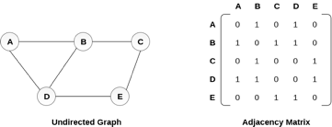
Fig 3– Undirected graph and its adjacency matrix
In the above figure, we can see the mapping among the vertices (A, B, C, D, E) is represented by using the adjacency matrix which is also shown in the figure.
There exists different adjacency matrices for the directed and undirected graph. In directed graph, an entry Aij will be 1 only when there is an edge directed from Vi to Vj.
A directed graph and its adjacency matrix representation is shown in the following figure.
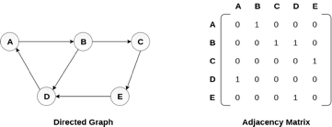
Fig 4- Directed graph and its adjacency matrix
Representation of weighted directed graph is different. Instead of filling the entry by 1, the Non- zero entries of the adjacency matrix are represented by the weight of respective edges.
The weighted directed graph along with the adjacency matrix representation is shown in the following figure.
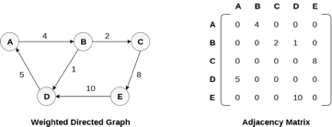
Fig 5 - Weighted directed graph
Adjacency list
Linked Representation
In the linked representation, an adjacency list is used to store the Graph into the computer's memory.
Consider the undirected graph shown in the following figure and check the adjacency list representation.

Fig 6- Undirected graph in adjacency list
An adjacency list is maintained for each node present in the graph which stores the node value and a pointer to the next adjacent node to the respective node. If all the adjacent nodes are traversed then store the NULL in the pointer field of the last node of the list. The sum of the lengths of adjacency lists is equal to twice of the number of edges present in an undirected graph.
Consider the directed graph shown in the following figure and check the adjacency list representation of the graph.
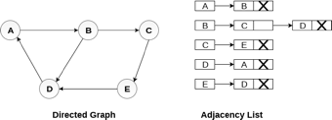
Fig 7- Directed graph in adjacency list
In a directed graph, the sum of lengths of all the adjacency lists is equal to the number of edges present in the graph.
In the case of weighted directed graph, each node contains an extra field that is called the weight of the node. The adjacency list representation of a directed graph is shown in the following figure.

Fig 8- Weighted directed graph
Key takeaway
- By Graph representation, we simply mean the technique which is to be used in order to store some graph into the computer's memory.
- There are two ways to store Graph into the computer's memory.
- In the linked representation, an adjacency list is used to store the Graph into the computer's memory.
- An adjacency list is maintained for each node present in the graph which stores the node value and a pointer to the next adjacent node to the respective node.
Bellman-Ford Algorithm shortest path
Solves single shortest path problem in which edge weight may be negative but no negative cycle exists.
This algorithm works correctly when some of the edges of the directed graph G may have negative weight. When there are no cycles of negative weight, then we can find out the shortest path between source and destination.
It is slower than Dijkstra's Algorithm but more versatile, as it capable of handling some of the negative weight edges.
This algorithm detects the negative cycle in a graph and reports their existence.
Based on the "Principle of Relaxation" in which more accurate values gradually recovered an approximation to the proper distance by until eventually reaching the optimum solution.
Given a weighted directed graph G = (V, E) with source s and weight function w: E → R, the Bellman-Ford algorithm returns a Boolean value indicating whether or not there is a negative weight cycle that is attainable from the source. If there is such a cycle, the algorithm produces the shortest paths and their weights. The algorithm returns TRUE if and only if a graph contains no negative - weight cycles that are reachable from the source.
Recurrence Relation
Distk [u] = [min[distk-1 [u],min[ distk-1 [i]+cost [i,u]]] as i except u.
k → k is the source vertex
u → u is the destination vertex
i → no of edges to be scanned concerning a vertex.
BELLMAN -FORD (G, w, s)
1. INITIALIZE - SINGLE - SOURCE (G, s)
2. For i ← 1 to |V[G]| - 1
3. Do for each edge (u, v) ∈ E [G]
4. Do RELAX (u, v, w)
5. For each edge (u, v) ∈ E [G]
6. Do if d [v] > d [u] + w (u, v)
7. Then return FALSE.
8. Return TRUE.
Example: Here first we list all the edges and their weights.
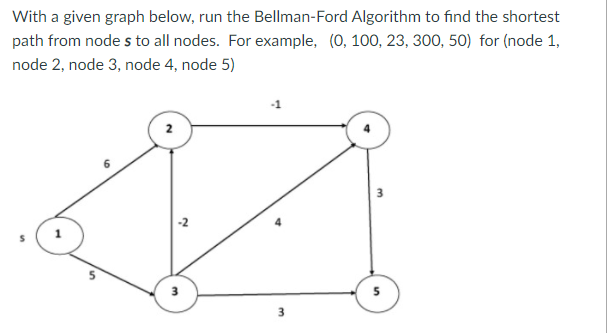
Solution:
Distk [u] = [min[distk-1 [u],min[distk-1 [i]+cost [i,u]]] as i ≠ u.
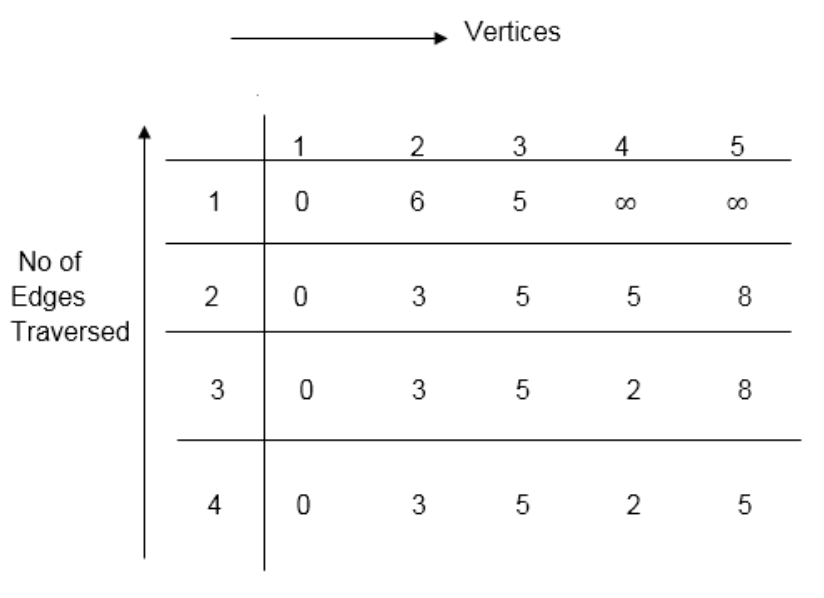
Dist2 [2]=min[dist1 [2],min[dist1 [1]+cost[1,2],dist1 [3]+cost[3,2],dist1 [4]+cost[4,2],dist1 [5]+cost[5,2]]]
Min = [6, 0 + 6, 5 + (-2), ∞ + ∞ , ∞ +∞] = 3
Dist2 [3]=min[dist1 [3],min[dist1 [1]+cost[1,3],dist1 [2]+cost[2,3],dist1 [4]+cost[4,3],dist1 [5]+cost[5,3]]]
Min = [5, 0 +∞, 6 +∞, ∞ + ∞ , ∞ + ∞] = 5
Dist2 [4]=min[dist1 [4],min[dist1 [1]+cost[1,4],dist1 [2]+cost[2,4],dist1 [3]+cost[3,4],dist1 [5]+cost[5,4]]]
Min = [∞, 0 +∞, 6 + (-1), 5 + 4, ∞ +∞] = 5
Dist2 [5]=min[dist1 [5],min[dist1 [1]+cost[1,5],dist1 [2]+cost[2,5],dist1 [3]+cost[3,5],dist1 [4]+cost[4,5]]]
Min = [∞, 0 + ∞,6 + ∞,5 + 3, ∞ + 3] = 8
Dist3 [2]=min[dist2 [2],min[dist2 [1]+cost[1,2],dist2 [3]+cost[3,2],dist2 [4]+cost[4,2],dist2 [5]+cost[5,2]]]
Min = [3, 0 + 6, 5 + (-2), 5 + ∞ , 8 + ∞ ] = 3
Dist3 [3]=min[dist2 [3],min[dist2 [1]+cost[1,3],dist2 [2]+cost[2,3],dist2 [4]+cost[4,3],dist2 [5]+cost[5,3]]]
Min = [5, 0 + ∞, 3 + ∞, 5 + ∞,8 + ∞ ] = 5
Dist3 [4]=min[dist2 [4],min[dist2 [1]+cost[1,4],dist2 [2]+cost[2,4],dist2 [3]+cost[3,4],dist2 [5]+cost[5,4]]]
Min = [5, 0 + ∞, 3 + (-1), 5 + 4, 8 + ∞ ] = 2
Dist3 [5]=min[dist2 [5],min[dist2 [1]+cost[1,5],dist2 [2]+cost[2,5],dist2 [3]+cost[3,5],dist2 [4]+cost[4,5]]]
Min = [8, 0 + ∞, 3 + ∞, 5 + 3, 5 + 3] = 8
Dist4 [2]=min[dist3 [2],min[dist3 [1]+cost[1,2],dist3 [3]+cost[3,2],dist3 [4]+cost[4,2],dist3 [5]+cost[5,2]]]
Min = [3, 0 + 6, 5 + (-2), 2 + ∞, 8 + ∞ ] =3
Dist4 [3]=min[dist3 [3],min[dist3 [1]+cost[1,3],dist3 [2]+cost[2,3],dist3 [4]+cost[4,3],dist3 [5]+cost[5,3]]]
Min = 5, 0 + ∞, 3 + ∞, 2 + ∞, 8 + ∞ ] =5
Dist4 [4]=min[dist3 [4],min[dist3 [1]+cost[1,4],dist3 [2]+cost[2,4],dist3 [3]+cost[3,4],dist3 [5]+cost[5,4]]]
Min = [2, 0 + ∞, 3 + (-1), 5 + 4, 8 + ∞ ] = 2
Dist4 [5]=min[dist3 [5],min[dist3 [1]+cost[1,5],dist3 [2]+cost[2,5],dist3 [3]+cost[3,5],dist3 [5]+cost[4,5]]]
Min = [8, 0 +∞, 3 + ∞, 8, 5] = 5
Minimum spanning tree
In the Greedy approach MST (Minimum Spanning Trees) is used to find the cost or the minimum path. Let G= (V, E) be an undirected connected graph, also T= (V’, E’) be a subgraph of the spanning tree G if and only if T is a tree.
Spanning trees are usually used to get an independent set of circuit’s equations in the electrical network. Once the spanning tree is obtained, suppose B is a set of edges not present in the spanning tree then adding one edge from B will form an electrical cycle.
A spanning tree is a minimal subgraph G’ of G such that V (G’) =V (G) and G’ is connected by a minimal subgraph. Any connected graph with n vertices must have at least n-1 edges and all connected graphs with n-1 edges are trees. The spanning trees of G will represent all feasible choices. The best spanning tree is tree with the minimum cost.
The cost of the spanning tree is nothing but the sum of the cost of the edges in that tree. Any tree consisting of edges of a graph and including all the vertices of the graph is known as a “Spanning Tree”.
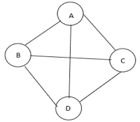
Fig 9: Graph with vertices
The above figure shows a graph with four vertices and some of its spanning tree are shown as below:
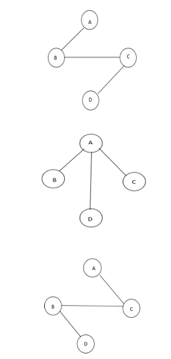
Fig 10: Spanning tree
Minimum Cost Spanning Tree
Definition: Let G= (V, E) be an undirected connected graph. A sub-graph t= (V, E’) of G is a spanning tree of G if t is a tree.
Spanning trees have many applications. It can be used to obtain an independent set of circuit equations for an electric network.
In Greedy approach a Minimum Cost Spanning Tree is created using the given graph G. Let us consider a connected weighted graph G our aim here is to create a spanning tree T for G such that the sum of the weights of the tree edges in T is as small as possible.
To do so the greedy approach is to draw the tree by selecting edge by edge. Initially the first edge is selected and then the next edge is selected by considering the lowest cost. The process selecting edges one by one goes on till all the vertices have been visited with the edges of the minimum cost.
There are two ways to do so: -
- Kruskal’s Algorithm: - Here edges of the graph are considered in non-decreasing order of cost. The set of T of edges so far selected for the spanning tree should be such that it is possible to complete T into a tree.
- Prim’s Algorithm: - Here the set of edges so far selected should from a tree. Now if A is the set of edges selected so far, then A has to form a tree. The next edge (u, v) to be included in A is a minimum cost edge not in A with the property that A ∪ {(u, v)} also results in a tree.
Key takeaways
- In the Greedy approach Minimum Spanning Trees is used to find the cost or the minimum path.
- Spanning trees have many applications. It can be used to obtain an independent set of circuit equations for an electric network.
- A spanning tree is a minimal subgraph G’ of G such that V (G’) =V (G) and G’ is connected by a minimal subgraph.
Application of BFS
The following are some of the most important BFS applications:
Un-weighted Graphs
The BFS technique can quickly generate the shortest path and a minimum spanning tree in order to visit all of the graph's vertices in the lowest amount of time while maintaining excellent accuracy.
P2P networks
In a peer-to-peer network, BFS can be used to locate all of the closest or nearby nodes. This will help you discover the information you need faster.
Web Crawlers
Using BFS, search engines or web crawlers may quickly create many tiers of indexes. The BFS implementation begins with the source, which is a web page, and then proceeds through all of the links on that page.
Networking broadcasting
The BFS algorithm guides a broadcast packet to find and reach all of the nodes for whom it has an address.
Application of DFS
The following are some of the most important DFS applications:
Weighted Graph
DFS graph traversal provides the shortest path tree and least spanning tree in a weighted graph.
Detecting a Cycle in a Graph
If we discovered a back edge during DFS, the graph exhibits a cycle. As a result, we should perform DFS on the graph and double-check the back edges.
Path Finding
We can specialize in finding a path between two vertices using the DFS algorithm.
Topological Sorting
It's mostly used to schedule jobs based on the interdependence between groups of jobs. It is utilized in instruction scheduling, data serialization, logic synthesis, and selecting the order of compilation processes in computer science.
Searching Strongly Connected Components of a Graph
When there is a path from each and every vertex in the graph to the remaining vertex, it is employed in a DFS graph.
Solving Puzzles with Only One Solution
By incorporating nodes on the existing path in the visited set, the DFS algorithm may easily be extended to find all solutions to a maze.
Hashing is implemented using one of two methods:
● Hashing with Chaining
● Hashing with open addressing
Hashing with chaining
The element in S is stored in Hash table T [0...m-1] of size m, where m is somewhat greater than n, the size of S, in Hashing with Chaining. There are m slots in the hash table. A hash function h is associated with the hashing technique, and it maps from U to {0...m-1}. We say that k is hashed into slot h since each key k ∈ S is kept in location T [h (k)] (k). A collision occurs when more than one key in S is hashed into the same slot.
All keys that hash into the same slot are placed in a linked list associated with that slot, which is referred to as the chain at slot. A hash table's load factor is defined as ∝=n/m, which represents the average amount of keys per slot. Because we frequently work in the m=θ(n) range, ∝ is usually a constant of ∝<1.
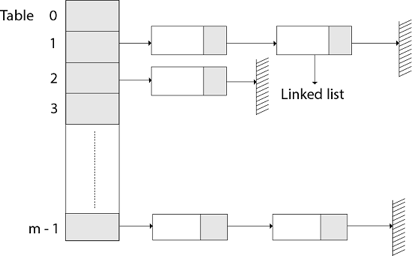
Fig 11: Hashing with chaining
Hashing with open address
All components in Open Addressing are kept in the hash table. That is, each table entry contains a dynamic set component or NIL. When looking for anything, we check table slots until we either find the item or establish that it isn't in the table. As a result, the load factor in open addressing can never exceed 1.
Open addressing has the advantage of avoiding Pointer. We compute the sequence of slots to be examined in this step. Because no pointers are shared, the hash table can have a larger number of slots for the same amount of memory, potentially resulting in fewer collisions and faster retrieval.
Probing is the process of inspecting a position in the hash table.
As a result, the hash function is transformed.
h : U x {0,1,....m-1} → {0,1,....,m-1}.
With open addressing, we need the probe sequence for every key k.
{h, (k, 0), h (k, 1)....h (k, m-1)}
Be a Permutation of (0, 1...... m-1)
A hash table T and a key k are passed to the HASH-INSERT method as inputs.
HASH-INSERT (T, k)
1. i ← 0
2. Repeat j ← h (k, i)
3. If T [j] = NIL
4. Then T [j] ← k
5. Return j
6. Else ← i= i +1
7. Until i=m
8. Error "hash table overflow"
The procedure HASH-SEARCH takes a hash table T and a key k as input and returns j if key k is found in slot j or NIL if key k is not found in table T.
HASH-SEARCH.T (k)
1. i ← 0
2. Repeat j ← h (k, i)
3. If T [j] =j
4. Then return j
5. i ← i+1
6. Until T [j] = NIL or i=m
7. Return NIL
Compilers construct and maintain symbol tables to record information about the presence of various entities such as variable names, function names, objects, classes, and interfaces, among other things. Both the analysis and synthesis components of a compiler use the symbol table.
Depending on the language, a symbol table may be used for the following purposes:
● To keep all of the names of all entities in one place in a systematic format.
● To determine whether or not a variable has been declared.
● Type checking is implemented by ensuring that assignments and expressions in source code are semantically accurate.
● to figure out what a name's scope is (scope resolution).
A symbol table is a simple table that can be linear or hash-based. It keeps track of each name using the following format:
<symbol name, type, attribute>
The compiler creates and maintains the Symbol Table in order to keep track of variable semantics, i.e. it keeps information about the scope and binding information about names, information about instances of various things such as variable and function names, classes, objects, and so on.
● It has lexical and syntax analysis steps built in.
● The information is collected by the compiler's analysis phases and used by the compiler's synthesis phases to build code.
● The compiler uses it to improve compile-time performance.
Symbol Table entries –
Each entry in the symbol table is linked to a set of properties that assist the compiler at various stages.
Items stored in Symbol table:
● Constants and variable names
● Names of procedures and functions.
● Strings and literal constants
● Temporaries were created by the compiler.
● Labels in the languages of origin.
Information used by the compiler from Symbol table:
● Data type and name
● Declaring procedures
● Offset in storage
● If structure or record then, a pointer to structure table.
● For parameters, whether parameter passing by value or by reference
● Number and type of arguments passed to function
● Base Address
Static data structure
The size of a static data structure is predetermined. The data structure's content can be changed without affecting the memory space allotted to it.

Fig 12: Example of static tree table
Dynamic data structure
The size of a dynamic data structure is not fixed and can be changed while operations are being performed on it. Dynamic data structures are intended to allow for data structure changes in real time.

Static Data Structure vs Dynamic Data Structure
The memory size of a static data structure is fixed, whereas the size of a dynamic data structure can be arbitrarily modified during runtime, making it more efficient in terms of memory complexity. In comparison to dynamic data structures, static data structures give easier access to elements. Dynamic data structures, unlike static data structures, are adaptable.
A hash table is a type of data structure that employs a particular function known as a hash function to map a given value to a key in order to retrieve elements more quickly.
A hash table is a data structure that stores information with two major components: key and value. With the help of an associative array, a hash table can be created. The effectiveness of the hash function used for mapping is determined by the efficiency of the hash function used for mapping.
A hash table is a data structure that stores data in a way that is associative. Data is stored in an array format in a hash table, with each data value having its own unique index value. If we know the index of the needed data, data access becomes very quick.
As a result, it becomes a data structure in which insertion and search operations are extremely quick, regardless of data size. Hash Tables store data in an array and utilize the hash technique to generate an index from which an element can be inserted or located.
For example, if the key value is John and the value is the phone number, we may use the following hash function to pass the key value:
Hash(key)= index;
The index is returned when the key is passed to the hash function.
Hash(john) = 3;
The john is added to the index 3 in the example above.
Hashing
Hashing is a method of converting a set of key values into a set of array indexes. To get a range of key values, we'll utilise the modulo operator. Consider an example of hash table of size 20, and the following items are to be stored. Item are in the (key,value) format.

● (1,20)
● (2,70)
● (42,80)
● (4,25)
● (12,44)
● (14,32)
● (17,11)
● (13,78)
● (37,98)
Sr.No. | Key | Hash | Array Index |
1 | 1 | 1 % 20 = 1 | 1 |
2 | 2 | 2 % 20 = 2 | 2 |
3 | 42 | 42 % 20 = 2 | 2 |
4 | 4 | 4 % 20 = 4 | 4 |
5 | 12 | 12 % 20 = 12 | 12 |
6 | 14 | 14 % 20 = 14 | 14 |
7 | 17 | 17 % 20 = 17 | 17 |
8 | 13 | 13 % 20 = 13 | 13 |
9 | 37 | 37 % 20 = 17 | 17 |
The Hash Function is used to index the original value or key, and it is then utilized to obtain the data associated with the value or key. As a result, hashing is always a one-way process. By studying the hashed values, there is no need to "reverse engineer" the hash algorithm.
Characteristics of Good Hash Function:
● The data being hashed completely determines the hash value.
● All of the input data is used by the hash function.
● The hash function distributes the data "uniformly" across all potential hash values.
● For comparable strings, the hash function gives complicated hash values.
Some hash function
Division method
Select a number m that is less than the number of n keys in k. (The number m is usually chosen to be a prime number or a number without small divisors, since this frequently has a minimum number of collisions).
The hash function is as follows:
h (k) = k mod m h (k) = k mod m + 1
Example - If m = 12 is the size of the hash table and k = 100 is the key, then h (k) = 4. Hashing via division is quick since it just requires one division operation.
Multiplication method
There are two phases to producing hash functions using the multiplication approach. First, we extract the fractional component of kA by multiplying the key k by a constant A in the range 0 A 1. Then we multiply this value by m and take the result's floor.
The hash function is as follows:
h (k) = m(k A mod 1
The fractional component of k A, k A -k A, is denoted by "k A mod 1."
Mid square method
The letter k has been squared. The function H is therefore defined as follows:
H (k) = L
L is found by subtracting digits from both ends of k2. We underline that k2 must be used in the same place for all keys.
Folding method
The key k is divided into a number of components k1, k2,... Kn, each with the same amount of digits as the needed address except maybe the last.
The pieces are then combined together, with the last carry ignored.
H (k) = k1+ k2+.....+kn
Key takeaway
The Hash Function is used to index the original value or key, and it is then utilized to obtain the data associated with the value or key.
As a result, hashing is always a one-way process.
● The hash function is utilized to find the array's index in this case.
● The hash value is used as an index in the hash table to hold the key.
● For two or more keys, the hash function can return the same hash value.
● A collision occurs when two or more keys are given the same hash value. Collision resolution strategies are used to deal with this collision.
Collision resolution techniques
Collision resolution strategies are divided into two categories.
● Separate chaining (open hashing)
● Open addressing (closed hashing)
Separate chaining
This strategy involves creating a linked list from the slot where the collision occurred, then inserting the new key into the linked list. Separate chaining refers to the linked list of slots that resembles a chain. When we don't know how many keys to insert or remove, we use it more.
Time complexity
● Its worst-case searching complexity is o (n).
● Its worst-case deletion complexity is o (n).
Advantages of separate chaining
● It is simple to put into practice.
● We can add more elements to the chain because the hash table never fills up.
● It is less sensitive to the hashing function.
Disadvantages of separate chaining
● Chaining cache performance is poor in this case.
● In this strategy, there is far too much memory waste.
● It necessitates a larger amount of space for element linkages.
Open addressing
Open addressing is a collision-resolution technique for preventing collisions in hashing tables. Outside of the hash table, no key is stored. As a result, the hash table's size is always more than or equal to the number of keys. Closed hashing is another name for it.
In open addressing, the following strategies are used:
● Linear probing
● Quadratic probing
● Double hashing
Key takeaway
The hash function is utilized to find the array's index in this case.
The hash value is used as an index in the hash table to hold the key.
For two or more keys, the hash function can return the same hash value.
The size of a static data structure is predetermined. The data structure's content can be changed without affecting the memory space allotted to it. When the home bucket for a new pair (key, element) is full, an overflow occurs.
We might be able to deal with overflows by
Look through the hash table in a systematic manner for an empty bucket.
● Linear probing (linear open addressing).
● Quadratic probing.
● Random probing.
Allow each bucket to preserve a list of all pairings for which it is the home bucket to avoid overflows.
● Array linear list.
● Chain.
Open addressing is used to ensure that all elements are placed directly in the hash table, and it uses a variety of approaches to resolve collisions.
To resolve collisions, Linear Probing is used to place the data into the next available space in the table.
Performance of Linear Probing
● The worst-case time for find/insert/erase is (m), where m is the number of pairings in the table.
● When all pairings are in the same cluster, this happens.
Problem of Linear Probing
● Identifiers have a tendency to group together.
● Adjacent clusters are forming a ring.
● Increase or improve the time spent searching.
Random Probing
Random Probing performs incorporating with random numbers.
H(x):= (H’(x) + S[i]) % b
S[i] is a table along with size b-1
S[i] is indicated as a random permutation of integers [1, b-1].
References:
- Data Structures and program design in C by Robert Kruse, Bruce Leung & Clovis Tondo.
- Data Structures: A Pseudocode Approach with C by Richard F. Gilberg and
Behrouz Forouzan.
3. Data Structures using C by Tanenbaum, Pearson Education
4. Data structures and Algorithm Analysis in C, 2nd edition, M.A.Weiss, Pearson
Unit - 4
Graphs
A graph can be defined as group of vertices and edges that are used to connect these vertices. A graph can be seen as a cyclic tree, where the vertices (Nodes) maintain any complex relationship among them instead of having parent child relationship.
Definition
A graph G can be defined as an ordered set G (V, E) where V(G) represents the set of vertices and E(G) represents the set of edges which are used to connect these vertices.
A Graph G (V, E) with 5 vertices (A, B, C, D, E) and six edges ((A, B), (B, C), (C, E), (E, D), (D, B), (D, A)) is shown in the following figure.
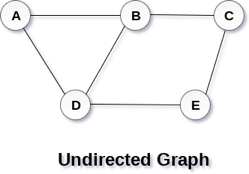
Fig 1– Undirected graph
Directed and Undirected Graph
A graph can be directed or undirected. However, in an undirected graph, edges are not associated with the directions with them. An undirected graph is shown in the above figure since its edges are not attached with any of the directions. If an edge exists between vertex A and B then the vertices can be traversed from B to A as well as A to B.
In a directed graph, edges form an ordered pair. Edges represent a specific path from some vertex A to another vertex B. Node A is called the initial node while node B is called terminal node.
A directed graph is shown in the following figure.
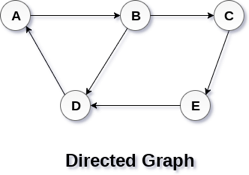
Fig 2– Directed graph
Graph Terminology
Path
A path can be defined as the sequence of nodes that are followed in order to reach some terminal node V from the initial node U.
Closed Path
A path will be called as closed path if the initial node is same as terminal node. A path will be closed path if V0=VN.
Simple Path
If all the nodes of the graph are distinct with an exception V0=VN, then such path P is called as closed simple path.
Cycle
A cycle can be defined as the path which has no repeated edges or vertices except the first and last vertices.
Connected Graph
A connected graph is the one in which some path exists between every two vertices (u, v) in V. There are no isolated nodes in connected graph.
Complete Graph
A complete graph is the one in which every node is connected with all other nodes. A complete graph contain n(n-1)/2 edges where n is the number of nodes in the graph.
Weighted Graph
In a weighted graph, each edge is assigned with some data such as length or weight. The weight of an edge e can be given as w(e) which must be a positive (+) value indicating the cost of traversing the edge.
Digraph
A digraph is a directed graph in which each edge of the graph is associated with some direction and the traversing can be done only in the specified direction.
Loop
An edge that is associated with the similar end points can be called as Loop.
Adjacent Nodes
If two nodes u and v are connected via an edge e, then the nodes u and v are called as neighbours or adjacent nodes.
Degree of the Node
A degree of a node is the number of edges that are connected with that node. A node with degree 0 is called as isolated node.
Key takeaway
- A graph can be defined as group of vertices and edges that are used to connect these vertices.
- A graph can be seen as a cyclic tree, where the vertices (Nodes) maintain any complex relationship among them instead of having parent child relationship.
Graph traversal is a method for finding a vertex in a graph. It's also utilised to determine the order in which vertices should be visited during the search.
Without producing loops, a graph traversal finds the edges to be employed in the search process. This means that using graph traversal, we can visit all of the graph's vertices without being stuck in a loop. There are two methods for traversing a graph:
● DFS (Depth First Search)
● BFS (Breadth-First Search)
Depth First Search
Depth First Search is an algorithm for traversing or searching a graph.
It starts from some node as the root node and explores each and every branch of that node before backtracking to the parent node.
DFS is an uninformed search that progresses by expanding the first child node of the graph that appears and thus going deeper and deeper until a goal node is found, or until it hits a node that has no children.
Then the search backtracks, returning to the most recent node it hadn't finished exploring. In a non-recursive implementation, all freshly expanded nodes are added to a LIFO stack for expansion.
Steps for implementing Depth first search
Step 1: - Define an array A or Vertex that store Boolean values, its size should be greater or equal to the number of vertices in the graph G.
Step 2: - Initialize the array A to false
Step 3: - For all vertices v in G
If A[v] = false
Process (v)
Step 4: - Exit
Algorithm for DFS
DFS(G)
{
for each v in V, //for loop V+1 times
{
Color[v]=white; // V times
p[v]=NULL; // V times
}
time=0; // constant time O (1)
for each u in V, //for loop V+1 times
if (color[u]==white) // V times
DFSVISIT(u) // call to DFSVISIT(v), at most V times O(V)
}
DFSVISIT(u)
{
color[u]=gray; // constant time
t[u] = ++time;
for each v in Adj(u) // for loop
if (color[v] == white)
{
p[v] = u;
DFSVISIT(v); // call to DFSVISIT(v)
}
color[u] = black; // constant time
f[u]=++time; // constant time
}
DFS algorithm used to solve following problems:
● Testing whether graph is connected.
● Computing a spanning forest of graph.
● Computing a path between two vertices of graph or equivalently reporting that no such path exists.
● Computing a cycle in graph or equivalently reporting that no such cycle exists.
Analysis of DFS
In the above algorithm, there is only one DFSVISIT(u) call for each vertex u in the vertex set V. Initialization complexity in DFS(G) for loop is O(V). In second for loop of DFS(G), complexity is O(V) if we leave the call of DFSVISIT(u).
Now, let us find the complexity of function DFSVISIT(u)
The complexity of for loop will be O(deg(u)+1) if we do not consider the recursive call to DFSVISIT(v). For recursive call to DFSVISIT(v), (complexity will be O(E) as
Recursive call to DFSVISIT(v) will be at most the sum of degree of adjacency for all vertex v in the vertex set V. It can be written as ∑ |Adj(v)|=O(E) vεV
The running time of DSF is (V + E).
Breadth First Search
It is an uninformed search methodology which first expand and examine all nodes of graph systematically in search of the solution in the sequence and then go at the deeper level. In other words, it exhaustively searches the entire graph without considering the goal until it finds it.
From the standpoint of the algorithm, all child nodes obtained by expanding a node are added to a FIFO queue. In typical implementations, nodes that have not yet been examined for their neighbors are placed in some container (such as a queue or linked list) called "open" and then once examined are placed in the container "closed".
Steps for implementing Breadth first search
Step 1: - Initialize all the vertices by setting Flag = 1
Step 2: - Put the starting vertex A in Q and change its status to the waiting state by setting Flag = 0
Step 3: - Repeat through step 5 while Q is not NULL
Step 4: - Remove the front vertex v of Q. Process v and set the status of v to the processed status by setting Flag = -1
Step 5: - Add to the rear of Q all the neighbour of v that are in the ready state by setting Flag = 1 and change their status to the waiting state by setting flag = 0
Step 6: - Exit
Algorithm for BFS
BFS (G, s)
{
for each v in V - {s} // for loop {
color[v]=white;
d[v]= INFINITY;
p[v]=NULL;
}
color[s] = gray;
d[s]=0;
p[s]=NULL;
Q = ø; // Initialize queue is empty
Enqueue(Q, s); /* Insert start vertex s in Queue Q */
while Q is nonempty // while loop
{
u = Dequeue[Q]; /* Remove an element from Queue Q*/
for each v in Adj[u] // for loop
{ if (color[v] == white) /*if v is unvisted*/
{
color[v] = gray; /* v is visted */
d[v] = d[u] + 1; /*Set distance of v to no. Of edges from s to u*/
p[v] = u; /*Set parent of v*/
Enqueue(Q,v); /*Insert v in Queue Q*/
}
}
color[u] = black; /*finally visted or explored vertex u*/
}
}
Breadth First Search algorithm used in
● Prim's MST algorithm.
● Dijkstra's single source shortest path algorithm.
● Testing whether graph is connected.
● Computing a cycle in graph or reporting that no such cycle exists.
Analysis of BFS
In this algorithm first for loop executes at most O(V) times.
While loop executes at most O(V) times as every vertex v in V is enqueued only once in the Queue Q. Every vertex is enqueued once and dequeued once so queuing will take at most O(V) time.
Inside while loop, there is for loop which will execute at most O(E) times as it will be at most the sum of degree of adjacency for all vertex v in the vertex set V.
Which can be written as
∑ |Adj(v)|=O(E)
vεV
Total running time of BFS is O(V + E).
Like depth first search, BFS traverse a connected component of a given graph and defines a spanning tree.
Space complexity of DFS is much lower than BFS (breadth-first search). It also lends itself much better to heuristic methods of choosing a likely-looking branch. Time complexity of both algorithms are proportional to the number of vertices plus the number of edges in the graphs they traverse.
Key takeaways
- Depth First Search is an algorithm for traversing or searching a graph.
- DFS is an uninformed search that progresses by expanding the first child node of the graph that appears and thus going deeper and deeper until a goal node is found, or until it hits a node that has no children.
- BFS is an uninformed search methodology which first expand and examine all nodes of graph systematically in search of the solution in the sequence and then goes to the deeper level.
- In other words, it exhaustively searches the entire graph without considering the goal until it finds it.
Graph Representation
By Graph representation, we simply mean the technique which is to be used in order to store some graph into the computer's memory.
There are two ways to store Graph into the computer's memory.
1. Sequential Representation
In sequential representation, we use an adjacency matrix to store the mapping represented by vertices and edges. In adjacency matrix, the rows and columns are represented by the graph vertices. A graph having n vertices, will have a dimension n x n.
An entry Mij in the adjacency matrix representation of an undirected graph G will be 1 if there exists an edge between Vi and Vj.
An undirected graph and its adjacency matrix representation is shown in the following figure.
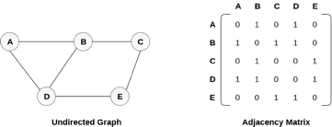
Fig 3– Undirected graph and its adjacency matrix
In the above figure, we can see the mapping among the vertices (A, B, C, D, E) is represented by using the adjacency matrix which is also shown in the figure.
There exists different adjacency matrices for the directed and undirected graph. In directed graph, an entry Aij will be 1 only when there is an edge directed from Vi to Vj.
A directed graph and its adjacency matrix representation is shown in the following figure.
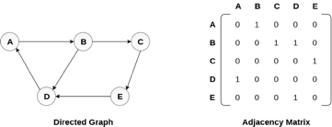
Fig 4- Directed graph and its adjacency matrix
Representation of weighted directed graph is different. Instead of filling the entry by 1, the Non- zero entries of the adjacency matrix are represented by the weight of respective edges.
The weighted directed graph along with the adjacency matrix representation is shown in the following figure.
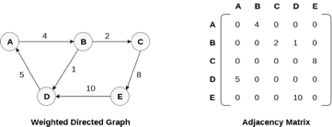
Fig 5 - Weighted directed graph
Adjacency list
Linked Representation
In the linked representation, an adjacency list is used to store the Graph into the computer's memory.
Consider the undirected graph shown in the following figure and check the adjacency list representation.

Fig 6- Undirected graph in adjacency list
An adjacency list is maintained for each node present in the graph which stores the node value and a pointer to the next adjacent node to the respective node. If all the adjacent nodes are traversed then store the NULL in the pointer field of the last node of the list. The sum of the lengths of adjacency lists is equal to twice of the number of edges present in an undirected graph.
Consider the directed graph shown in the following figure and check the adjacency list representation of the graph.
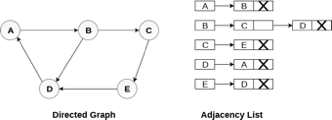
Fig 7- Directed graph in adjacency list
In a directed graph, the sum of lengths of all the adjacency lists is equal to the number of edges present in the graph.
In the case of weighted directed graph, each node contains an extra field that is called the weight of the node. The adjacency list representation of a directed graph is shown in the following figure.

Fig 8- Weighted directed graph
Key takeaway
- By Graph representation, we simply mean the technique which is to be used in order to store some graph into the computer's memory.
- There are two ways to store Graph into the computer's memory.
- In the linked representation, an adjacency list is used to store the Graph into the computer's memory.
- An adjacency list is maintained for each node present in the graph which stores the node value and a pointer to the next adjacent node to the respective node.
Bellman-Ford Algorithm shortest path
Solves single shortest path problem in which edge weight may be negative but no negative cycle exists.
This algorithm works correctly when some of the edges of the directed graph G may have negative weight. When there are no cycles of negative weight, then we can find out the shortest path between source and destination.
It is slower than Dijkstra's Algorithm but more versatile, as it capable of handling some of the negative weight edges.
This algorithm detects the negative cycle in a graph and reports their existence.
Based on the "Principle of Relaxation" in which more accurate values gradually recovered an approximation to the proper distance by until eventually reaching the optimum solution.
Given a weighted directed graph G = (V, E) with source s and weight function w: E → R, the Bellman-Ford algorithm returns a Boolean value indicating whether or not there is a negative weight cycle that is attainable from the source. If there is such a cycle, the algorithm produces the shortest paths and their weights. The algorithm returns TRUE if and only if a graph contains no negative - weight cycles that are reachable from the source.
Recurrence Relation
Distk [u] = [min[distk-1 [u],min[ distk-1 [i]+cost [i,u]]] as i except u.
k → k is the source vertex
u → u is the destination vertex
i → no of edges to be scanned concerning a vertex.
BELLMAN -FORD (G, w, s)
1. INITIALIZE - SINGLE - SOURCE (G, s)
2. For i ← 1 to |V[G]| - 1
3. Do for each edge (u, v) ∈ E [G]
4. Do RELAX (u, v, w)
5. For each edge (u, v) ∈ E [G]
6. Do if d [v] > d [u] + w (u, v)
7. Then return FALSE.
8. Return TRUE.
Example: Here first we list all the edges and their weights.
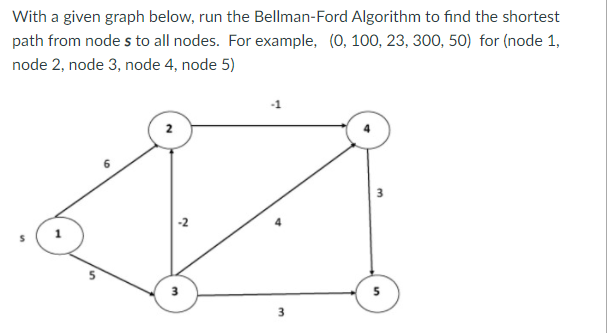
Solution:
Distk [u] = [min[distk-1 [u],min[distk-1 [i]+cost [i,u]]] as i ≠ u.
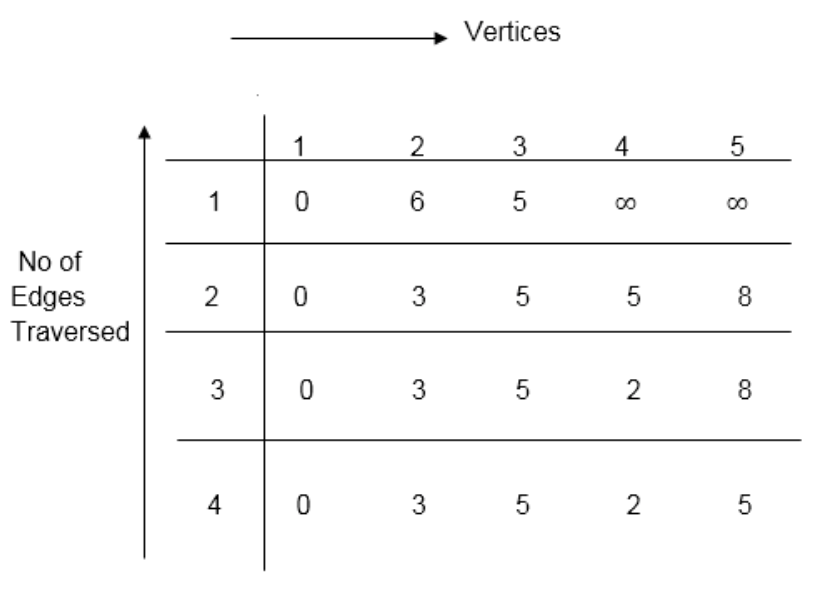
Dist2 [2]=min[dist1 [2],min[dist1 [1]+cost[1,2],dist1 [3]+cost[3,2],dist1 [4]+cost[4,2],dist1 [5]+cost[5,2]]]
Min = [6, 0 + 6, 5 + (-2), ∞ + ∞ , ∞ +∞] = 3
Dist2 [3]=min[dist1 [3],min[dist1 [1]+cost[1,3],dist1 [2]+cost[2,3],dist1 [4]+cost[4,3],dist1 [5]+cost[5,3]]]
Min = [5, 0 +∞, 6 +∞, ∞ + ∞ , ∞ + ∞] = 5
Dist2 [4]=min[dist1 [4],min[dist1 [1]+cost[1,4],dist1 [2]+cost[2,4],dist1 [3]+cost[3,4],dist1 [5]+cost[5,4]]]
Min = [∞, 0 +∞, 6 + (-1), 5 + 4, ∞ +∞] = 5
Dist2 [5]=min[dist1 [5],min[dist1 [1]+cost[1,5],dist1 [2]+cost[2,5],dist1 [3]+cost[3,5],dist1 [4]+cost[4,5]]]
Min = [∞, 0 + ∞,6 + ∞,5 + 3, ∞ + 3] = 8
Dist3 [2]=min[dist2 [2],min[dist2 [1]+cost[1,2],dist2 [3]+cost[3,2],dist2 [4]+cost[4,2],dist2 [5]+cost[5,2]]]
Min = [3, 0 + 6, 5 + (-2), 5 + ∞ , 8 + ∞ ] = 3
Dist3 [3]=min[dist2 [3],min[dist2 [1]+cost[1,3],dist2 [2]+cost[2,3],dist2 [4]+cost[4,3],dist2 [5]+cost[5,3]]]
Min = [5, 0 + ∞, 3 + ∞, 5 + ∞,8 + ∞ ] = 5
Dist3 [4]=min[dist2 [4],min[dist2 [1]+cost[1,4],dist2 [2]+cost[2,4],dist2 [3]+cost[3,4],dist2 [5]+cost[5,4]]]
Min = [5, 0 + ∞, 3 + (-1), 5 + 4, 8 + ∞ ] = 2
Dist3 [5]=min[dist2 [5],min[dist2 [1]+cost[1,5],dist2 [2]+cost[2,5],dist2 [3]+cost[3,5],dist2 [4]+cost[4,5]]]
Min = [8, 0 + ∞, 3 + ∞, 5 + 3, 5 + 3] = 8
Dist4 [2]=min[dist3 [2],min[dist3 [1]+cost[1,2],dist3 [3]+cost[3,2],dist3 [4]+cost[4,2],dist3 [5]+cost[5,2]]]
Min = [3, 0 + 6, 5 + (-2), 2 + ∞, 8 + ∞ ] =3
Dist4 [3]=min[dist3 [3],min[dist3 [1]+cost[1,3],dist3 [2]+cost[2,3],dist3 [4]+cost[4,3],dist3 [5]+cost[5,3]]]
Min = 5, 0 + ∞, 3 + ∞, 2 + ∞, 8 + ∞ ] =5
Dist4 [4]=min[dist3 [4],min[dist3 [1]+cost[1,4],dist3 [2]+cost[2,4],dist3 [3]+cost[3,4],dist3 [5]+cost[5,4]]]
Min = [2, 0 + ∞, 3 + (-1), 5 + 4, 8 + ∞ ] = 2
Dist4 [5]=min[dist3 [5],min[dist3 [1]+cost[1,5],dist3 [2]+cost[2,5],dist3 [3]+cost[3,5],dist3 [5]+cost[4,5]]]
Min = [8, 0 +∞, 3 + ∞, 8, 5] = 5
Minimum spanning tree
In the Greedy approach MST (Minimum Spanning Trees) is used to find the cost or the minimum path. Let G= (V, E) be an undirected connected graph, also T= (V’, E’) be a subgraph of the spanning tree G if and only if T is a tree.
Spanning trees are usually used to get an independent set of circuit’s equations in the electrical network. Once the spanning tree is obtained, suppose B is a set of edges not present in the spanning tree then adding one edge from B will form an electrical cycle.
A spanning tree is a minimal subgraph G’ of G such that V (G’) =V (G) and G’ is connected by a minimal subgraph. Any connected graph with n vertices must have at least n-1 edges and all connected graphs with n-1 edges are trees. The spanning trees of G will represent all feasible choices. The best spanning tree is tree with the minimum cost.
The cost of the spanning tree is nothing but the sum of the cost of the edges in that tree. Any tree consisting of edges of a graph and including all the vertices of the graph is known as a “Spanning Tree”.
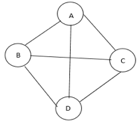
Fig 9: Graph with vertices
The above figure shows a graph with four vertices and some of its spanning tree are shown as below:
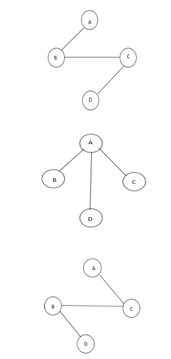
Fig 10: Spanning tree
Minimum Cost Spanning Tree
Definition: Let G= (V, E) be an undirected connected graph. A sub-graph t= (V, E’) of G is a spanning tree of G if t is a tree.
Spanning trees have many applications. It can be used to obtain an independent set of circuit equations for an electric network.
In Greedy approach a Minimum Cost Spanning Tree is created using the given graph G. Let us consider a connected weighted graph G our aim here is to create a spanning tree T for G such that the sum of the weights of the tree edges in T is as small as possible.
To do so the greedy approach is to draw the tree by selecting edge by edge. Initially the first edge is selected and then the next edge is selected by considering the lowest cost. The process selecting edges one by one goes on till all the vertices have been visited with the edges of the minimum cost.
There are two ways to do so: -
- Kruskal’s Algorithm: - Here edges of the graph are considered in non-decreasing order of cost. The set of T of edges so far selected for the spanning tree should be such that it is possible to complete T into a tree.
- Prim’s Algorithm: - Here the set of edges so far selected should from a tree. Now if A is the set of edges selected so far, then A has to form a tree. The next edge (u, v) to be included in A is a minimum cost edge not in A with the property that A ∪ {(u, v)} also results in a tree.
Key takeaways
- In the Greedy approach Minimum Spanning Trees is used to find the cost or the minimum path.
- Spanning trees have many applications. It can be used to obtain an independent set of circuit equations for an electric network.
- A spanning tree is a minimal subgraph G’ of G such that V (G’) =V (G) and G’ is connected by a minimal subgraph.
Application of BFS
The following are some of the most important BFS applications:
Un-weighted Graphs
The BFS technique can quickly generate the shortest path and a minimum spanning tree in order to visit all of the graph's vertices in the lowest amount of time while maintaining excellent accuracy.
P2P networks
In a peer-to-peer network, BFS can be used to locate all of the closest or nearby nodes. This will help you discover the information you need faster.
Web Crawlers
Using BFS, search engines or web crawlers may quickly create many tiers of indexes. The BFS implementation begins with the source, which is a web page, and then proceeds through all of the links on that page.
Networking broadcasting
The BFS algorithm guides a broadcast packet to find and reach all of the nodes for whom it has an address.
Application of DFS
The following are some of the most important DFS applications:
Weighted Graph
DFS graph traversal provides the shortest path tree and least spanning tree in a weighted graph.
Detecting a Cycle in a Graph
If we discovered a back edge during DFS, the graph exhibits a cycle. As a result, we should perform DFS on the graph and double-check the back edges.
Path Finding
We can specialize in finding a path between two vertices using the DFS algorithm.
Topological Sorting
It's mostly used to schedule jobs based on the interdependence between groups of jobs. It is utilized in instruction scheduling, data serialization, logic synthesis, and selecting the order of compilation processes in computer science.
Searching Strongly Connected Components of a Graph
When there is a path from each and every vertex in the graph to the remaining vertex, it is employed in a DFS graph.
Solving Puzzles with Only One Solution
By incorporating nodes on the existing path in the visited set, the DFS algorithm may easily be extended to find all solutions to a maze.
Hashing is implemented using one of two methods:
● Hashing with Chaining
● Hashing with open addressing
Hashing with chaining
The element in S is stored in Hash table T [0...m-1] of size m, where m is somewhat greater than n, the size of S, in Hashing with Chaining. There are m slots in the hash table. A hash function h is associated with the hashing technique, and it maps from U to {0...m-1}. We say that k is hashed into slot h since each key k ∈ S is kept in location T [h (k)] (k). A collision occurs when more than one key in S is hashed into the same slot.
All keys that hash into the same slot are placed in a linked list associated with that slot, which is referred to as the chain at slot. A hash table's load factor is defined as ∝=n/m, which represents the average amount of keys per slot. Because we frequently work in the m=θ(n) range, ∝ is usually a constant of ∝<1.
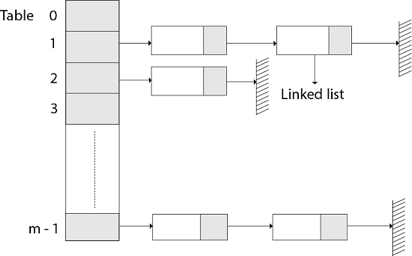
Fig 11: Hashing with chaining
Hashing with open address
All components in Open Addressing are kept in the hash table. That is, each table entry contains a dynamic set component or NIL. When looking for anything, we check table slots until we either find the item or establish that it isn't in the table. As a result, the load factor in open addressing can never exceed 1.
Open addressing has the advantage of avoiding Pointer. We compute the sequence of slots to be examined in this step. Because no pointers are shared, the hash table can have a larger number of slots for the same amount of memory, potentially resulting in fewer collisions and faster retrieval.
Probing is the process of inspecting a position in the hash table.
As a result, the hash function is transformed.
h : U x {0,1,....m-1} → {0,1,....,m-1}.
With open addressing, we need the probe sequence for every key k.
{h, (k, 0), h (k, 1)....h (k, m-1)}
Be a Permutation of (0, 1...... m-1)
A hash table T and a key k are passed to the HASH-INSERT method as inputs.
HASH-INSERT (T, k)
1. i ← 0
2. Repeat j ← h (k, i)
3. If T [j] = NIL
4. Then T [j] ← k
5. Return j
6. Else ← i= i +1
7. Until i=m
8. Error "hash table overflow"
The procedure HASH-SEARCH takes a hash table T and a key k as input and returns j if key k is found in slot j or NIL if key k is not found in table T.
HASH-SEARCH.T (k)
1. i ← 0
2. Repeat j ← h (k, i)
3. If T [j] =j
4. Then return j
5. i ← i+1
6. Until T [j] = NIL or i=m
7. Return NIL
Compilers construct and maintain symbol tables to record information about the presence of various entities such as variable names, function names, objects, classes, and interfaces, among other things. Both the analysis and synthesis components of a compiler use the symbol table.
Depending on the language, a symbol table may be used for the following purposes:
● To keep all of the names of all entities in one place in a systematic format.
● To determine whether or not a variable has been declared.
● Type checking is implemented by ensuring that assignments and expressions in source code are semantically accurate.
● to figure out what a name's scope is (scope resolution).
A symbol table is a simple table that can be linear or hash-based. It keeps track of each name using the following format:
<symbol name, type, attribute>
The compiler creates and maintains the Symbol Table in order to keep track of variable semantics, i.e. it keeps information about the scope and binding information about names, information about instances of various things such as variable and function names, classes, objects, and so on.
● It has lexical and syntax analysis steps built in.
● The information is collected by the compiler's analysis phases and used by the compiler's synthesis phases to build code.
● The compiler uses it to improve compile-time performance.
Symbol Table entries –
Each entry in the symbol table is linked to a set of properties that assist the compiler at various stages.
Items stored in Symbol table:
● Constants and variable names
● Names of procedures and functions.
● Strings and literal constants
● Temporaries were created by the compiler.
● Labels in the languages of origin.
Information used by the compiler from Symbol table:
● Data type and name
● Declaring procedures
● Offset in storage
● If structure or record then, a pointer to structure table.
● For parameters, whether parameter passing by value or by reference
● Number and type of arguments passed to function
● Base Address
Static data structure
The size of a static data structure is predetermined. The data structure's content can be changed without affecting the memory space allotted to it.

Fig 12: Example of static tree table
Dynamic data structure
The size of a dynamic data structure is not fixed and can be changed while operations are being performed on it. Dynamic data structures are intended to allow for data structure changes in real time.

Static Data Structure vs Dynamic Data Structure
The memory size of a static data structure is fixed, whereas the size of a dynamic data structure can be arbitrarily modified during runtime, making it more efficient in terms of memory complexity. In comparison to dynamic data structures, static data structures give easier access to elements. Dynamic data structures, unlike static data structures, are adaptable.
A hash table is a type of data structure that employs a particular function known as a hash function to map a given value to a key in order to retrieve elements more quickly.
A hash table is a data structure that stores information with two major components: key and value. With the help of an associative array, a hash table can be created. The effectiveness of the hash function used for mapping is determined by the efficiency of the hash function used for mapping.
A hash table is a data structure that stores data in a way that is associative. Data is stored in an array format in a hash table, with each data value having its own unique index value. If we know the index of the needed data, data access becomes very quick.
As a result, it becomes a data structure in which insertion and search operations are extremely quick, regardless of data size. Hash Tables store data in an array and utilize the hash technique to generate an index from which an element can be inserted or located.
For example, if the key value is John and the value is the phone number, we may use the following hash function to pass the key value:
Hash(key)= index;
The index is returned when the key is passed to the hash function.
Hash(john) = 3;
The john is added to the index 3 in the example above.
Hashing
Hashing is a method of converting a set of key values into a set of array indexes. To get a range of key values, we'll utilise the modulo operator. Consider an example of hash table of size 20, and the following items are to be stored. Item are in the (key,value) format.

● (1,20)
● (2,70)
● (42,80)
● (4,25)
● (12,44)
● (14,32)
● (17,11)
● (13,78)
● (37,98)
Sr.No. | Key | Hash | Array Index |
1 | 1 | 1 % 20 = 1 | 1 |
2 | 2 | 2 % 20 = 2 | 2 |
3 | 42 | 42 % 20 = 2 | 2 |
4 | 4 | 4 % 20 = 4 | 4 |
5 | 12 | 12 % 20 = 12 | 12 |
6 | 14 | 14 % 20 = 14 | 14 |
7 | 17 | 17 % 20 = 17 | 17 |
8 | 13 | 13 % 20 = 13 | 13 |
9 | 37 | 37 % 20 = 17 | 17 |
The Hash Function is used to index the original value or key, and it is then utilized to obtain the data associated with the value or key. As a result, hashing is always a one-way process. By studying the hashed values, there is no need to "reverse engineer" the hash algorithm.
Characteristics of Good Hash Function:
● The data being hashed completely determines the hash value.
● All of the input data is used by the hash function.
● The hash function distributes the data "uniformly" across all potential hash values.
● For comparable strings, the hash function gives complicated hash values.
Some hash function
Division method
Select a number m that is less than the number of n keys in k. (The number m is usually chosen to be a prime number or a number without small divisors, since this frequently has a minimum number of collisions).
The hash function is as follows:
h (k) = k mod m h (k) = k mod m + 1
Example - If m = 12 is the size of the hash table and k = 100 is the key, then h (k) = 4. Hashing via division is quick since it just requires one division operation.
Multiplication method
There are two phases to producing hash functions using the multiplication approach. First, we extract the fractional component of kA by multiplying the key k by a constant A in the range 0 A 1. Then we multiply this value by m and take the result's floor.
The hash function is as follows:
h (k) = m(k A mod 1
The fractional component of k A, k A -k A, is denoted by "k A mod 1."
Mid square method
The letter k has been squared. The function H is therefore defined as follows:
H (k) = L
L is found by subtracting digits from both ends of k2. We underline that k2 must be used in the same place for all keys.
Folding method
The key k is divided into a number of components k1, k2,... Kn, each with the same amount of digits as the needed address except maybe the last.
The pieces are then combined together, with the last carry ignored.
H (k) = k1+ k2+.....+kn
Key takeaway
The Hash Function is used to index the original value or key, and it is then utilized to obtain the data associated with the value or key.
As a result, hashing is always a one-way process.
● The hash function is utilized to find the array's index in this case.
● The hash value is used as an index in the hash table to hold the key.
● For two or more keys, the hash function can return the same hash value.
● A collision occurs when two or more keys are given the same hash value. Collision resolution strategies are used to deal with this collision.
Collision resolution techniques
Collision resolution strategies are divided into two categories.
● Separate chaining (open hashing)
● Open addressing (closed hashing)
Separate chaining
This strategy involves creating a linked list from the slot where the collision occurred, then inserting the new key into the linked list. Separate chaining refers to the linked list of slots that resembles a chain. When we don't know how many keys to insert or remove, we use it more.
Time complexity
● Its worst-case searching complexity is o (n).
● Its worst-case deletion complexity is o (n).
Advantages of separate chaining
● It is simple to put into practice.
● We can add more elements to the chain because the hash table never fills up.
● It is less sensitive to the hashing function.
Disadvantages of separate chaining
● Chaining cache performance is poor in this case.
● In this strategy, there is far too much memory waste.
● It necessitates a larger amount of space for element linkages.
Open addressing
Open addressing is a collision-resolution technique for preventing collisions in hashing tables. Outside of the hash table, no key is stored. As a result, the hash table's size is always more than or equal to the number of keys. Closed hashing is another name for it.
In open addressing, the following strategies are used:
● Linear probing
● Quadratic probing
● Double hashing
Key takeaway
The hash function is utilized to find the array's index in this case.
The hash value is used as an index in the hash table to hold the key.
For two or more keys, the hash function can return the same hash value.
The size of a static data structure is predetermined. The data structure's content can be changed without affecting the memory space allotted to it. When the home bucket for a new pair (key, element) is full, an overflow occurs.
We might be able to deal with overflows by
Look through the hash table in a systematic manner for an empty bucket.
● Linear probing (linear open addressing).
● Quadratic probing.
● Random probing.
Allow each bucket to preserve a list of all pairings for which it is the home bucket to avoid overflows.
● Array linear list.
● Chain.
Open addressing is used to ensure that all elements are placed directly in the hash table, and it uses a variety of approaches to resolve collisions.
To resolve collisions, Linear Probing is used to place the data into the next available space in the table.
Performance of Linear Probing
● The worst-case time for find/insert/erase is (m), where m is the number of pairings in the table.
● When all pairings are in the same cluster, this happens.
Problem of Linear Probing
● Identifiers have a tendency to group together.
● Adjacent clusters are forming a ring.
● Increase or improve the time spent searching.
Random Probing
Random Probing performs incorporating with random numbers.
H(x):= (H’(x) + S[i]) % b
S[i] is a table along with size b-1
S[i] is indicated as a random permutation of integers [1, b-1].
References:
- Data Structures and program design in C by Robert Kruse, Bruce Leung & Clovis Tondo.
- Data Structures: A Pseudocode Approach with C by Richard F. Gilberg and
Behrouz Forouzan.
3. Data Structures using C by Tanenbaum, Pearson Education
4. Data structures and Algorithm Analysis in C, 2nd edition, M.A.Weiss, Pearson