UNIT 1
INTRODUCTION
India ranks second in the world in terms of population and are the largest democratic country. India has adopted a new Population Policy in 1990-91 which accelerated economic growth rate faster.
BASIC CHARACTERISTICS ARE AS FOLLOWS,
1- Pre-dominance of Agriculture.
2- High population.
3- Underutilized Natural resources.
4- Low Human development index.
5- Lack of infrastructure facility.
6- Capital deficiency.
7- Wide spread unemployment.
8- Technological backwardness.
9- Poor economic organizations.
10-Low per capita income
11-Economic backwardness
12-Poverty
1. PRE-DOMINANCE OF AGRICULTURE: Agriculture is that the main sector of Indian economy which is in total contrast to the economic structure of a developed economy. More than 70 you look after the entire population are engaged in agricultural activities while the picture is absolutely different in advanced countries. Unemployment, poverty, low productivity, lack of irrigation facility is the main problems of agriculture.
2. HIGH POPULATION: Population may be a major factor influencing the nature of a country's economy. Over population creates complex economic problems. India is that the second largest populated country within the world having population of 238 million in 2001 and 1138 million in 2011. It means 17, 64% population has been increased since 2001 to 2011. The population pressure is that the results of two forces that's high birth rate and lower death rate. As per 2011 census, India's birth rate was 23 and death rate was 7. High population rate is that the main problem that India has been facing since 50 years.
3. UNDERUTILIZED NATURAL RESOURCES: It's been stated that India may be a rich country inhabited by poor people. It means that the country possesses abundant stock of natural resources but the problem is that these resources aren't fully utilized for the production of material good and services.
4. LOW HUMAN DEVELOPMENT INDEX: Within the developed countries, people are getting 3600 calories through food but Indians aren't getting even 2400 calories through food. It's an excellent draw back relating total intake. India's literacy rate is 76 about we will say 24 which individuals are still illiterate. India's life expectancy is 64 at birth and developed countries life expectancy is more than 80.
5. LACK OF INFRASTRUCTURE FACILITY: Infrastructure is split into two parts as follow,
A- Physical infrastructure
B- Social infrastructure
A- Physical infrastructure: Which refers to road, electricity, banking, transportation, communication, insurance, energy etc.? Physical infrastructure is said to development process and it's closely linked with GDP.
B- Social infrastructure: Which refers to education,health, housing, drinking water and sanitation? Social infrastructure related to human resource development and it's indirectly or indirectly related to GDP.
6. CAPITAL DEFICIENCY: Capital deficiency affects economy also as social factors; India suffers from deep rooted shortage of capital. The level of savings is very low and capital formation rate is also low. Capital deficiency is extremely low because the population rate rises at a rapid rate.
7. WIDE SPREAD UNEMPLOYMENT: Unemployment in India may be a direct outcome of the rapidly increasing population. More people need more jobs but the underdeveloped economy of India can't accommodate them.
8. TECHNOLOGICAL BACKWARDNESS: is another feature of Indian economy. India is a smaller amount advanced in technology as compared to developed countries. As a result developed countries are better in production than India. India is facing backward and outdated technology.
9. POOR ECONOMIC ORGANIZATION: Economic organization is an important and pushing factor for economic institutions are working in India, however it's not developed enough. Banking systems aren't developed well in rural areas, in recent year’s capital and money markets aren't much developed in India. Industrial banks, financial institutions aren't very common in India. In this point of view India has lack of structural economic organization set up.
10. LOW PER CAPITA INCOME: due to large size of population, India is facing the problem of low per capita income. According to the 2011 census, India's population is 121 crores . According to World Development Report, India's per capita income was $3620. It's a really low per capita income as compared to developed countries.
11. ECONOMIC BACKWARDNESS: India is developing country and has been facing the problem of unemployment, poverty, low per capita income, lack of technology, high growth rate of population, low labor efficiency, economic ignorance, social and religious problems factors, immobility, limited developed occupation and trade, caste system, corruption at every stage.Thus reflecting India as economically back ward country.
12. POVERTY: Majority of people in India has low levels of income and poverty is usually reflected in low level income people. Lack of educational and health facilities, poor hygienic living conditions, criminal environment, lack of infrastructural facilities effect on poverty. More ever rural also as urban area relates poverty. Consistent with the Indian planning commission, there have been 29 which people below poverty level in 2009-10. Thus it's an enormous challenge to reduce poverty.
1.2.1 NATIONAL INCOME
INTRODUCTION
National income means the value of goods and services produced by a country during a financial year. Thus, it's the net results of all economic activities of any country during a period of one year and is valued in terms of money. National income is an uncertain term and is usually used interchangeably with the national dividend, national output, and national expenditure. We will understand this concept by understanding the national income definition.
CONCEPT OF VALUE
The national income is the total amount of income accruing to a country from economic activities during a years’ time. It includes payments made to all or any resources either in the form of wages, interest, rent, and profits.
The progress of a country are often determined by the expansion of the national income of the country
NATIONAL INCOME DEFINITION
There are two national income Definition
1 Traditional Definition.
2 Modern Definition.
3 Traditional Definition.
According to Marshall: “The labor and capital of a country acting on its natural resources produce annually a certain net aggregate of commodities, material and immaterial including services of all kinds. This is the true net annual income or revenue of the country or national dividend.”
The definition as laid down by Marshall is being criticized on the subsequent grounds.
Due to the numerous categories of goods and services, an accurate estimation is extremely difficult.
There is an opportunity of double counting; hence national income can't be estimated correctly.
For example, a product runs within the supply from the producer to distributor to wholesaler to retailer then to the ultimate consumer. If on every movement commodity is taken into consideration then the value of national income increases.
Also, one other reason is that there are products which are produced but not marketed.
For example, in an agriculture-oriented country like India, there are commodities which though produced but are kept for self-consumption or exchanged with other commodities. Thus there is often an underestimation of national income.
Following are the modern national income definition
• GDP
• GNP
Gross Domestic Product
The total value of goods produced and services rendered within a country during a year is its Gross Domestic Product.
Further, GDP is calculated at market value and is defined as GDP at market prices. Different constituents of GDP are:
Gross National Product
For calculation of GNP, we'd like to gather and assess the data from all productive activities, like agricultural produce, wood, minerals, commodities, the contributions to production by transport, communications, insurance companies, professions such (as lawyers, doctors, teachers, etc.) at market prices.
It also includes net income arising in a country from abroad. Four main constituents of GNP are:
a) Market price
The Actual transacted price including indirect taxes like GST, customs duty etc. Such taxes tend to boost the prices of goods and services within the economy.
b) Factor Cost
It Includes the cost of factors of production e.g. interest on capital, wages to labor, rent for land profit to the stakeholders. Thus services provided by service providers and goods sold by the producer is equal to revenue price.
Alternatively,
Revenue Price (or Factor Cost) = market price (net of) Net Indirect Taxes
Net Indirect Taxes = Indirect Taxes Net of Subsidies received
Hence,
Factor Cost shall be equal to
(Market Price) LESS (Indirect Taxes ADD Subsidies)
Net Domestic Product
The net output of the country’s economy during a year is its NDP. During the year a country’s capital assets are subject to wear and tear due to its use or can become obsolete.
Hence, we deduct a percentage of such investment from the GDP to reach NDP.
So NDP=GDP at factor cost LESS Depreciation.
The Accumulation of all factors of income earned by residents of a rustic and includes income earned from the county also as from abroad.
Thus, national income at Factor Cost shall be equal to
NNP at market price LESS (Indirect Taxes ADD Subsidies)
COMPARISION WTH INDIA TO CHINA IN RESPECT OF NATIONAL INCOME
China and India are the two emerging economies of the world. As of 2019, China and India is 2nd and 5th largest country of the world, respectively in nominal basis. On PPP basis, China is at 1st and India is at 3rd place. Both countries together share 19.46% and 27.18% of total global wealth in nominal and PPP terms, respectively. Among Asian countries, China and India together contribute more than half Asia's GDP.
In 1987, GDP (Nominal) of both countries was almost equal. But in 2019, China's gdp is 4.78 times greater than India. On PPP basis, GDP of China is 2.38x of India. China crossed $1 trillion mark in 1998 while India crossed 9 year later in 2007 at exchange rate basis.
Both countries have been neck-to-neck in GDP per capita terms. As per both methods, India was richer than China in 1990. Now in 2019, China is nearly 4.61 times richer than India in nominal method and 2.30 times richer in PPP method. Per capita rank of China and India is 72th and 145th, respective in nominal. Per capita rank of China and India is 75th and 126th, respective in PPP.
China attains maximum GDP growth rate of 19.30% in year 1970 and minimum -27.27% in 1961. India reached an all time high of 9.63% in 1988 and a record low of -5.24% in 1979. During period 1961 to 2018, China grew by more than 10% in 22 years while India never. GDP growth rate was negative in five and four years for China and India, respectively.
According to CIA Factbook sector wise GDP composition of India in 2017 are as follows: Agriculture (15.4%), Industry (23%) and Services (61.5%). Sector wise GDP composition of China in 2017 are : Agriculture (8.3%), Industry (39.5%) and Services (52.2%).
SOURCE: World Bank: Nominal, PPP, Nominal per capita, PPP per capita & International monetary fund, dated 28 Aug 2019
COMPARISION OF INDIA WITH USA IN RESPECT OF NATIONAL INCOME
BACKGROUND OF INDIA
The Indus Valley civilization, one of the world's oldest, flourished during the 3rd and 2nd millennia B.C. and extended into northwestern India. Aryan tribes from the northwest infiltrated the Indian subcontinent about 1500 B.C.; their merger with the earlier Dravidian inhabitants created the classical Indian culture. The Maurya Empire of the 4th and 3rd centuries B.C. - which reached its zenith under ASHOKA - united much of South Asia. The Golden Age ushered in by the Gupta dynasty (4th to 6th centuries A.D.) saw a flowering of Indian science, art, and culture. Islam spread across the subcontinent over a period of 700 years. in the 10th and 11th centuries, Turks and Afghans invaded India and established the Delhi Sultanate. in the early 16th century, the Emperor BABUR established the Mughal Dynasty, which ruled India for quite three centuries. European explorers began establishing footholds in India during the 16th century.
By the 19th century, Great Britain had become the dominant political power on the subcontinent and India was seen because the "Jewel in the Crown" of the British Empire. TheBritish Indian Army played an important role in both World Wars. Years of nonviolent resistance to British rule, led by Mohandas GANDHI and JawaharlalNehru, eventually resulted in Indian independence in 1947. Large-scale communal violence happened before and after the subcontinent partition into two separate states - India and Pakistan. The neighboring countries have fought three wars since independence, the last of which was in 1971 and resulted in East Pakistan becoming the separate nation of Bangladesh. India's nuclear weapons tests in 1998 emboldened Pakistan to conduct its own tests that same year. In November 2008, terrorists originating from Pakistan conducted a series of coordinated attacks in Mumbai, India's financial capital. India faces pressing problems like environmental degradation, extensive poverty, and widespread corruption; however, economic growth following the launch of economic reforms in 1991, a huge youthful population, and a strategic geographic location are contributing to India's emergence as a regional and global power.
BACKGROUND OF UNITED STATES
Britain's American colonies broke with the mother country in 1776 and were recognized as the new nation of the US of America following the Treaty of Paris in 1783. During the 19th and 20th centuries, 37 new states were added to the original 13 as the nation expanded across the North American continent and purchased a number of overseas possessions. the two most traumatic experiences within the nation's history were the civil war (1861-65), during which a northern Union of states defeated a secessionist Confederacy of 11 southern slave states, and the great depression of the 1930s, an economic downturn during which about a quarter of the labor force lost its jobs. Buoyed by victories in World Wars I and II and the end of the cold war in 1991, the US remains the world's most powerful nation state. Since the end of world war II, the economy has achieved relatively steady growth, low unemployment and inflation, and rapid advances in technology.
GDP (purchasing power parity) | $9.474 trillion (2017 est.) $8.88 trillion (2016 est.) $8.291 trillion (2015 est.) note: data are in 2017 dollars | $19.49 trillion (2017 est.) $19.06 trillion (2016 est.) $18.77 trillion (2015 est.) note: data are in 2017 dollars |
GDP - real growth rate | 6.7% (2017 est.) 7.1% (2016 est.) 8.2% (2015 est.) | 2.2% (2017 est.) 1.6% (2016 est.) 2.9% (2015 est.) |
GDP - per capita (PPP) | $7,200 (2017 est.) $6,800 (2016 est.) $6,500 (2015 est.) note: data are in 2017 dollars | $59,800 (2017 est.) $58,900 (2016 est.) $58,400 (2015 est.) note: data are in 2017 dollars |
GDP - composition by sector | Agriculture: 15.4% (2016 est.) Industry: 23% (2016 est.) Services: 61.5% (2016 est.) | Agriculture: 0.9% (2017 est.) Industry: 19.1% (2017 est.) Services: 80% (2017 est.) |
SOURCE: CIA Factbook
1.2.2 PER-CAPITA INCOME
WHAT IS PER CAPITA INCOME?
Per capita income is a measure of the amount of money earned per person in a nation or geographic region. Per capita income can be used to determine the average per-person income for an area and to evaluate the standard of living and quality of life of the population. Per capita income for a nation is calculated by dividing the country's national income by its population.
UNDERSTANDING PER CAPITA INCOME
Per capita income counts each man, woman, and child, even newborn babies, as a member of the population. This stands in contrast to other common measurements of an area's prosperity, such as household income, which counts all people residing under one roof as a household, and family income, which counts as a family those related by birth, marriage, or adoption who live under the same roof.
COMPARISION OF INDIA WITH OTHER COUNTRIES
In 2014, the per capita income of an Indian was $1,560. This grew to $1,600 in 2015. Here is a quick comparison table:
GNI per capita (in US Dollars)
| ATLAS METHOD | ATLAS METHOD | PURCHASING POWER PARITY | PURCHASING POWER PARITY |
Countries | 2014 | 2015 | 2014 | 2015 |
USA | 55320 | 55980 | 56130 | 57540 |
UK | 43760 | 43390 | 39810 | 40610 |
JAPAN | 41920 | 36680 | 38060 | 38870 |
GERMANY | 47680 | 45940 | 47560 | 48410 |
INDIA | 1560 | 1600 | 5610 | 6030 |
CHINA | 7520 | 7930 | 13460 | 14390 |
Source: world development indicators
As you'll see in the table above, in both the years, India’s per capita GNI was less than other major economies like the USA, UK, Japan, Germany, and China. Further, in 2015, the per capita GNI of USA was around 35 times that of India. On the other hand, the Purchasing Power Parity rates of the USA were only 10 times that of India.
In simple words, the official exchange rates showed an exaggerated disparity between the economies while the purchasing power parity figures balanced them. Having said this, the difference between the standard of living of an average American and Indian is large and significant.
If we mention China, in 2015, the average per capita GNI of China was around 5 times higher than India. Also, the purchasing power parity figures were twice those of India. However, there's a notable difference in the standard of living of a mean Chinese and Indian citizen.
COMPARISON OF INDIA WITN UNITED STATES
PER CAPITA OF UNTED STATES
The United States census bureau takes a survey of income per capita every ten years and revises its estimates every September. The Census takes the total income for the previous year for everyone 15 years and older and calculates the median average of the data. The census includes earned income (including wages, salaries, and self-employment income), interest income, and dividends also as income from estates and trusts, and government transfers (Social Security, public assistance, welfare, survivor and disability benefits). Not included are employer-paid health cares, money borrowed, insurance payments, gifts, food stamps, public housing, capital gains, medical care, or tax refunds.
According to 2017 Census data, the national per capita income for the year was $31,177 in 2017 dollars as shown in the table below. We can see, from the U.S. census bureau that the per capita income is less than the median household income of $57,652, which is calculated by grouping the number of individuals in each household.
Each metric has its advantages. Per capita income is useful when analyzing a large number of individuals, like the population of the us , which stands at quite 300 million. However, median household income is useful when determining the income of families in the U.S. and especially, how many families are in poverty.
1.2.3 AGRICULTURE
Agriculture, with its allied sectors, is certainly the largest livelihood provider in India, more so in the vast rural areas. It also contributes a significant figure to the Gross Domestic Product (GDP). Sustainable agriculture, in terms of food security, rural employment, and environmentally sustainable technologies like soil conservation, sustainable natural resource management and biodiversity protection, are essential for holistic rural development. Indian agriculture and allied activities have witnessed a green revolution, a white revolution, a yellow revolution and a blue revolution.
This section provides the knowledge on agriculture produces; machineries, research etc. Detailed information on the govt. policies, schemes, agriculture loans, market prices, farming, fisheries, horticulture, loans & credit, sericulture etc. is additionally available.
COMPARISION OF INDIA WITH CHINA AND US
Indian agriculture is labor intensive, mostly subsistence farming, nearly 60% of its population is dependent on farming and most farms are rained. On the other hand, American farming is capital intensive, mostly commercial farming less than 3% of its population is dependent on farming and most farms are irrigated. Both countries give subsidies to their farmers but, US subsidies are more than India’s, hence the Doha round dispute. For variety of obvious reasons the pace and pattern of recent economic development in China and India invite a systematic comparison. it's always interesting to measure and compare the progress of those two great neighbors, comprising a large fraction of the world's poorest people, both having recently launched massive programs of expansion and development after centuries of foreign domination, chaos and stagnation. Over and above that, the significant differences within the institutions and policies, the two countries have chosen to adopt for attaining broadly similar economic goals. This is often particularly true with reference to agriculture. Although, in both countries the main emphasis is on rapid industrialization due to the predominantly agrarian nature of the economies, the agricultural sector provides the essential foundation for industrial expansion with supplies of food, raw materials, and labor, with markets for industrial goods and with foreign exchange earned through exports of primary products. In both countries the pace of industrial advance is severely constrained by the vagaries of agricultural production and dependence on agriculture as an immediate source of income is additionally very substantial, even in any case these years of industrialization. One should note here that the prices at which output is valued being more favorable to industry in China than in India, the relative share of recent industry in value is larger in China. Both have traditionally been agrarian economies and overflow half of their billion-plus people still depend upon land for their livelihood. Given their large populations and histories of famine, India and China also share similar concerns on issues like food security. However, while India’s agricultural sector is growing by about 2.5 per cent; China’s has been steadily growing at between 4 and 5 per cent over the last 15 years. By 2005, China had actually emerged as the world’s third largest food donor.
China with lesser cultivable land produces double the food grains, at 415 million tons per annum compared with India’s 208 million tons per annum. This article is an effort to form a comparative study of farming in India, China and US. To conclude, in agriculture our yields per acre are well below the international norms. India might be an enormous exporter of food, as long as we could put our ‘house in order’ to near world class standards. China with lesser cultivable land produces double the food grains than us. God has been very kind to India with tons of sunshine, rain, rivers, lakes, coastline and good hard working citizens. The Governance in India haven't done enough to point out the results that it's capable of achieving rate as the No.1 country in the world for potential vs performance. Indians score high marks on performance outside India. This is because the Governance is better outside. In countries where the Governance & Administration is poor, the performance of its citizens is also low.
1.2.4 INDUSTRY SECTOR
An industry is a sector that produces goods or related services within an economy. The main source of revenue of a group or company is an indicator of what industry it should be classified in. When a large corporate group has multiple sources of revenue generation, it's considered to be working in several industries. The manufacturing industry became a key sector of production and labor in European and North American countries during the industrial Revolution, upsetting previous mercantile and feudal economies. This came through many successive rapid advances in technology, like the development of steam power and the production of steel and coal
Industrial Revolution
The industrial revolution (from the mid-18th century to the mid-19th century) saw the development and popularization of mechanized means of production as a replacement for hand production. The industrial revolution played a role in the abolition of slavery in Europe and in North America.
COMPARISION WITH U.S
GDP - composition by sector | Agriculture: 15.4% (2016 est.) Industry: 23% (2016 est.) Services: 61.5% (2016 est.) | Agriculture: 0.9% (2017 est.) Industry: 19.1% (2017 est.) Services: 80% (2017 est.) |
|
|
|
Industries
COMPARISON OF INDIA WITH OTHER COUNTRIES OF WORLD
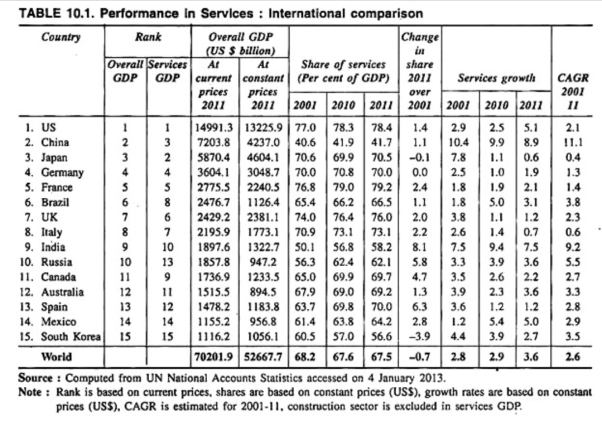
The performance of the services sector in India is very much comparable with that of some of the top developed countries of the world.
It is observed from the table (no. 10.1) that in 2011, the share of services within the US $ 70.2 trillion world gross domestic product (GDP) was around 67.5 per cent as compared to 68.1 per cent in 2001. Again India’s performance in terms of this indicator isn't only above that of other emerging developing countries, but also very close to that of the top developed countries of the world.
Among the top 15 countries with highest overall GDP in 2011, India ranked 9th and 10th in overall GDP and services GDP respectively. While developed countries like UK, USA and France have the highest share of services in GDP at above 78 per cent but the share of services in India of 58.2 per cent is far above that of China at 41.7 per cent in 2011.
Again during the period 2001 to 2011, India is that the topmost country in terms of increase in its services share in GDP (8 percentage points) followed by Spain and Canada (5.3 percentage points each), the U.K. (4.5 percentage points), and Italy (3.2 percentage points).
In respect of compound annual rate of growth (CAGR) of the services sector for the amount 2001-11, the growth rate attained by China at 11.1 per cent and India 9.2 per cent show a really high services sector growth. But an equivalent growth attained by Russia at 5.5 per cent and Brazil at 3.8 per cent are holding distant third and fourth position respectively.
While India’s rate of growth of the services sector at 10.1 per cent in 2009 was even above that of China at 9.6 per cent but in 2011, it's decelerated to 7.4 while China’s rate of growth declined to eight .9 per cent.
All these clearly highlight the prominence of services sector for India. Despite the higher share of services in India’s GDP and China’s dominance in manufacturing over services, the hard fact, however, is to be realized is that in terms of absolute value of services GDP and also in terms of growth of services, China remains, much before India in 2011.
While the growth of absolute value of services in 2011 stands at 8.9 per cent in China as compared thereto of 7.4 per cent in India but the compound annual rate of growth (CAGR) during 2001-11 stands at 11.1 per cent in China as compared thereto of 9.2 per cent in India, 2.3 per cent in U.K., 2.1 per cent in US, 3.8 per cent in Brazil, 5.5 per cent in Russia and 2.7 per cent in Canada.
1.2.5 SERVICE SECTOR
BRIEF NOTE OF ALL THREE SECTORS
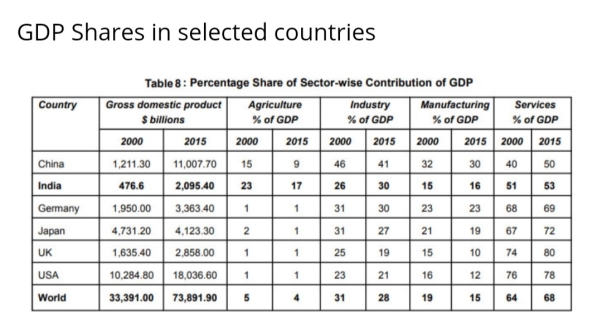
The table above provides information regarding shares in GDP of agriculture, industry, manufacturing, and services. The data reveals a wide variation within the output pattern across different countries. In a developed country just like the USA, agriculture contributed to only 1 percent of GDP in 2000 and 2015.
Also, during an equivalent year, the services sector contributed around 76 percent in 2000 and 78 percent in 2015 to the GDP. In fact, if we look closely, all developed countries have services because the major contributor to the GDP. The industry and manufacturing sector follow suit and therefore the least contributing sector is agriculture.
In 2015, China’s services sector contributed 50 percent to its GDP. Further, within the same year, the share of the industrial, manufacturing, and agricultural sectors was 41, 30, and 9 percent respectively. India skipped the industrial phase and leaped on to services.
Between 200 and 2015, the share of the services sector increased from 51 to 53 percent. For the same period, agriculture contribution decreased from 23 to 17 percent. While the industry’s contribution increased from 26 to 30 percent, the manufacturing sector’s contribution remained stagnant at around 16 percent.