Unit - 3
Compaction and Stress Distribution
Compaction of Soils:
Concept of Compaction:
Purpose of Compaction:
Compaction of soil is undertaken for a number of purposes. These are listed below:
Key Takeaways:
This is the simplest method of increasing the performance, characteristics, especially bearing capacity of soil. In this method, by the application of force or vibrations, the soil particles are more closely packed thereby increasing the density and hence bearing capacity of the soil
Sr.No. | Compaction | consolidation |
1 | Instant compression of soil under dynamic load is called compaction. | Gradual compression under a steady load is called consolidation. |
2 | Takes place before building of structure. | Takes place after building of structure. |
3 | Fast process | Very slow process. |
4 | Carried out for improving soil property. | Occurs naturally due to load of structure. Does not improve soil property. |
5 | Settlement is prevented due to compaction. | Settlement takes place due to consolidation. |
6 | Artificial process. | Natural process. |
7 | Pore water pressure not very important. | Pore water pressure very important. |
8 | Does not go on indefinitely. | Goes on indefinitely. |
3.3.1 Standard Proctor test:
The stepwise procedure of standard proctor test is given below:
Preparation of specimen:
Compaction test procedure:
 =
=
12. Repeat steps 4 to 11 by taking 2 to 3% more water than preceding test.
13. For all six samples, record the readings and plot moisture content against dry density.
14. Find out dry density corresponding to the maximum point of the curve and corresponding moisture content.
15. This dry density is known as maximum dry density (MDD) and the corresponding water content is known as the optimum moisture content (OMC).
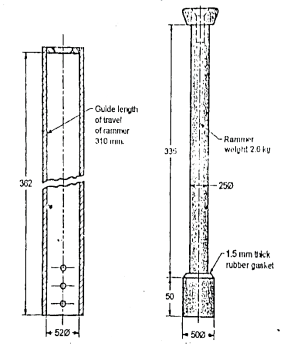
Fig.3.1: Rammer for light compaction for SPT
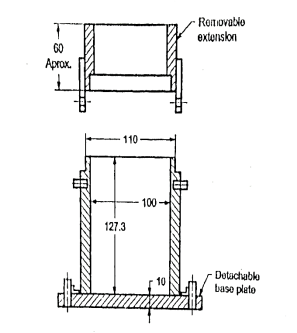
Fig.3.2: Mould for compaction of SPT
Uses of the Test:
Key Takeaways:
3.3.2 Modified Proctor Test:
Sr no. | Feature | Standard proctor test | Modified proctor test |
1 | Weight of hammer. | 2.6 kg | 4.89 kg |
2 | No. of layers in which soil is filled in the mould. | 3 | 5 |
3 | Vertical drop of hammer before striking the soil | 310mm | 450mm |
Key Takeaways:
It is used for situations where heavy compaction is indicated. The test procedure is almost identical except the three factors, viz: number of layers, weight of hammer and the distance through which the hammer falls.
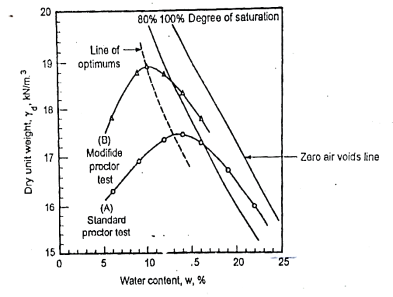
Fig.3.3: Compaction Curve
Following factors affect the compaction of soil and the maximum dry density which can be achieved by compaction:
Type of Soil:
Amount of compaction:
Water content:
Admixtures:
Compressibility:
Water absorption:
Permeability:
Shear strength:
Shrinkage:
Swelling:
Key Takeaways:
Effects of Compaction on soil properties are as follows:
Rolling:
Ramming or Tamping:
Vibration:
Key Takeaways:
Field compaction methods are as follows:
For rolling, following equipment’s are used:
For ramming power rammers are used. These are suitable where access is difficult for rollers. Vibration equipment consists of vibratory plates of 0.5 to 4.5 m coverage and 90 kg weight vibrating at 1600 cycles per minute. Vibratory plates are suitable for coarse grained soils with less cohesion.
Key Takeaways:
Compaction equipment for different types of soil are as follows:
The water content used in the field compaction is called the placement water content. It may be equal to, lower than or higher than the OMC determined in the laboratory. Following table gives examples of different soils in which placement water content is a required to add as mentioned in the table.
Table 3.9.1: Placement water content for different soils
Sr.no. | Type of soil | Placement water content | Remarks |
1 | Cohesive subgrades under pavement | Wet of optimum | Addition of water up to wet of optimum may not exhibit large expansions and swelling pressure on submergence. |
2 | Highway embankment on cohesive soil | Dry of optimum | Addition of water to dry of optimum achieve high strength and resistance to deformation and low volume compressibility. |
3 | High earth dams | 1 to 2.5% less than optimum | It reduces probability of development of high pore pressure |
4 | Impervious cores of earth dams | Wet-side of optimum
| It achieves low permeability, greater safety against cracking due to differential settlements or other causes. |
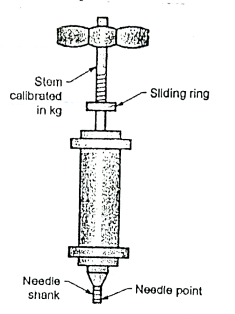
Fig.3.4: Proctor needle
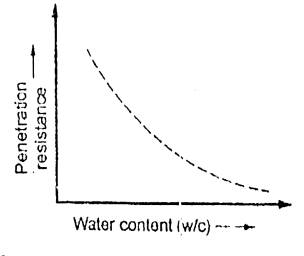
Fig.3.5: Water content against penetration resistance curve
Key Takeaways:
The field compaction control consists of the determination of: (a) water content at which the soil has been compacted (b) Dry density. For proper compaction control, rapid test methods must be used like calcium carbide method and proctor needle method.
Key Takeaways:
The study of stress distribution in soils have many applications to field problems where transmission and distribution of stresses is in large and extensive masses of soil.
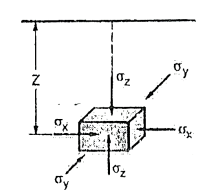
Fig.3.6: Stress Component on soil element
 =
=
 =
=
Where, Y = Unit weight of soil
 = Poisson's ratio
Boussinesq Theory for Point Load:
Assumptions Made by Boussinesq:

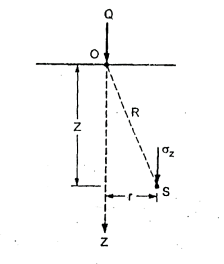
Fig.3.7: Vertical stress due to point load
 =
=
Where r= radial distance of point S from axis of load
 = Vertical stress at point 'S'
R =Polar radial co-ordinate
The above Equation (iii) can be written as
 = KB
= KB where, KB=
KB is Boussinesq's influence factor.
Shear stress at point S due to point load Q is,
Trz= ^5/2
^5/2
The typical values of KB are as follows:
Table: Values of influence factor for r/z ratios
r/z | KB | r/z | KB | r/z | KB |
0.00 | 0.4775 | 0.40 | 0.3294 | 0.80 | 0.1386 |
0.10 | 0.4657 | 0.50 | 0.2733 | 0.90 | 0.1083 |
0.20 | 0.4329 | 0.60 | 0.2214 | 1.00 | 0.0844 |
0.30 | 0.3849 | 0.70 | 0.1762 | 2.00 | 0.0085 |
|
|
|
| 3.00 | 0.0015 |
Boussinesq's Theory for Circular Load:
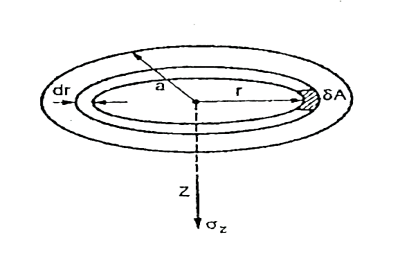
Fig.3.8: Vertical stress on circular area
 =
=
Key Takeaways:
The problem of stress evaluation at a point inside soil mass due to point load acting on the surface of a homogeneous, elastic, isotropic and semi-infinite medium of soil mass has solved by Boussinesq.
Pressure distribution diagram on horizontal plane:
 =
=
Where  =Vertical stress on horizontal plane
Z=Depth from the point of application of load
r=horizontal distance of a point from a point load
Q = point load
Pressure Distribution Diagram on a Vertical Plane:
e.g., Let Q= 150 KN and r=3m
 =
=
Following table gives the values of a, for different depths.
Z(m) |
|
1m | 0.295 |
2m | 0.94 |
3m | 1.407 |
4m | 1.467 |
5m | 1.328 |
6m | 1.1388 |
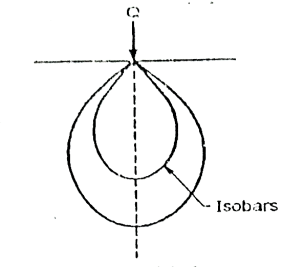
Fig.3.9: Isobar
 =
=
Key Takeaways:
Pressure bulb is a spatial curve which shows the same vertical pressure at all points in a horizontal plane at equal radial distances from the load. This stress isobar is bulb in shape hence it is called as pressure bulb.
Assumptions In Westergaard's theory:
The vertical stress from Fig.
 ^3/2
^3/2
Where ɳ=
 =
= KW
KW
where, Kw is called Westergaard influence factor.
Key Takeaways:
Westergaard’s theory is more suitable for stratified soil layers (i.e., sedimentary deposits).
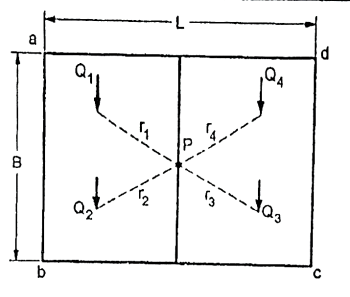
Fig.3.10: Equivalent point load
Q₁ Q2 Q3 Q4 = Load acting on unit areas.
F₁, F2, F3, F4=Radial distances of points of load acting from point P
 =
=
Key Takeaways:
Equivalent point load method is an approximate method to find the vertical stress at any point inside a soil mass due to a uniformly distributed load acting on an area of any shape.
Numerical:
A point load of 800 KN acts at the ground surface. calculate the vertical stress at 9m depth on the axis of the load and at 2m away from the axis. Use Bossinesq’s analysis.
Solution:  =
=
Case 1: Vertical stress on the axis of load
 =
=
 =4.715 KN/m2
Case 2: Vertical stress at point 2m away from the axis
 =
=
 =4.18 KN/m2
References:
