Unit - 5
Project Economics
Introduction
When we say project, it refers to finished work or activity over a period in order to achieve a particular purpose and Economics refers to the branch of knowledge that concerns production, consumption and transfer of wealth. Therefore, Project Economics refers to a method to evaluate economic value that is the return of investment for a particular project. Economic considerations largely determine the project’s desirability and dictate how to deliver.
Definition:
Economics: the branch of knowledge concerned with the production, consumption, and transfer of wealth. Project Economics. A method to evaluate the economic value, i.e., return of investment, of a project.
Principles of Project Economics:
Important in Construction Industry:
There are four basic principles that lay emphasis in construction projects economics:
Construction economics is concerned with the allocation of scarce resources. Many of the resources, which factors productions such as land, labour, capital and enterprise, are limited whereas the wants are more. Therefore, it led to problems comprising of fixed stock of resources against wants. In order to solve these issues a formula was drafted in terms of construction about what investments are made and on behalf of whom the way they are constructed.
The four basic principles that underpin construction projects are
Supply is defined as the total number of goods or service available for purchase. The two key determinants of price are demand and supply. Therefore, viewing the demand, supply is calculated. Other factors affect supply are the price of other related goods.
Example: Paper is made from trees; therefore, a tree would be considered a related good to paper. If the price of harvesting a tree increases, the supply for paper will decrease.

Example if the supply of housing has decreased there would be no point in purchasing a house for refurbishment and selling it on as the demand would decrease. Therefore, when beginning a project, the related supply must be checked and then the project should be started at the estimated time of equilibrium.
b. Demand
Demand is widely used in economics in simple it means that if you desire to own good or service then you should have the ability and willingness to pay. There are several factors that affect demand the main is supply. The other factors that affect demand are
Market
Depending on the type of market there is a construction project can be affected in many ways.
Example: Command economy may be just building houses when needed, they will sell house if they need to be sold, and there is little room for choice.
A free market will build entirely out of will; if it is needed then it will be built. If someone has the desire and the correct funds to build a house, then they will. And if someone wishes to purchase a house, they will agree an amount and pay it off.
Mixed economy is the best of both, however in many circumstances the price for housing price does rise and fall. But anyone person can build at their own will, but they will need planning permission.
Types of Business
Every business structure aim to successful though they serve different purpose. The types of businesses are
Individual owns and runs business on his own without the need of employees. Example: Corner Shop
b. Partnerships:
Two or more people working together to make profit. The partners together own the business and normally share out profits equally between each other. Example: Small/medium sized grocery store.
c. Public limited companies:
It is a limited liability company whose shares may be freely sold and traded to the public. It has a separate legal identity.
Example: NatWest bank
d. Private limited companies:
A private limited company, is a type of privately held small business entity. This type of business entity limits owner liability to their shares, limits the number of shareholders to 50, and restricts shareholders from publicly trading shares.
e. Housing Associations:
A housing association is an organization which owns houses and helps its members to rent or buy them more cheaply than on the open market.
f. Non-Profit Organizations:
Non-profit making organizations tend to help the local area or community and all surpluses are not distrusted but it is put back into the company to help it grow and achieve its goal.
Difference between Cost, Value, Price, Rent, Simple and Compound Interest, Profit, Cash flow Diagram, Annuities and its Types
Cost, Value, Price
Comparison | Value | Cost | Price |
Meaning | Utility of good or service | Amount incurred in producing and manufacturing product | Amount paid for acquiring a product or service |
Estimation | Through Opinion | Through fact | Through policy |
Ascertainment | From User’s Perspective | Producer’s Perspective | Customer’s perspective |
Money | Rarely calculated in terms of money | Calculated in terms of money | Calculated in terms of money |
Impact of Variations in Market | Value remains unchanged | Cost of inputs rise or fall | Price of product increase or decrease. |
Rent
Surplus generated by the supply of any resource (capital, human, natural) over the amount necessary to produce or bring forth the quantity of resources supplied.
Simple and Compound Interest
In Simple Interest, Interest is earned only on Principal amount.
In Compound Interest, Interest is earned on both the principal and accumulated interest of prior periods.
Simple Interest | Compound Interest |
Interest for all years is the same | Interest is different for all years |
Interest on Principal only | Interest is on previous interest and principal amount |
Interest = PTR/100 | Amount = P (1 + R/100) n |
Profit and Annuities
Profit refers to the difference between the purchase price and the costs of bringing to market.
Profit can be classified as
Residue – Imputed charge of owner’s labour and capital may be Tax obligations, Value of balance stock.
Gross Profit- Value of capital equipment added during the periods.
Net Profit- Net profit is calculated by adding up a business’ total expenses, and subtracting that from its revenue.
Annuity is a series of equal payments occurring at equal periods. In certain business dealings equal payments are made at the end of equal period of time.
Kind of annuities
Capital Recovery Annuity:
This is applied in the case of debt payments where the initial debt or capital is recovered in uniform or equal periodic payments.
CRF = (i (1 + i)) n / (1 + i) n -1; i- compound interest rate; n = no of interest period
Present Worth Annuity:
Applied to premium and all other retirements plan hence known as Premium Annuities.
PW = D [(1 + i) n – 1/i(1+i) n]
D = Periodical payment amount
i= Compound interest rate
n= no of interest period.
Sinking Fund
This is applied to define sum required to be called at future date by setting aside equal interval of time so that the equal period payment while earning compound interest total up desired amount at the desired future date.
Sinking fund factor = i/ (1 + i) n -1
i= compound interest rate
n = no of interest period
Compound
The person deposits at the end of number of periods and each amount is allowed to earn compound interest per period. This is used in saving deposit scheme.
Compound Amount annuity = (1 + i) n – 1/ i
i= Compound interest rate
n = no of interest period
Key Takeaways:
Demand
Demand is the quantity of good the buyer wishes to purchase at each conceivable price.
Demand Schedule
A demand schedule is a table that shows the quantity demanded of a good or service at different price levels. A demand schedule is graphed as a continuous demand curve on a chart where the Y-axis represents price and the X-axis represents quantity.
There are two types of Demand Schedules:
Individual Demand Schedule
It depicts the demand of an individual customer for a commodity in relation to its price.
For example
Price per unit of commodity X (Px) | Quantity demanded of commodity X (Dx) |
100 | 50 |
200 | 40 |
300 | 30 |
400 | 20 |
500 | 10 |
The above schedule depicts the individual demand schedule. We observe that when the price is ₹100, its demand is 50 units and when its price is ₹500, its demand decreases to 10 units.
Market Demand Schedule
The summation of the individual demand schedules and depicts the demand of different customers for a commodity in relation to its price.
Example
Price per unit of commodity X (Px) | Quantity demanded by Consumer A(Qa) | Quantity demanded by Consumer B(Qb) | Market Demand (Qa + Qb) |
100 | 50 | 70 | 120 |
200 | 40 | 60 | 100 |
300 | 30 | 50 | 80 |
400 | 20 | 40 | 60 |
500 | 10 | 30 | 40 |
Law of Demand
The law of demand describes the relationship between the quantity demanded and the price of a product.
It states that the demand for a product decreases with increase in its price and vice versa, while other factors are at constant.
Therefore, there is an inverse relationship between the price and quantity demanded of a product.
“The amount demanded increases with a fall in price and diminishes with a rise in price”-Marshall.
Price is an independent variable while demand is a dependent variable.
D = f(P)
Demand is the function price where
D= demand
P=price
F= functional relationship
In the law of demand, other factors expect price should be kept constant where is demand is subject to various influences.
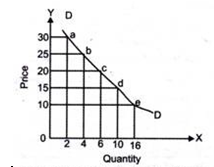
Demand Curve:
R.G Lipsey has defined demand curve as “the curve which shows the relationship between the price of a commodity and the amount of that commodity the consumer wishes to purchase is called Demand Curve.”
Demand curve can be of two types
Price of A (per kg) | Quantity Demanded (per week in kgs) |
10 | 15 |
15 | 10 |
20 | 8 |
25 | 4 |
30 | 2 |
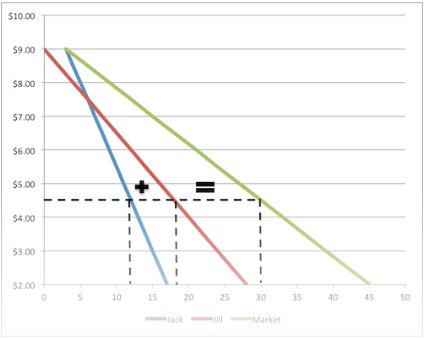
Market Demand Curve
Q = f(P) = q1 + q2 + ……... + qn.
Price | Jack | Jill | Market |
$2.00 | 17 | 28 | 45 |
$2.50 | 16 | 26 | 42 |
$3.0 | 15 | 24 | 39 |
$3.50 | 14 | 22 | 36 |
$4.00 | 13 | 20 | 33 |
$4.50 | 12 | 18 | 30 |
$5.0 | 11 | 16 | 27 |
$5.50 | 10 | 14 | 24 |
$6.0 | 9 | 12 | 21 |
Here red represents Jill
Blue represents Jack
Green represents Market.
Elasticity of demand is the responsiveness of the quantity demanded of a commodity to changes in one of the variables on which demand depends.
It is the percentage change in quantity demanded divided by the percentage in one of the variables on which demand depends.
Types of Elasticity of Demand
Based on the variable that affects the demand, the elasticity of demand is of the following types.
Price Elasticity
The price elasticity of demand is the response of the quantity demanded to change in the price of a commodity. It is measured as a percentage change in the quantity demanded divided by the percentage change in price. Therefore,
Ep = Change in quantity x Original Price
Original quantity Change in Price
Cross Elasticity
The cross elasticity of demand of a commodity X for another commodity Y, is the change in demand of commodity X due to a change in the price of commodity Y.
Ec = cross-elasticity
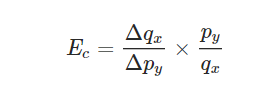 = change in original price of commodity y.
Supply Schedule
The law of supply states that when the price of commodity falls its
The Law of Supply states that when the price of a commodity falls, its supply also decreases and when the price of a commodity rises, its supply also increases with other things remaining constant. Supply refers to the amount of quantity that a firm is willing to produce or offer for sale in the market.
Supply schedule is defined as a relation between the price of goods or services versus and the number of goods supplied. The price elasticity of demand is the response of the quantity demanded to change in the price of a commodity
Elasticity of demand is the responsiveness of the quantity demanded of a commodity to changes in one of the variables on which demand depends
The cross elasticity of demand of a commodity X for another commodity Y, is the change in demand of commodity X due to a change in the price of commodity Y.
The Law of Supply states that when the price of a commodity falls, its supply also decreases and when the price of a commodity rises, its supply also increases with other things remaining constant.
Supply schedule is defined as a relation between the price of goods or services
Individual Supply Schedule
A supply schedule depicts the supply by an individual firm or producer of a commodity in relation to its price
Price per unit commodity X | Quantity supplied of commodity X |
100 | 1000 |
200 | 2000 |
300 | 3000 |
400 | 4000 |
500 | 5000 |
The above schedule depicts the individual supply schedule. We can see that when the price of the commodity is ₹100, its supply is 1000 units. Similarly, when its price is ₹500, its supply increases to 5000 units.
Market Supply Schedule
It is a summation of the individual supply schedules and depicts the supply of different customers for a commodity in relation to its price.
Example.
Price per unit of commodity X | Quantity supplied by firm A | Quantity supplied by firm B | Market Supply Qa + Qb |
100 | 1000 | 3000 | 4000 |
200 | 2000 | 4000 | 6000 |
300 | 3000 | 5000 | 8000 |
400 | 4000 | 6000 | 10000 |
500 | 5000 | 7000 | 12000 |
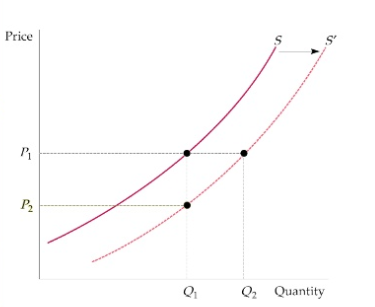
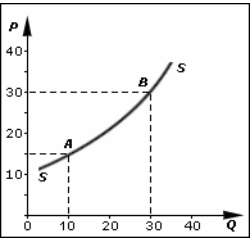
Supply Curve

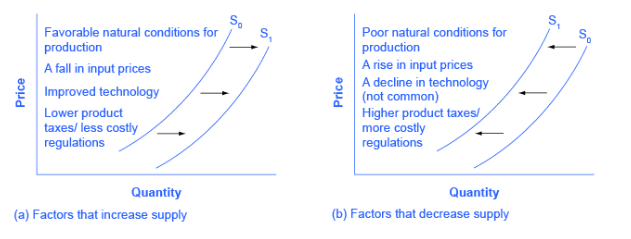
A rightward shift indicates a positive effect on the curve whereas a leftward shift indicates a negative effect on the supply curve.
Elasticity of Supply Equilibrium
The price elasticity of supply is the percentage change in quantity supplied divided by the percentage change in price. Elasticity can be usefully divided into five broad categories:
perfectly elastic, elastic, perfectly inelastic, inelastic, and unitary.
An elastic demand or elastic supply is one in which the elasticity is greater than one, indicating a high responsiveness to changes in price.
An inelastic demand or inelastic supply is one in which elasticity is less than one, indicating low responsiveness to price changes.
Unitary elasticity indicates proportional responsiveness of either demand or supply.
Perfectly elastic and perfectly inelastic refer to the two extremes of elasticity. Perfectly elastic means the response to price is complete and infinite: a change in price results in the quantity falling to zero. Perfectly inelastic means that there is no change in quantity at all when price changes.
Key Takeaways:
9. The Law of Supply states that when the price of a commodity falls, its supply also decreases and when
10. the price of a commodity rises, its supply also increases with other things remaining constant.
11. Supply schedule is defined as a relation between the price of goods or services versus and the number of goods supplied.
12. Elasticity of demand is the responsiveness of the quantity demanded of a commodity to changes in one of the variables on which demand depends.
13. The supply curve is the locus of all the points showing various quantities of a commodity that a producer is willing to sell at various levels of prices, during a given period of time, assuming no change in other factors.
14. The price elasticity of supply is the percentage change in quantity supplied divided by the percentage change in price
15. Perfectly elastic means the response to price is complete and infinite: a change in price results in the quantity falling to zero.
16. Perfectly inelastic means that there is no change in quantity at all when price changes
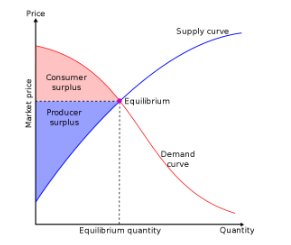
Equilibrium Price
Equilibrium Amount
Equilibrium amount is when there is no shortage or excess of a product in the market. Supply and demand overlap, meaning the amount of an item consumers want to buy equals the amount supplied by their manufacturers. In other words, the market has reached a perfect equilibrium as prices stabilize to accommodate all parties.
Basic microeconomic theory provides a model for determining the optimal quantity and price of an honest or service. This theory is based on the supply and demand model, which is the fundamental foundation for market capitalism. It is assumed that producers and consumers behave predictably and consistently and that no other factors influence their decisions.
Factors affecting Price Determination
Main factors affecting price determination of product are:
1. Product cost
It refers to the total of fixed costs, variable costs and semi variable costs incurred during the production, distribution and selling of the product. Fixed costs are those costs which remain fixed at all the levels of production or sales. For example, rent of building, salary, etc. Variable costs refer to the costs which are directly related to the levels of production or sales. For example, costs of raw material, labour costs etc. Semi variable costs are those which change with the level of activity but not in direct proportion. For example, fixed salary of Rs 12,000 + up to 6% graded commission on increase in volume of sales. The price for a commodity is determined on the basis of the total cost. So sometimes, while entering a new market or launching a new product, business firm has to keep its price below the cost level but in the long rim, it is necessary for a firm to cover more than its total cost if it wants to survive amidst cut-throat competition.
2.The Utility and Demand:
Usually, consumers demand more units of a product when its price is low and vice versa.
However, when the demand for a product is elastic, little variation in the price may result in large changes in quantity demanded.
In case of inelastic demand, a change in the prices does not affect the demand significantly.
Thus, a firm can charge higher profits in case of inelastic demand. Moreover, the buyer is ready to pay up to that point where he perceives utility from product to be at least equal to price paid. Thus, both utility and demand for a product affect its price.
3. Extent of Competition in the Market:
The next important factor affecting the price for a product is the nature and degree of competition in the market.
A firm can fix any price for its product if the degree of competition is low.
However, when the level of competition is very high, the price of a product is determined on the basis of price of competitors’ products, their features and quality etc.
For example, MRF Tyre company cannot fix the prices of its Tyres without considering the prices of Bridgestone Tyre Company, Goodyear Tyre company etc.
4. Government and Legal Regulations:
The firms which have monopoly in the market, usually charge high price for their products. In order to protect the interest of the public, the government intervenes and regulates the prices of the commodities for this purpose; it declares some products as essential products for example. Life saving drugs etc.
5. Pricing Objectives:
(a) Profit Maximisation:
Usually, the objective of any business is to maximise the profit. During short run, a firm can earn maximum profit by charging high price. However, during long run, a firm reduces price per unit to capture bigger share of the market and hence earn high profits through increased sales.
(b) Obtaining Market Share Leadership:
If the firm’s objective is to obtain a big market share, it keeps the price per unit low so that there is an increase in sales.
(c) Surviving in a Competitive Market:
If a firm is not able to face the competition and is finding difficulties in surviving, it may resort to free offer, discount or may try to liquidate its stock even at BOP (Best Obtainable Price).
(d) Attaining Product Quality Leadership:
Generally, firm charges higher prices to cover high quality and high cost if it’s backed by above objective.
6. Marketing Methods Used:
The various marketing methods such as distribution system, quality of salesmen, advertising, type of packaging, customer services, etc. also affect the price of a product. For example, a firm will charge high profit if it is using expensive material for packing its product.
Law of Diminishing Marginal Utility
This is an important law under Marginal Utility Analysis. Alfred Marshall, British Economist defines the law of diminishing marginal utility as follows:
“The additional benefit which a person derives from a given increase in the stock of a thing diminishes with every increase in the stock that he already has.”
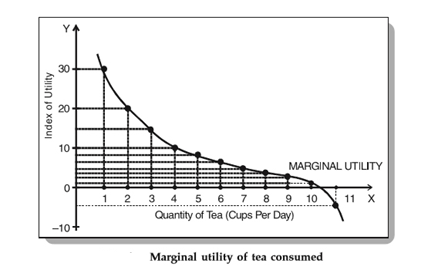
This law is based on the fundamental tendency of human nature. Human wants are virtually unlimited. However, every single want is satiable. Hence, as we consume more and more units of a good, the intensity of our want for the good decreases. Eventually, it reaches a point where we no longer want it.
An Illustration
Example. The table below presents the total and marginal utility derived by Peter from consuming cups of tea per day.
Quantity of teas | Total Utility | Marginal Utility |
1 | 30 | 30 |
2 | 50 | 20 |
3 | 65 | 15 |
4 | 75 | 10 |
5 | 83 | 8 |
6 | 89 | 6 |
7 | 93 | 4 |
8 | 96 | 3 |
9 | 98 | 2 |
10 | 99 | 0 |
11 | 95 | -4 |
As seen in the table above, when Peter consumes one cup of tea in a day, he derives a total utility of 30 utils (unit of utility) and a marginal utility of 30 utils. When he takes two cups per day, the total utility rises to 50 utils but the marginal utility falls to 20. This trend continues until the last row where the marginal utility is negative. This means that if Peter consumes 11 or more cups of tea per day, then he might fall sick
Relationship between Total and Marginal utility
This law helps us understand how a consumer reaches equilibrium in case of a single commodity.
A consumer utilizes a commodity until its marginal utility becomes equal to the market price.
This ensures that he derives maximum satisfaction by being in equilibrium in respect of the quantity of the commodity.
In case of a fall in the price of the commodity, the equality between marginal utility and price gets disturbed.
Therefore, the consumer will consume more units of the good leading to a fall in the marginal
Limitations of the Law
The law of diminishing marginal utility applies only under certain assumptions:
Law of Substitution
Law of substitution was propounded by famous economist HH Gossen. Therefore, it is called as Gossen’s second law. But it was fully developed by Alfred Marshall.
According to Marshall “If a person has a thing which he can put to several uses, he will distribute it among these uses in such a way that it has the same marginal utility in all”
Human wants are unlimited but resources are limited. For this purpose, he/she has to spend limited budget for purchasing more than one commodity in a way to obtain maximum utility from all. The commodity consumer is able to gain maximum satisfaction when marginal utility is derived from all commodity becomes equal.
The equi-marginal principle is based on the law of diminishing marginal utility.
The equi-marginal principle states that a consumer will be maximizing his total utility when he allocates his fixed money income in such a way that the utility derived from the last unit of money spent on each good is equal.
Suppose a man purchases two goods X and Y whose prices are PX and PY, respectively. As he purchases more of X, his MUX declines while MUY rises. Only at the margin the last unit of money spent on X has the same utility as the last unit of money spent on Y and the person thereby maximizes his satisfaction.
This condition for a consumer to maximize utility is usually written in the following form:
MUX/PX = MUY/PY
So long as MUY/PY is higher than MUX/PX, the consumer will go on substituting Y for X until the marginal utilities of both X and Y are equalized.
This equi-marginal principle or the law of substitution can be explained in terms of an arithmetical example.
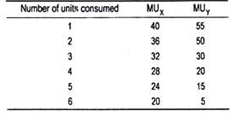
In Table we have shown marginal utility schedule of X and Y from the different units consumed. Let us also assume that prices of X and Y are Rs. 4 and Rs. 5, respectively.
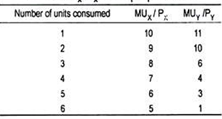
MUX and MUY schedules show diminishing marginal utilities for both goods X and Y from the different units consumed. Dividing MUX and MUY by their respective prices we obtain weighted marginal utility or marginal utility of money expenditure. This has been shown in Table below
MUX/PX and MUY/PY are equal to 6 when 5 units of X and 3 units of Y are purchased. By purchasing these combinations of X and Y, the consumer spends his entire money income of Rs. 35 (= Rs. 4 x 5 + Rs. 5 x 3) and, thus, gets maximum satisfaction [10 + 9 + 8 + 7 + 6] + [11 + 10 + 6] = 67 units. Purchase of any other combination other than this involves lower volume of satisfaction.
Graphical Representation:
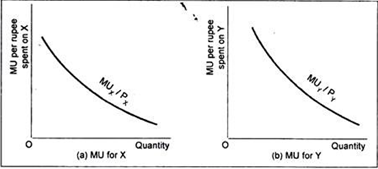
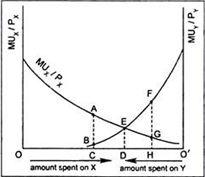
The above principle can also be illustrated in terms of a figure. We have drawn marginal utility curves for goods X and Y in Figures.
Marginal utility per rupee spent on good X = MUX/PX, and that of Y = MUY/PY. The MUX/PX curve has been shown in Figures.
Now, by superimposing figures we get equi-marginal principle where we measure available income OO’ of the consumer on the horizontal axis.
Equi-marginal principle
As we move rightwards from ‘O’, amount spent on X increases and, as we move leftwards from ‘O’, amount spent on Y increases. Our consumer maximizes his total utility by spending OD amount on good X and O’D amount on good Y. By purchasing this combination, the consumer equalizes marginal utilities per rupee spent on X and Y at point E (i.e., MUX/PX = MUY/PY = ED). If our consumer spends OC on good X and O’C on good Y then MUX/PX will exceed MUY/ PY by the distance AB. This will induce the consumer to buy more of X and less of Y. As a result, MUX/PX will fall, while MUY/PY will rise until equality is restored at point E.
Similarly, if the consumer spends OH on X and O’H on Y then MUX/PX< MUY/PY. Now, the consumer will buy more of Y and less of This substitution between X and Y will continue until MUX/PX= MUY/PY.
Therefore, the consumer can derive maximum satisfaction only when marginal utility per rupee spent on good X is the same as the marginal utility per rupee spent on another good Y. When this condition is met, the consumer does not find any interest in changing his expenditure pattern.
The equilibrium condition can now be rewritten as:
MUX/PX= MUY/PY
This equation can, however, be rearranged in the following form:
MUX/MUY = PX/PY
This equation states that a consumer reaches equilibrium when he equalizes the ratio of marginal utilities of both goods with the price ratio.
However, this equilibrium condition can be extended to ‘n’ number of commodities.
For ‘n’ number of commodities, the equilibrium condition is:
MUA/PA= MUB/PB= MUC/PC = ……… = MUn/Pn
Limitations:
This law of substitution has been criticized on the following grounds:
Key Takeaways:
2. Equilibrium amount is when there is no shortage or excess of a product in the market
3. Main factors affecting price determination of product are: Product Cost, The Utility and Demand, Extent of Competition in the Market, Government and Legal Regulations, Pricing Objectives, Marketing Methods.
4. This is an important law under Marginal Utility Analysis. Alfred Marshall, British Economist defines the law of diminishing marginal utility as follows:
5. “The additional benefit which a person derives from a given increase in the stock of a thing diminishes with every increase in the stock that he already has.”
6. Relationship between Total and Marginal utility
7. Law of substitution was propounded by famous economist HH Gossen. Therefore, it is called as Gossen’s second law. But it was fully developed by Alfred Marshall.
Concept of Cost Capital
An investor provides long-term funds (i.e., Equity shares, Preference Shares, retained earnings, Debentures etc.) to a company and quite naturally he expects a good return on his investment.
Cost of capital depends upon:
(a) Demand and supply of capital,
(b) Expected rate of inflation,
(c) Various risk involved, and
(d) Debt-equity ratio of the firm etc.
Measurement of Cost of Capital:
Cost of capital is measured for different sources of capital structure of a firm that includes cost of debenture, cost of loan capital, cost of equity share capital, cost of preference share capital, cost of retained earnings etc.
Cost of Debentures:
The capital structure of a firm normally includes the debt capital. Debt may be in the form of debentures bonds, term loans from financial institutions and banks etc. The amount of interest payable for issuing debenture is considered to be the cost of debenture or debt capital (Kd).
Cost of debt capital is much cheaper than the cost of capital raised from other sources, because interest paid on debt capital is tax deductible.
The cost of debenture is calculated in the following ways:
When the debentures are issued and redeemable at par:
Kd = r (1 – t)
where Kd = Cost of debenture
r = Fixed interest rate
t = Tax rate
When debenture is issued at a premium or discount but redeemable then
Kd = I/NP (1 – t)
Kd= cost of debenture
I=Annual interest payment
t= tax rate
Np= net proceeds from issues of debenture.
When the debentures are redeemable at a premium or discount and are redeemable after ‘n’ period:
Kd = I(1-t) +1/N (Rv – NP) / ½ (RV – NP)
where Kd = Cost of debenture.
I = Annual interest payment
t = Tax rate
NP = Net proceeds from the issue of debentures
Ry = Redeemable value of debenture at the time of maturity
Example 1:
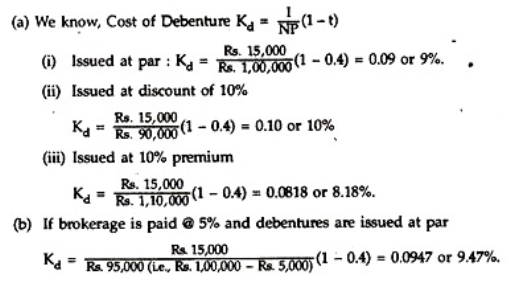
A company issues Rs. 1,00,000, 15% Debentures of Rs. 100 each. The company is in 40% tax bracket. You are required to compute the cost of debt after tax, if debentures are issued at (i) Par, (ii) 10% discount, and (iii) 10% premium.
If brokerage is paid at 5%, what will be the cost of debentures if issue is at par?
Cost of Preference Share Capital:
For preference shares, the dividend rate can be considered as its cost, since it is this amount which the company wants to pay against the preference shares. Like debentures, the issue expenses or the discount/premium on issue/redemption are also to be taken into account.
(i) The cost of preference shares (KP) = DP / NP
Where, DP = Preference dividend per share
NP = Net proceeds from the issue of preference shares.
(ii) If the preference shares are redeemable after a period of ‘n’, the cost of preference shares (KP) will be:
where NP = Net proceeds from the issue of preference shares
RV = Net amount required for redemption of preference shares
DP = Annual dividend amount.
There is no tax advantage for cost of preference shares, as its dividend is not allowed deduction from income for income tax purposes.
Example:
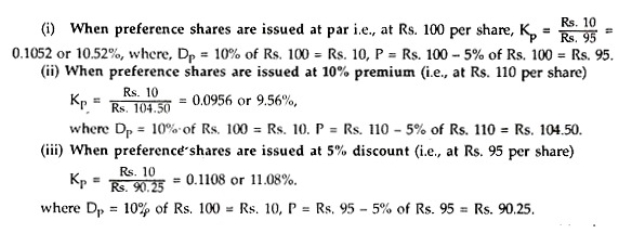
A company issues 10% Preference shares of the face value of Rs. 100 each. Floatation costs are estimated at 5% of the expected sale price.
What will be the cost of preference share capital (KP), if preference shares are issued (i) at par, (ii) at 10% premium and (iii) at 5% discount? Ignore dividend tax.
Solution:
We know, cost of preference share capital (KP) = DP/P
Cost of Equity or Ordinary Shares:
The funds required for a project may be raised by the issue of equity shares which are of permanent nature. These funds need not be repayable during the lifetime of the organization. Cost of equity share is calculated by considering the earnings of the company, market value of the shares, dividend per share and the growth rate of dividend or earnings.
(i) Dividend/Price Ratio Method:
The cost of equity share capital is computed on the basis of the present value of the expected future stream of dividends.
Thus, the cost of equity share capital (Ke) is measured by:
Ke = where D = Dividend per share
P = Current market price per share.
If dividends are expected to grow at a constant rate of ‘g’ then cost of equity share capital
(Ke) will be Ke = D/P + g.
This method is suitable for those entities where growth rate in dividend is relatively stable.
Example:
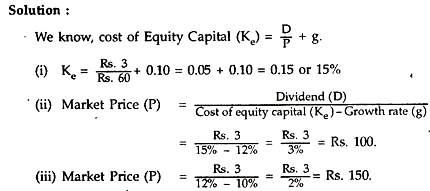
XY Company’s share is currently quoted in market at Rs. 60. It pays a dividend of Rs. 3 per share and investors expect a growth rate of 10% per year.
You are required to calculate:
(i) The company’s cost of equity capital.
(ii) The indicated market price per share, if anticipated growth rate is 12%.
(iii) The market price, if the company’s cost of equity capital is 12%, anticipated growth rate is 10% p.a., and dividend of Rs. 3 per share is to be maintained.
Earnings/Price Ratio Method:
The cost of equity share capital will be based upon the expected rate of earnings of a company. The argument is that each investor expects a certain amount of earnings whether distributed or not, from the company in whose shares he invests.
If the earnings are not distributed as dividends, it is kept in the retained earnings and it causes future growth in the earnings of the company as well as the increase in market price of the share.
Thus, the cost of equity capital (Ke) is measured by:
Ke = E/P where E = Current earnings per share
P = Market price per share.
If the future earnings per share will grow at a constant rate ‘g’ then cost of equity share capital (Ke) will be
Ke = E/P+ g.
This method is similar to dividend/price method. These costs are to be adjusted with the current market price of the share at the time of computing cost of equity share capital since the full market value per share cannot be realised. So, the market price per share will be adjusted by (1 – f) where ‘f’ stands for the rate of floatation cost.
Thus, using the Earnings growth model the cost of equity share capital will be:
Ke = E / P (1 – f) + g
Example
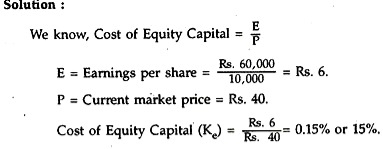
The share capital of a company is represented by 10,000 Equity Shares of Rs. 10 each, fully paid. The current market price of the share is Rs. 40. Earnings available to the equity shareholders amount to Rs. 60,000 at the end of a period.
Calculate the cost of equity share capital using Earning/Price ratio.
Cost of Retained Earnings:
When earnings are retained in the business, shareholders are forced to forego dividends. The dividends forgone by the equity shareholders are, in fact, an opportunity cost. Thus, retained earnings involve opportunity cost.
If earnings are not retained, they are passed on to the equity shareholders who, in turn, invest the same in new equity shares and earn a return on it. In such a case, the cost of retained earnings (Kr) would be adjusted by the personal tax rate and applicable brokerage, commission etc. if any.

However, if the cost of equity share capital is computed on the basis of dividend growth model (i.e., D/P + g), a separate cost of retained earnings need not be computed since the cost of retained earnings is automatically included in the cost of equity share capital.
Therefore, Kr = Ke = D/P + g.
Example:
It is given that the cost of equity of a company is 20%, marginal tax rate of the shareholders is 30% and the Broker’s Commission is 2% of the investment in share. The company proposes to utilise its retained earnings to the extent of Rs. 6,00,000.
Find out the cost of retained earnings.

Overall or Weighted Average Cost of Capital:
When all these costs of different forms of long-term funds are weighted by their relative proportions to get overall cost of capital it is termed as weighted average cost of capital. It is also known as composite cost of capital. While taking financial decisions, the weighted or composite cost of capital is considered.
Time Value of Money
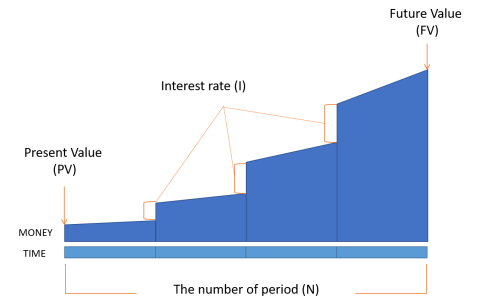
It is the idea that money that is available at the present time is worth more than the same amount in the future, due to its potential earning capacity.
This core principle of finance holds that provided money can earn interest, any amount of money is worth more the sooner it is received.
One of the most fundamental concepts in finance is that money has a time value attached to it.
In simpler terms, it would be safe to say that a dollar was worth more yesterday than today and a dollar today is worth more than a dollar tomorrow.
That is
Future Money = Present Money + Time
There are five (5) variables that you need to know:
Sources on Project Finances
Concepts of Debt Capital
Debt Capital is a capital that a business raises by taking out a loan. It is a loan paid to a company that is normally repaid at some future day. It differs from equity or share capital. Debt capital become the creditors and not the owners because the debit capital receives a fixed annual percentage to turn on their loan.
The debt capital market team works closely with companies and financial sponsors to originate, structure and execute debt financings such as
Equity Shares
The Equity Capital refers to that portion of the organization’s capital, which is raised in exchange for the share of ownership in the company. These shares are called the equity shares.
The equity shareholders are the owners of the company who have significant control over its management. They enjoy the rewards and bear the risk of ownership. However, their liability is limited to the amount of their capital contributions. The Equity Capital is also called as the share capital or equity financing.
Advantages:
Disadvantages:
Types of Capital
Fixed Capital
The expression ‘fixed capital’ often considered to be analogous to ‘fixed assets’ denotes the employment of capital in permanent assets and other non-current assets. The fixed assets are assets of a permanent nature that the business does not intend to dispose of, or that could not be disposed of without interfering with the operation of the business.
The fixed assets include land, buildings, plant, machinery and other fixed equipment, furniture and fixtures, vehicles, livestock etc.
The investment in the fixed assets is the first initial step in establishing a corporation. The investment in non-current assets is also called fixed capital. Such assets include items in which capital is locked up for a long period.
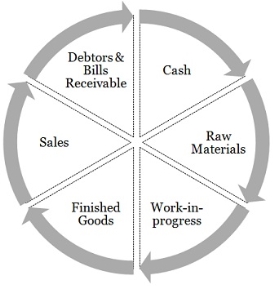
Working Capital
Working capital can be understood as the capital needed by the firm to finance current assets. It represents the funds available to the enterprise to finance regular operations, i.e., day to day business activities, effectively. It is helpful in gauging the operating liquidity of the company, i.e., how efficiently the company is able to cover the short-term debt with short-term assets. It can be calculated as:
Working Capital = Current Assets – Current Liabilities
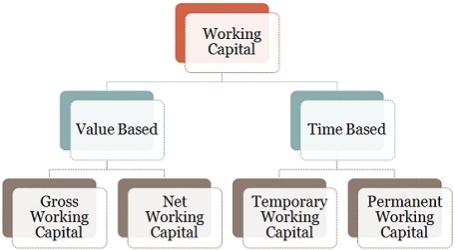
Types of Working Capital
Working Capital Cycle
Equity Shares
Equity shares are also known as ordinary shares. They are the form of fractional or part ownership in which the shareholder, as a fractional owner, takes the maximum business risk. The holders of Equity shares are members of the company and have voting rights. Equity shares are the vital source for raising long-term capital.
Equity shares represent the ownership of a company and capital raised by the issue of such shares is known as ownership capital or owner’s funds. They are the foundation for the creation of a company.
Merits
Limitations
Debenture Capital
They are very crucial for raising long-term debt capital. A company can raise funds through the issue of debentures, which has a fixed rate of interest on it.
The debenture issued by a company is an acknowledgment that the company has borrowed an amount of money from the public, which it promises to repay at a future date. Debenture holders are, therefore, creditors of the company.
Advantages
Investors who want fixed income at lesser risk prefer them.
As a debenture does not carry voting rights, financing through them does not dilute control of equity shareholders on management.
Financing through them is less costly as compared to the cost of preference or equity capital as the interest payment on debentures is tax deductible.
The company does not involve its profits in a debenture.
The issue of debentures is appropriate in the situation when the sales and earnings are relatively stable.
Disadvantages
Each company has certain borrowing capacity. With the issue of debentures, the capacity of a company to further borrow funds reduces.
With redeemable debenture, the company has to make provisions for repayment on the specified date, even during periods of financial strain on the company.
Debenture put a permanent burden on the earnings of a company. Therefore, there is a greater risk when the earnings of the company fluctuate.
Key Takeaways:
References:
1. Project Economics and Decision Analysis by M.A Mian
2. Project Finance in Theory and Practice by Steffano Gatti
3. Foreign Direct Investment and Policies by Theodore Moran
