Unit - 6
Project Appraisal
Project Appraisal
- Project Appraisal is a consistent process of reviewing a given project and evaluating its content to approve or reject the project.
- By analyzing the problem or need to be addressed by the project, generating solution options for solving the problem.
- Selecting the most feasible option, conducting a feasibility analysis of that option, creating the solution statement, and identifying all people and organizations concerned with or affected by the project and its expected outcomes.
- It is an attempt to justify the project through analysis, which is a way to determine project feasibility and cost-effectiveness.
Various PM methodologies use various approaches and techniques for developing a project appraisal.
Step #1. Concept Analysis
- To conduct a range of analyses in order to determine the concept of the future project and provide the Decision Package for the senior management (project sponsors) for approval.
- To carry out the problem-solution analysis that determines the problem/need to be addressed and the solution used to handle the problem.
- The solution should analyzed by cost-effectiveness and feasibility (various project appraisal methods and techniques can be used).
- Identify stakeholders (those people and organizations involved in or affected by the problem and/or solution) and analyze their needs (how they relate to the problem and/or solution).
- After all, you must develop a decision package that includes the problem statement, the solution proposal, the stakeholder list, and the funding request. This package will then be submitted to the sponsor for approval (or rejection).
- If the sponsor approves the project concept, then you can proceed to the next step.
Step #2. Concept Brief
- Develop a summary of the project concept to define the goals, objectives, broad scope, time duration and projected costs.
- This data is used to develop the Concept Brief.
- Develop a project statement document that specifies the project mission, goals, objectives and vision.
- Create a broad scope statement that specifies the boundaries, deliverables ad requirements of your endeavor.
- Finally, make a preliminary schedule template that determines an estimated duration of the project
- Develop a cost projection document based on cost estimates and calculations.
Step #3. Project Organization
- Determine an organizational structure of the project
- This structure should be developed and explained in the Project Organizational Chart.
- The document covers such issues as governance structure (roles and responsibilities), team requirements and composition, implementation approach, performance measures, other info.
- The idea behind the Project Organizational Chart is to create a visual representation of the roles, responsibilities and their relationships and what people/organizations are assigned to what roles and duties within the project.
Step #4. Project Approval
- The final stage requires you to review all the previous steps and gather them into a single document called the Project Appraisal.
- This document summarizes all the estimations and evaluations made, to justify the project concept and verify that the proposed solution addresses the identified problem.
- The financial, the cost-effectiveness and the feasibility analyses will serve as the methods of project appraisal to approve the project.
- The document is must be submitted to the snooper stakeholders (the customer, the sponsor) for review and approval.
- If the appraisal is approved, then the project steps to the next phase, the planning.
Types of Appraisals
Political Appraisal:
Three perceptual dimensions frame appraisee’s perception of appraisal politics (APAP)
- First is appraiser's manipulation of ratings to achieve their self-serving ends such as own reputation, maintaining good relationships, building in-groups, and handling dependency threats from appraises.
- Second dimension constitutes fellow appraises' upward influence behaviors to get higher ratings and rewards.
- Third dimension relates to the outcome of appraisal, i.e., pay and promotion decisions that can be discriminatory when performance is ignored.
- Such actions are detrimental for good performers and performance culture. Drawing from the organizational justice theories, it is proposed that those appraisal-related structural (e.g., criteria), process (e.g., voice) and contextual antecedents (e.g., relation with appraiser) that enhance appraisee’s perceived control, understanding, and prediction of appraisal decision and process can mitigate APAP.
Social
Social appraisal processes provide clients with information about the outcomes of programs and actions that they have implemented.
Facilitating improved strategies to deliver cost effective benefits for businesses and communities.
Strong technical capabilities and ability to work as part of an integrated team of that are adaptable and flexible in meeting the clients’ needs.
The Social Appraisal, monitoring and evaluation programs assist our clients with the right information to appreciate and benchmark:
- Changing demographics and institutional contexts;
- Community perceptions of all aspects of the project;
- Current emerging issues and impacts;
- The most effective management and enhancement programs, based on regional, national and international evidence;
- Business performance in a social and environmental sense.
Environmental
Environmental appraisal is the process of identifying opportunities and threats the organization faces.
Factors affecting environmental Appraisal
- Strategist related factors: Since strategist play a central role in formulation of strategies such as age, education, experience, motivation, cognitive styles, ability to withstand, responsibility have an impact to the extent in which they are able to appraise the environment.
- Organizational factors: Characteristics of the organization, which affect the environment, are nature of business, age, size, complexity, nature of market, product or service that it provides.
- Environment factors: The nature of environment faced by the organization determines how appraisal could be applied.
Economical
- The project aspects highlighted include requirements for raw material, level of capacity utilization, anticipated sales, anticipated expenses and the probable profits.
- A business should have always a volume of profit clearly in view which will govern other economic variables like sales, purchases, expenses and alike.
- It has to be calculated on how much sales would be necessary to earn the targeted profit.
- The demand for the product will be estimated for anticipating sales volume.
- Therefore, demand for the product needs to be carefully spelled out to a great extent on the deciding factor of feasibility of the project.
Financial
Finance is one of the most important pre-requisites to establish an enterprise. It is finance only that facilitates an entrepreneur to bring together the labour of one, machine of another and raw material of yet another to combine them to produce goods.
In order to adjudge the financial viability of the project, the following aspects need to be carefully analysed:
Assessment of the financial requirements both – fixed capital and working capital
Knowing that fixed capital normally called ‘fixed assets’ are those tangible and material facilities which can be purchased once and used again and again. Land and buildings, plants and machinery, and equipment’s are the familiar examples of fixed assets/fixed capital.
But, while assessing the fixed capital requirements, all items relating to the asset like the cost of the asset, architect and engineer’s fees, electrification and installation charges (which normally come to 10 per cent of the value of machinery), depreciation, pre-operation expenses of trial runs, etc., should be duly taken into consideration.
If any expense is to be incurred in remodeling, repair and additions of buildings should also be highlighted in the project report.
In accounting, working capital means excess of current assets over current liabilities. Generally, 2: 1 is considered as the optimum current ratio.
Market Analysis:
Before the production actually starts, the entrepreneur needs to anticipate the possible market for the product. He/she has to anticipate who will be the possible customers for his product and where and when his product will be sold.
Thus, knowing the anticipated market for the product to be produced becomes an important element in every business plan.
Key Takeaways:
- Project Appraisal is a consistent process of reviewing a given project and evaluating its content to approve or reject the project.
- Types of Appraisals are Political Appraisal, social, environmental, Techno legal, Economical and Financial.
- Social appraisal processes provide clients with information about the outcomes of programs and actions that they have implemented.
- Environmental appraisal is the process of identifying opportunities and threats the organization faces
- A business should have always a volume of profit clearly in view which will govern other economic variables like sales, purchases, expenses and alike
- Finance is one of the most important pre-requisites to establish an enterprise
Criteria for Project Selection
There are various project selection methods practiced by modern business organizations. The methods contain different features and characteristics. Therefore, each selection method is applicable according to the need of the organization.
There are many differences in project selection methods but the concepts and principles remain the same.
For our consideration let us browse through two methods
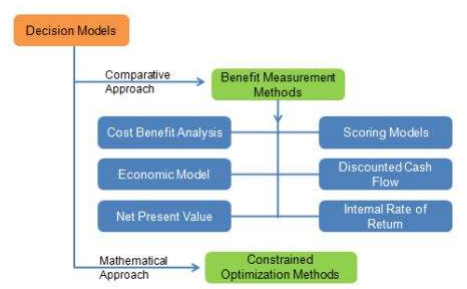
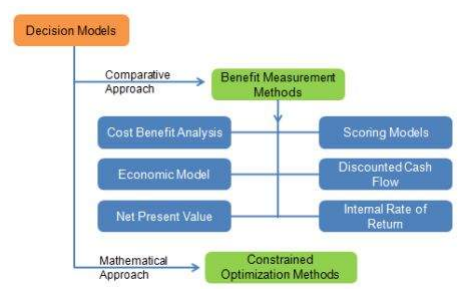
- The value of one project needs to be compared against the other projects in order to use the benefit measurement methods. This could include various techniques but common is: You and your team could come up with certain criteria that you want your ideal project objectives to meet.
- Then give each project scores based on how they rate in each of these criteria and then choose the project with the highest score.
- When it comes to the Discounted Cash flow method, the future value of a project is ascertained by considering the present value and the interest earned on the money.
- The higher the present value of the project, the better it would be for your organization.
- The rate of return received from the money is what is known as the IRR.
- The mathematical approach is commonly used for larger projects. The constrained optimization methods require several calculations in order to decide on whether or not a project should be rejected.
- Cost-benefit analysis is used by several organizations to assist them to make their selections. In this method consider all the positive aspects of the project which are the benefits and then deduct the negative aspects from the benefits. Based on the results choose the option that would be most viable and financially rewarding.
Benefit and Cost Analysis
These benefits and costs have to be carefully considered and quantified in order to arrive at a proper conclusion. Questions that you may want to consider asking in the selection process are:
- Would this decision help me to increase organizational value in the long run?
- How long will the equipment last for?
- Would I be able to cut down on costs as I go along?
- In addition to these methods, choose the opportunity cost –
- When choosing any project, keep in mind the profits that need to made if you decide to go ahead with the project. Profit optimization is therefore the ultimate goal.
NPV
Net present value (NPV) is the difference between the present value of cash inflows and the present value of cash outflows over a period of time. NPV is used in capital budgeting and investment planning to analyze the profitability of a projected investment or project.
The following formula is used to calculate NPV:

Where
Rt= Net cash inflows-outflows during a single period t.
I= Discount rate or return that could be calculated in alternative installments.
t=number of time periods
NPV=TVECF−TVIC
Where:
TVECF=Today’s value of the expected cash flows
TVIC=Today’s value of invested cash
IRR
The internal rate of return (IRR) is a metric used in capital budgeting to estimate the profitability of potential investments. The internal rate of return is a discount rate that makes the net present value (NPV) of all cash flows from a particular project equal to zero. IRR calculations rely on the same formula as NPV does.
Formula and Calculation for IRR
It is important for a business to look at the IRR as the plan for future growth and expansion. The formula and calculation used to determine this figure follows.

Ct = net cash flow during period t.
C0 = total investment cost
IRR = initial rate of return
T = number of periods.
The internal rate of return allows investments to be analyzed for profitability by calculating the expected growth rate of an investment’s returns and is expressed as a percentage.
Internal rate of return is calculated such that the net present value of an investment yields zero, and therefore allows the comparison of the performance of unique investments over varying periods of time
Modified internal rate of return allows the comparison of the fund when different rates are calculated for the initial investment and the capital cost of reinvestment which often differ.
Calculating IRR in Excel
There are two ways to calculate IRR in Excel:
- Using one of the three built-in IRR formulas
- Breaking out the component cash flows and calculating each step individually, then using those calculations as inputs to an IRR formula—as we detailed above, since the IRR is a derivation, there is no easy way to break it out by hand
The second method is preferable because financial modeling works best when it is transparent, detailed, and easy to audit. The trouble with piling all the calculations into a formula is that you can't easily see what numbers go where, or what numbers are user inputs or hard-coded.
Payback Period
Payback period is the time required to recover the initial cost of an investment.
It is the number of years it would take to get back the initial investment made for a project.
Therefore, as a technique of capital budgeting, the payback period will be used to compare projects and derive the number of years it takes to get back the initial investment.
The project with the least number of years usually is selected.
Features
- It ignores the time value of money. All other techniques of capital budgeting consider the concept of time value of money. Time value of money means that a rupee today is more valuable than a rupee tomorrow. So other techniques discount the future inflows and arrive at discounted flows.
- It is used in combination with other techniques of capital budgeting. Owing to its simplicity the payback period cannot be the only technique used for deciding the project to be selected.
Illustrations
Let us understand the payback period method with a few illustrations.
Apple Limited has two project options. The initial investment in both the projects is Rs. 10,00,000.
Project A has even inflow of Rs. 1,00,000 every year.
Project B has uneven cash flows as follows:
Year 1 – Rs. 2,00,000
Year 2 – Rs. 3,00,000
Year 3 – Rs. 4,00,000
Year 4 – Rs. 1,00,000
Now let us apply the payback period method to both the projects.
The formula for computing payback period with even cashflows is:
Project A
If we use the formula, Initial investment / Net annual cash inflows then:
10,00,000/ 1,00,000 = 10 years
Project B
Total inflows = 10,00,000 (2,00,000+ 3,00,000+ 4,00,000+ 1,00,000)
Total outflows = 10,00,000
Project B takes four years to get back the initial investment.
Now, let us modify the cash flows of project B and see how to get the payback period:
Say, cash inflows are –
Year 1 – Rs. 2,00,000
Year 2 – Rs. 3,00,000
Year 3 – Rs. 7,00,000
Year 4 – Rs. 1,50,000
The payback period can be calculated as follows:
Year | Total Flow (in Lakhs) | Cumulative flow |
0 | (10) | (10) |
1 | 2 | (8) |
2 | 3 | (5) |
3 | 7 | 2 |
4 | 1.5 | 3.5 |
Now to find out the payback period:
Step 1: We must pick the year in which the outflows have become positive. In other words, the year with the last negative outflow has to be selected. So, in this case, it will be year two.
Step 2: Divide the total cumulative flow in the year in which the cash flows became positive by the total flow of the consecutive year.
So that is: 5/7 = 0.71
Step 3: Step 1 + Step 2 = The payback period is 2.71 years.
Therefore, between Project A and B, solely on the payback method, Project B (in both the examples) will be selected.
The example stated above is a very simple presentation. In an actual scenario, an investment might not generate returns for the first few years. Gradually over time, it might generate returns. That too will play a major role in determining the payback period.
Advantages
- Payback period is very simple to calculate.
- It can be a measure of risk inherent in a project. Since cash flows that occur later in a project's life are considered more uncertain, payback period provides an indication of how certain the project cash inflows are.
- For companies facing liquidity problems, it provides a good ranking of projects that would return money early.
Disadvantages
- Payback period does not take into account the time value of money which is a serious drawback since it can lead to wrong decisions. A variation of payback method that attempts to address this drawback is called discounted payback period method.
- It does not take into account, the cash flows that occur after the payback period. This means that a project having very good cash inflows but beyond its payback period may be ignored.
Break even Analysis
- A break-even analysis is a financial tool, which helps you to determine at what stage your company, or a new service or a product, will be profitable.
- It’s a financial calculation for determining the number of products or services a company should sell to cover its costs (particularly fixed costs).
- Break-even is a situation where you are neither making money nor losing money, but all your costs have been covered.
- Break-even analysis is useful in studying the relation between the variable cost, fixed cost and revenue.
Components
Fixed costs
Fixed costs also called as the overhead cost. These overhead costs occur after the decision to start an economic activity is taken and these costs are directly related to the level of production, but not the quantity of production.
Fixed costs include (but are not limited to) interest, taxes, salaries, rent, depreciation costs, labour costs, energy costs etc.
These costs are fixed no matter how much you sell.
Variable costs
Variable costs are costs that will increase or decrease in direct relation to the production volume.
These costs include cost of raw material, packaging cost, fuel and other costs that are directly related to the production.
Calculation
The basic formula for break-even analysis is calculated by dividing the total fixed costs of production by the contribution per unit.
Contribution per unit = selling price per unit – variable cost per unit.
Breakeven point in quantity (BEP) = FC / Contribution per unit or FC/(P-VC)
Benefits:
- Set revenue targets: Once the break-even analysis is complete, you will get to know how much you need to sell to be profitable. This will help you and your sales team to set more concrete sales goals.
- Make smarter decisions: Entrepreneurs often take decisions in relation to their business based on emotion. Emotion is important i.e., how you feel, though it’s not enough. In order to be a successful entrepreneur, your decisions should be based on facts.
- Fund your business: This analysis is a key component in any business plan. In order to fund your business, you have to prove that your plan is viable. Furthermore, if the analysis looks good, you will be comfortable enough to take the burden of various ways of financing.
- Better Pricing: Finding the break-even point will help in pricing the products better. This tool is highly used for providing the best price of a product that can fetch maximum profit without increasing the existing price.
- Cover fixed costs: Doing a break-even analysis helps in covering all fixed cost.
Key Takeaways:
- There are many differences in project selection methods but the concepts and principles remain the same.
- The higher the present value of the project, the better it would be for your organization
- The benefits and costs have to be carefully considered and quantified in order to arrive at a proper conclusion.
- Net present value (NPV) is the difference between the present value of cash inflows and the present value of cash outflows over a period of time.
- NPV is used in capital budgeting and investment planning to analyze the profitability of a projected investment or project.
- The internal rate of return (IRR) is a metric used in capital budgeting to estimate the profitability of potential investments. The internal rate of return is a discount rate that makes the net present value (NPV) of all cash flows from a particular project equal to zero
- Payback period is the time required to recover the initial cost of an investment
- A break-even analysis is a financial tool, which helps you to determine at what stage your company, or a new service or a product, will be profitable
- Variable costs are costs that will increase or decrease in direct relation to the production volume.
Study of Project Feasibility report
- Feasibility study is one of the key activities within the project initiation phase.
- It aims to analyze and justify the project in terms of technical feasibility, business viability and cost-effectiveness.
- The study serves as a way to prove the project’s reasonability and justify the need for launch.
- Once the study is done, a feasibility study report (FSR) should be developed to summarize the activity and state if the particular project is realistic and practical.
Definition
A Feasibility Study Report (FSR) is a formally documented output of feasibility study that summarizes results of the analysis and evaluations conducted to review the proposed solution and investigate project alternatives for the purpose of identifying if the project is really feasible, cost-effective and profitable. It describes and supports the most feasible solution applicable to the project.
The report gives a brief description of the project and some background information.
Importance
The process to write the report is called feasibility study reporting. Often it is a responsibility of the project manager to control such a process. The importance of writing the report consists in providing legal and technical evidence of the project’s vitality, sustainability and cost-effectiveness. The reporting process allows the senior management to get the necessary information required for making key decisions on budgeting and investment planning.
A well-written feasibility study report template lets develop solutions for:
- Project Analysis because an example of FSR helps link project efficiency to budgeted costs.
- Risk Mitigation because it helps with contingency planning and risk treatment strategy development.
- Staff Training because the report can be used by senior management to identify staffing needs as well as acquire and train necessary specialists.
The process of reporting is the trigger to run the project investing process through underpinning the business case document, stating the reasons for undertaking the project, and analyzing project costs and benefits.
Steps
Regardless of project size, scope and type, there are several key steps to writing such an important document.
- Write Project Description
At this step, you need to collect background information on your project to write the description.
Example, your company needs to increase online sales and promote your products/services on the Web. Then in the first part of your report you could write the next description:
“This project is website development to promote the products/services in Internet and increase online sales through encouraging customers to visit the website and make online bargains.”
2. Describe Possible Solutions
In order to take this step to write a feasibility study report template, you’ll need to perform an alternatives analysis and make a description of possible solutions for your project.
Example, in your FSR template your e-commence project might have the following solutions description:
“This project can be undertaken by the implementation of the two possible solutions: 1) Online Shop; 2) Corporate Website. Each of the solutions is carefully analyzed, and necessary information required for making the final decision is available for the management team.”
3. List Evaluation Criteria
This step of feasibility study report writing requires you to investigate the solutions and put them against a set of evaluation criteria.
Example, you could add the following criteria to your report:
“The possible solutions of this project are evaluated and compared by the following criteria: 1) Concept Spec.; 2) Content Audit; 3) Technical Design Spec.; 4) Launch Schedule & Time-frames.”
4. Propose the Most Feasible Solution
Once the criteria are used to evaluate the solutions, your next step for writing a feasibility study report is to determine the most economically reasonable and technically feasible solution which lets the company 1) keep to optimal use of project resources and 2) gain the best possible benefit.
For example, your report might include:
“After the evaluation of the possible solutions, the most feasible solution for this project is identified and selected, so the project turns to be cost-effective, vital and practical.”
5. Write Conclusion
The final step of the feasibility study reporting process requires you to make a conclusion by summarizing the project’s aim and stating the most feasible solution.
For example, the conclusion of your FSR might be:
“This project’s purpose is to develop a sophisticated and original design of the website that will contribute to online sales increasing, attract the target customer’s attention, and be cost-effective. The most feasible solution for the project has been chosen and approved and now is ready for further elaboration.”
Content Requirements
The content of sample feasibility report is formatted and structured according to a range of requirements which may vary from organization to organization.
Front Matter
To begin with writing a sample feasibility report, first you need to create a title page that provides a descriptive yet concise title, your (i.e., author’s) name, email, job position, and also the organization for which you’re writing the report. Next, you must include an itemized list of contents that provides headings and sub-headings sequenced the same way as they are structured in the report body. Also add a list of all material (tables, figures, illustrations, annexes) used within the doc. Remember that the title page shouldn’t be numbered and that no more than 4-5 pages should be dedicated to the front matter.
Report Body Format
Because there are many different styles and requirements for formatting the body of feasibility study report, it may be difficult for you to select right format for your report, so I suggest you discuss this issue with your curator or supervisor who should provide you with right styling and format requirements.
Meanwhile, there are several common suggestions as follows:
- Each page of the report body needs to include a descriptive header with an abbreviated title for the report, the author’s name and page number (at the right top)
- Structure the report by headings and sub-headings and indicate this structure within the document content.
- Make sure headings are properly formatted (i.e., flush left, indented, etc.) on each page.
- Use the same style for headings throughout the entire report template.
- Never use too larger or too small font (font should have a professional look, 10-12 point)
- Use the same citation style (e.g., CBE, APA, etc.) for formatting sources used in your feasibility study template
Report Template Sections
The following list provides an outline of the key sections to be included in report content:
- Executive Summary – a description of the problem/opportunity highlighted in the study, the purpose of the report, and the importance of the research for your target audience.
- Background – a more detailed description of the feasibility study, who it was carried out, and whether it was implemented elsewhere
- Analysis – an examination and evaluation method employed in the conducting your feasibility study
- Alternatives and Options – an overview of any alternative proposals or options and their features in comparison to the main proposal of the study
- Cost-Benefit Evaluation – a rigorous analysis method that was implemented to examine and evaluate the main proposal for cost-benefit effectiveness and to demonstrate the tech feasibility, economic practicality, social desirability, and eco soundness of the proposal.
- Conclusion – a summary of the work done and your own conclusions regarding your analysis
- Recommendations – a series of recommendations practices and follow-up actions based on your conclusions
Back Matter
One last thing you need to consider when writing your feasibility study report template is that the report should include a
Reference page that lists all reference material (articles, books, web pages, periodicals, reports, etc.) cited in your document. This page should be styled appropriately.
Create an Appendix page that provides detailed discussions of all criteria used in analyzing feasibility and examples of each criterion. This page should also be styled appropriately.
Detailed Project Report
As the identification and intention for the implementation of the project grow, the depth of the study for the probable project increases. Further analyses of the details relevant to such a project become imperative.
We know that the feasibility report contains sufficient detailed information. It is from the study of the pre-feasibility or feasibility report that approval is made by the project owner (an individual or a project director/manager or the management of a company) for the investment on the project or for a request to prepare the DPR.
Preparation of DPR is a costly and time-taking job (which may even extend to one year) when reports of specialists from different streams like market research, engineering (civil, mechanical, metallurgical, electrical, electronics), finance etc.—as relevant to the project itself—are considered in the DPR.
Objectives
The objectives in preparation of the DPR should ensure that:
(a) the report should be with sufficient details to indicate the possible fate of the project when implemented.
(b) the report should meet the questions raised during the project appraisals, i.e., the various types of analyses—be it financial, economic, technical, social etc.—should also be taken care of in the DPR.
Background
The background should also include details of the product, sizes with capacity, organization and the technical know-how involved:
Project at a glance
Market Report
Technical Details
Plant and Machinery
Project Schedule
Organization
Cost and Sources of Finance
Let us consider these aspects with an example
Background:
A. Organisation
A Greenfield project to be launched by Indian promoters in partnership with a foreign company renowned in the relevant business along with their equity participation and a representation in the company’s board.
B. Product:
Manufacture of products Q, R, S etc. are mainly used in the medical field. These products are not currently manufactured in India, except one or two units with quality reportedly inferior to international standard. Hence, there is a need and opportunity felt by the promoters, as the project is favourable for the saving of foreign exchange.
C. Technical know-how:
The expertise, along with the supply of the major plant and machineries, are to be provided by the foreign partner, who is well experienced in this field.
The required training of key personnel will also be provided by the collaborator.
The concerned authorities have approved the participation in equity by the foreign company and the terms of the ‘know-how agreement’.
The collaborator is ready to buy-back the entire production, but it has been agreed that about 20% of the total production will be marketed in India. In view of this, the company has been identified as an Export Oriented Unit (EOU).
2. Project at a Glance:
A. Product:
Q, R, S etc. for Medical Instruments.
B. Capacity:
35,000 pcs per annum.
C. Production:

D.Sales:
In lakhs of Rs. 360 600 900 1,200 1,350
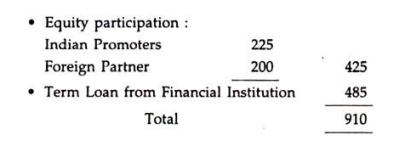
E. Source of financing
Market Research on the Product:
The special report indicates:
a. Expected volume of the market and its growth;
b. Expected volume of the market share;
c. The possible marketing channels and the need for the specific background of the dealers;
d. The dealers’ expectation about their commission, discounts etc.;
e. The credit period to be extended to the dealers, major customers etc., the prevailing market trend in this area;
f. The requirement of service after sales;
g. The behavioral pattern of the ultimate customers and their reaction to the availability of such products. (This is a delicate area and depends upon the sectors of the customers to whom the product is addressed housewives, executives, professionals, doctors etc. In the project under discussion, the customers are primarily the doctors who are interested in the usage of the Q, R, S etc. for medical instruments 
h. The competitors, their strength and weakness and their market share.
4. Technical Details:
The details of the products include:
A. Products:
i. ‘Q’: There are strands of high purity element with cylindrical inner core with high refractive index. The outer shell is called cladding with comparative lower refractive index, the light rays propagating within the core of the fibre is reflected back into the core.
The fibre dia. Varies between x microns to y microns and, as such, can work as flexible light cables.
Ii. ‘R’: This is used to transmit light through flexible cables.
Iii. ‘S’: This is ideal for usage as an accessory for surgical microscope in Ophthalmia, Gynecology, Plastic and Neuro-surgery etc. where temperature is a critical factor.
B. Manufacturing process:
Fiber drawing:
The fibers are drawn from the element which is melted in a furnace. The process draws continuous length of fiber from the melting element whose softening temperature is lower than that of quartz; then the fibers are wound in large drums.
The other operations to follow include:
i. Fiber cleaning and washing;
Ii. Fiber laying and cutting;
Iii. Sheathing;
Iv. End fitting;
v. Epoxy curing;
Vi. Grinding and polishing; and
Vii. Quality inspection.
(Similar description of the process for the manufacturing of R and S are narrated in the DPR.)
C. Plant layout:
The project report includes a diagram of the plant layout taking care of:
i. The suggestions from the building architect.
Ii. The site, the plant drawings with the locations of the machineries, center for power house, the power connections.
Iii. The process work flow, taking care of the flow of the materials, manufacturing process and delivery to the finished goods store.
Iv. The passage for the inward delivery of the raw materials, their receipts, incoming equality inspections etc. should not cross the passage-for outward delivery of the finished goods. Similarly, within the manufacturing area, the production process centers follow the serial order of the production processes, with facilities for issue of the raw materials to the relevant process centre, their movements without disturbing other process centres.
There should be scope of ‘quality inspection’ in the stages of production process. The layout should take care of the delivery of the finished goods to the finished goods store with least disturbance of other movements within the production floor.
The basic idea of the layout should also take care of:
i. The required space per head for direct workers;
Ii. Movement of materials and men should be without interruption;
Iii. Convenience to supervise with a clear overview for the plant manager;
Iv. Utilities including toilets, canteen, first-aid room, rest room etc.; and
v. Security aspect.
5. Plant and Machinery:
The plant and machinery required for the project include:
i. Drawing Tower;
Ii. Grinding and Polishing Machine;
Iii. Diamond Wheel Saw/Cut-off Saw;
Iv. Epoxy Curing Oven;
v. Electrolytic Etching Machine and
Vi. Optometer.
The auxiliary service equipment includes:
i. Power requirements for the plant;
Ii. Utilities: water for the manufacturing process, air-washing plant;
Iii. Equipment for maintenance workshop and
Iv. Requirements for Pollution Control.
6. Project Schedule:
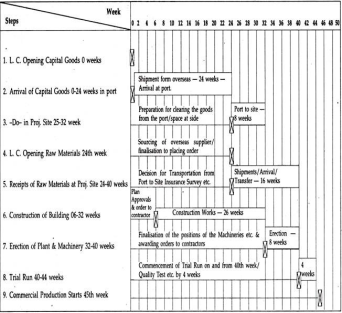
The project report should have complete details of the estimated time schedule for the implementation of the project from the start till the final ‘trial run’ i.e., just before the start of commercial production. The essential main steps for the implementation are listed in serial order of such steps. Such steps are then chronologically arranged along with the estimated time to complete the works involved in each step.
While the actual step is to be taken at a certain point of time—whenever the situation permits—the necessary preparatory work should be carried out earlier so that the step can be taken in time.
For example, before a placement of order to an overseas supplier and opening of the necessary Letter of Credit (LC), the preparatory works include:
a. Establishment of the specification of the materials to be ordered along with its qualities;
b. Enquiries and their responses from different suppliers;
c. The time schedule required for deliveries;
d. The final payment terms;
e. The quality and the replacements in case of defectives/damages;
f. The insurance coverage;
g. The arbitration, in case of disputes etc.
Similarly, the appointments of senior personnel such as Production Manager, Supervisor, technical hands, finance and administration, personnel, security etc. must precede the appointment of Directs and Indirect in the plant.
The Project Schedule with work packages in project implementation and time plan is presented as per the following bar chart:
Considerable amount of work is involved in procurement of materials from overseas, placing order with the delivery schedule, opening of letter of credit etc. including:
a. Quality of material available from different suppliers;
b. Time schedule required by suppliers for delivery;
c. Competitive prices, taking care of cost, insurance freight and inland transportation;
d. Replacement in case of defectives/damages, the relevant terms in this regard;
e. Arbitration in case of dispute.
Besides the preparatory works necessary before the start of every major step as illustrated, there are also innumerable types of work involved in the business of starting a project, which may not be possible to describe in the Bar Chart.
For example, before recruitment, it is desirable to decide the ‘personnel policy’, the various grades, the market rates and the rates and scales to be offered.
The Project Schedule helps the management to review the progress and, thus, control the implementation while reviewing the actual progress against the schedule/budget.
Even the ‘possible delay’ is analysed and all means explored to avoid the delay and maintain the time schedule.
This is so important in every project implementation that the Project Manager maintains chart in his office showing the actual process as compared to the budgeted schedule, continuously updating the progress with the passage of time.
7. Organisation:
Considering the detailed volume of activities in Production, Selling, Administration and other support services, e.g., Procurements, Personnel, Maintenance etc., man-power requirements at different grades/levels like Manager, Supervisor, Skilled, Semi-skilled, Unskilled and other work-forces are estimated for each functional group.
Pay scales for different grades should be ascertained and clearly defined to avoid anomalies/disputes in future. Recruitments should be planned in accordance with the strength of work-force required as per the volume of activities forecasted in stages.
8. Project Costs and Source of Finance:
[The project report should contain the salient features of the project costs as per the major heads of accounts.]
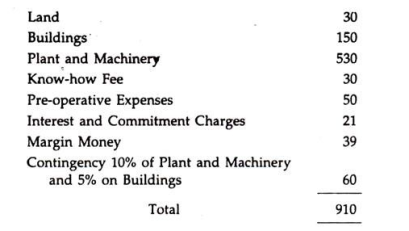
The project costs of Rs. 9:1 crores are detailed as follows:
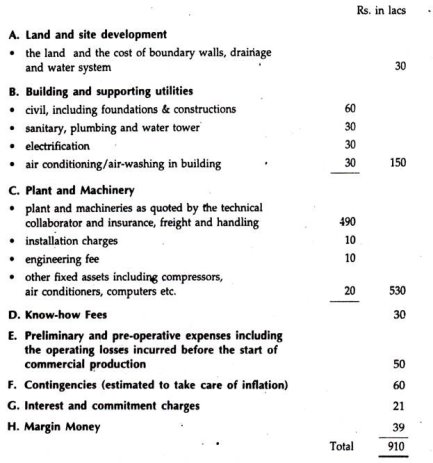
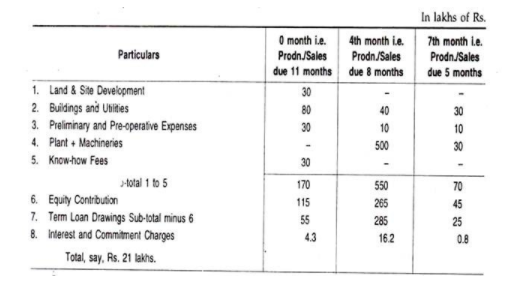
The project costs are codified and summarised along with the sourcing of the fund required for the project:
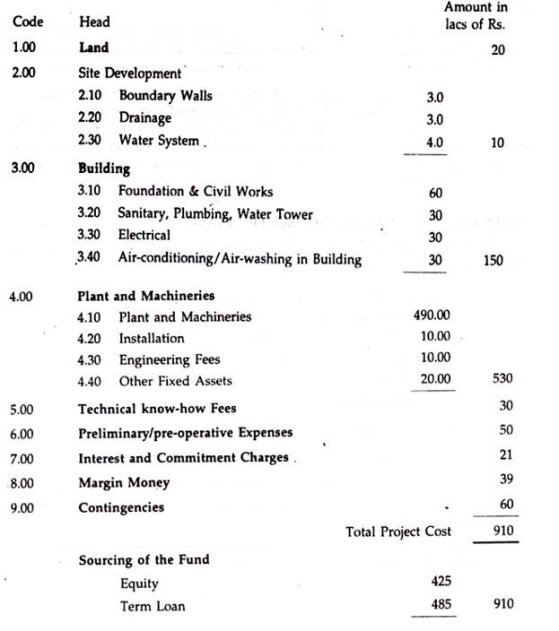
Cost of production:
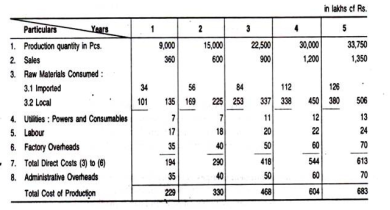
The DPR deals with the financial estimates of the project operation for five to eight years from the start of the commercial production. We have dealt with such estimates for five years. The report shows under this head the details of the cost of production depending upon the envisaged volume of activities.
The estimated cost of production for initial five years is shown in the following table:
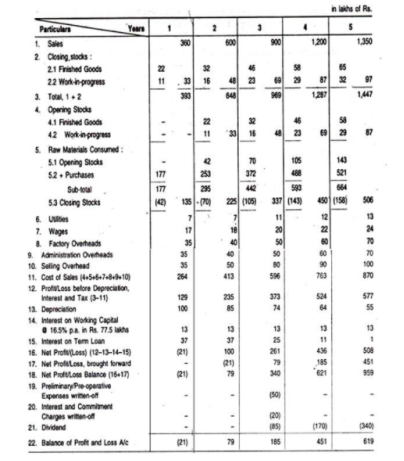
Profit and loss account:
Balance sheet at the end of the year
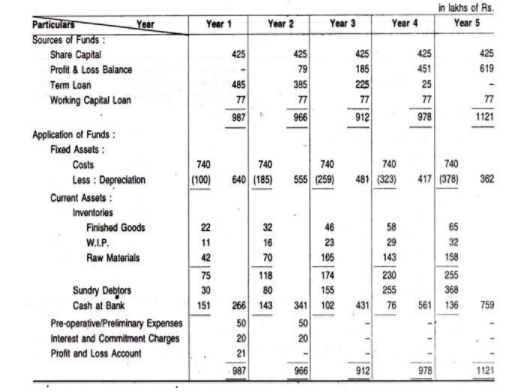
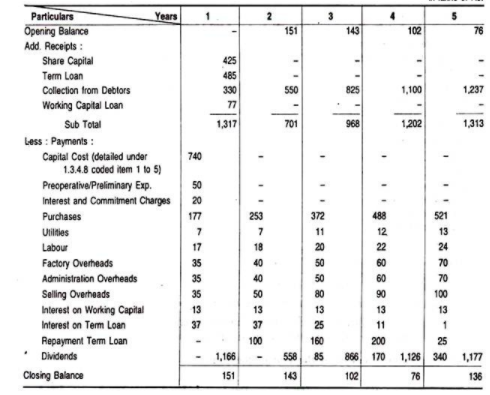
Fund flow
Interest and commitment charges
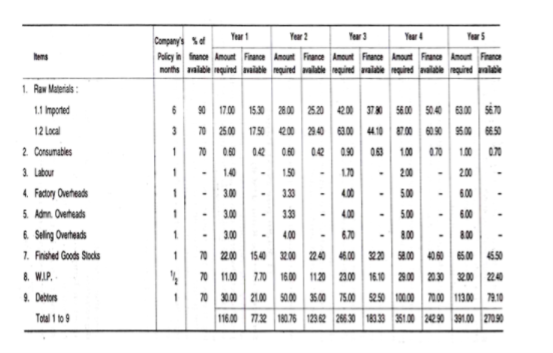
Working Capital
The working capital represents the net current assets, i.e., the Current Assets less the Current Liabilities and, as such, generally includes: Inventories for Raw Materials, Finished Goods, W.I.P.; Debtors (less creditors); Overheads for 1 to 2 month(s).
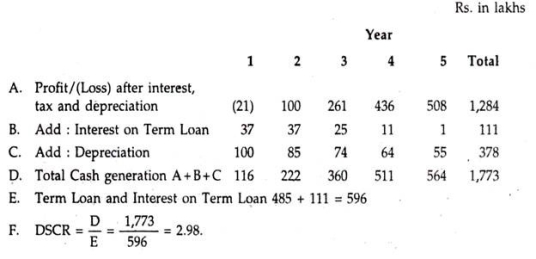
Debt service coverage ratio (DSCR):
The DPR also shows the capability of the project to serve the borrowings for its implementation.
DSCR is also important to indicate the liquidity position of the project, i.e., generating not just the profit margin, but sufficient surplus cash to service the lenders, the shareholders (in the form of dividends).
Break-even analysis:
The DPR shows a detailed calculation to indicate the level of activities (with the projected figures), when the organisation breaks even. We know that the excess of sales over the variable costs is called the ‘contribution’, that is, the contribution towards the company’s fixed costs and the contribution in excess of the fixed costs represents the profit margin.
The components of the total cost are analysed to (1) the fixed cost and (2) the variable cost. As the company’s activities are not stabilised during the initial years the break-even level is worked out from the details of the projected Profit and Loss Account of the third year. The Break-even analysis of the DPR is shown hereinafter.
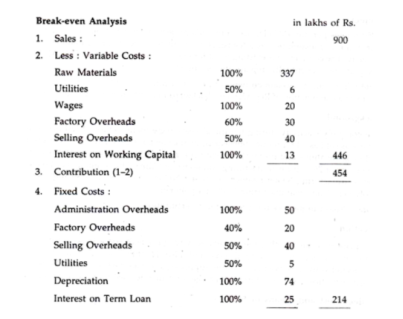
Illustration on ‘offer document’:
A. Project:
1,350 tonnes per day (MTPD) new ammonia project. Ammonia from this plant will be used for in-house consumption as a feedstock for fertilizers already being manufactured by the company. The company has existing plant for manufacturing ammonia of 950 MTPD and the new plant will, eventually, replace the old plant.
B. Background:
The company’s activity during the initial years was manufacture of fertilizers, while ammonia was sold as a by-product. Subsequently, the company diversified to other products like Nylon-6, Melamine and promoted a joint venture (with State Government share of 26% and own share of 25%) for manufacturing Ammonia and Urea.
The company has taken over one unit manufacturing Nylon Filament Yarn and Nylon Chips and another unit, which is now ‘Polymers Unit’, manufacturing 5,000 tpa polymers.
C. Location:
The plant is located within the present activity site where space is no constraint. The suppliers of the feedstock, Natural Gas and also Naphtha are also located in the neighbourhood with all convenience for the supply of raw materials and, being housed with the present activities, the finished product can be conveniently used for captive consumption.
D. Project cost and means of finance:
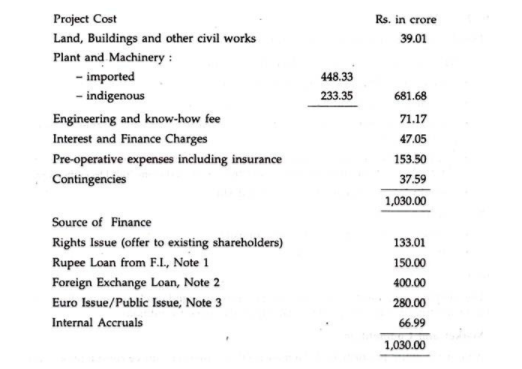
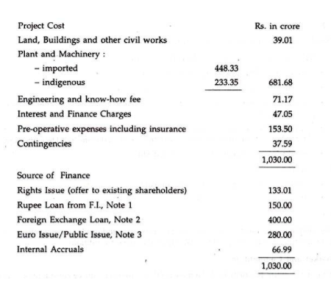
The company’s project was initially appraised by IDBI in 1994 with the estimated project cost of Rs. 750 crores. Initially, the raw materials envisaged for the project was natural gas. However, to enable the project, to have a greater flexibility, changes were made in the equipment design, drawing etc. for the use of naphtha as an alternate feedstock.
This change along with the increase in the Customs Duty etc. duty to change in rupee parity raise caused a revision of the project cost finalised at Rs. 1,030 crores as detailed below:
E. Market and competition:
Almost the entire production of Ammonia will be used for captive consumption. Part will be used for production of Urea. Various other players in the industry have also announced capacity expansion in Ammonia and Urea.
As per report on the fertilizer industry (December 1995) demand for Urea in India is expected to increase from 16.4 million tonnes in 1994 to 20.8 million tonnes in 2000 A.D. India would continue to be one of the largest importers of Urea with around 4.9 million tonnes of imports till 2000 A.D.
F. Capacity:
The capacity utilisation of the new Ammonia Plant for four years after the commercial production from October 1997 is estimated as
Year 1 80%
Year 2 90%
Year 3 95%
Year 4 95%
G. Technology arrangements:
Agreements for technology involved with the technical contractors and the process licensors have been finalised as follows:
1. Engineering contractors:
ABC of Germany a leading company in the field of engineering and contracting, material handling, refrigeration and industrial gases. The company will offer licence, know-how, basic engineering and design, training and expatriate services for detailed engineering.
2. Licence:
Process 1: From BCD of Germany with a fee of DM 8, 40,000; Process 2: From CDE of Switzerland with a fee of DM 1.149.999;
The total licence fee of DM 1.989.999 will be paid as:
i. 5% upon effective date of contract;
Ii. 28% upon disbursement of loan agreement;
Iii. 33% upon 5 months from the date of contract or on completion of basic engineering, whichever is later;
Iv. 34% upon acceptance of the plant, at latest 39 months from the effective date of contract.
H. Production process:
The generation of pure ammonia synthesis gas is achieved by adding nitrogen to the pure hydrogen produced.
The process plant is divided into the following sections:
i. Naphtha storage—pre-treatment;
Ii. Natural gas compression;
Iii. Generation of hydrogen and purification;
Iv. Ammonia synthesis based on ‘Casale’ process; and
v. Refrigeration.
I. Raw materials:
The process technology selected as such that either naphtha or natural gas or a combination of the two can be used as feedstock. Natural gas is distributed by a local company and requirement for the plant is now under consideration by the company. Additionally, a Memorandum of Understanding (MOU) has been signed for supply of 3.6 lakh M.T. Of Naphtha.
J. Utilities:
Power:
The new plant has been conceived on a standalone basis and a 21 MW electro- generator has been incorporated in the design of the plant. A 100% capacity requirement is estimated as 19 MW. There is also a provision for emergency power generator.
Water:
The nearby river will be a source of raw water as approved by the State Government. The demineralized water (DM) will be met from the company’s water treatment facility.
Steam:
Waste heat boilers in the plant will supply high pressure, steam and the medium pressure steam will be met from the Turbine of the synthesis gas compressor.
Compressed air:
This will be drawn from the Air separation unit.
K. Manpower:
The plant will employ 44 officers and 123 technicians for the operation and administration of the plant. Availability of key personnel has also been finalised and the company does not have any difficulty of fresh recruitments.
Personnel will be imparted adequate training in the company’s own Training Institute as per the plan.
L. Environmental clearance:
The plant indicates treatment of all factory effluents before it is discharged into the common effluent channel. The State Pollution Control Board has already issued a NOC for the plant.
M. Schedule of implementation:
Risk factors and management’s perception of the same:
(a) Internal:
The manufacturing plants are operationally interlinked.
Management perception:
The company maintains high safety standards, hence functioning of one plant does not affect the functioning of another.
(b) External:
The profitability of the fertilizer operation is dependent upon the government’s subsidy policy which may come to the end by 31st March 1997.
Management’s perception:
Government is beginning the process of preparing the fertilizer subsidy policy commencing from April 1997.
O. Financial projections:
As the project is planned within a large existing plant the financial projections of the new ammonia plant, separated from all other activities of the company, are not available in the offer document and the projections are for the company as a whole.
10. Broad Criteria for Pre-Investment Decisions:
The development of a project report, we know, passes through the stages of Project Profile, Project Pre-feasibility and feasibility report, the techno-economic feasibility report and the DPR.
Somewhere at these stages, a tentative decision is made by the project owner/ management for investment in the said project but before a firm decision—certain principles—which are the standards for judging the project and launching on it—are applied and followed. This exercise is called the criteria for pre-investment decision.
Role of Project Management Consultants in Pre-tender and Post- tender.
Pre-Tender
Pre-tendering will always take place after contractor received notice of tender which usually being advertised through electronic medium or convention medium that is through newspaper.
Notice of tender also sometime being mailed to contractor by the parties who call for the tender. This type of tender usually calls invited tender.
Post Tender
Post tendering is a pre-contract activity and, as such, it is more flexible in its approach. It does relate back to a milestone document (i.e., the tender return) but it is not limited to the works carried out under the contract.
Role of Management Consultancy
Pre-tender
- Analyze Clients project requirements.
- Develop project control systems
- Establishment of project communication and reporting system.
- Prepare Master Schedule
- Lead Project Meetings
- Prepare Deliverable Schedule
- Prepare Procurement plan
- Conduct pre-bid meetings for completeness of tender specifications and technical parameters.
- Submitting weekly and monthly progress reports.
Post-Tender
- Probable date of completion
- Collection and Integration of various manuals, commissions.
- Preparation of project close-out report
- Collate and verify as per the initial plans
- Co-ordination with contractors to rectify the defects.
Key Takeaways:
- Feasibility study is one of the key activities within the project initiation phase.
- A Feasibility Study Report (FSR) is a formally documented output of feasibility study that summarizes results of the analysis and evaluations conducted to review the proposed solution and investigate project alternatives for the purpose of identifying if the project is really feasible, cost-effective and profitable.
- The importance of writing the report consists in providing legal and technical evidence of the project’s vitality, sustainability and cost-effectiveness.
- Regardless of project size, scope and type, there are several key steps to writing such an important document.
- The content of sample feasibility report is formatted and structured according to a range of requirements which may vary from organization to organization.
- One last thing you need to consider when writing your feasibility study report template is that the report should include a.
- Reference page that lists all reference material (articles, books, web pages, periodicals, reports, etc.) cited in your document.
- As the identification and intention for the implementation of the project grow, the depth of the study for the probable project increases.
- The report should be with sufficient details to indicate the possible fate of the project when implemented.
- The DPR deals with the financial estimates of the project operation for five to eight years from the start of the commercial production.
- The DPR also shows the capability of the project to serve the borrowings for its implementation
- Pre-tendering will always take place after contractor received notice of tender which usually being advertised through electronic medium or convention medium that is through newspaper.
- Post tendering is a pre-contract activity and, as such, it is more flexible in its approach. It does relate back to a milestone document (i.e.,
the tender return) but it is not limited to the works carried out under the contract.
References:
- Cost-Benefit Analysis for Project Appraisal Per by Olov Johansson
- Project Appraisal and Valuation of the Environment: General Principles and Six Case-Studies in Developing Countries by P. W. Abelson
- Strategic Project Risk Appraisal and Management by Elaine Harris
- Project Appraisal and Financing by Ambrish Gupta.
Unit - 6
Project Appraisal
Project Appraisal
- Project Appraisal is a consistent process of reviewing a given project and evaluating its content to approve or reject the project.
- By analyzing the problem or need to be addressed by the project, generating solution options for solving the problem.
- Selecting the most feasible option, conducting a feasibility analysis of that option, creating the solution statement, and identifying all people and organizations concerned with or affected by the project and its expected outcomes.
- It is an attempt to justify the project through analysis, which is a way to determine project feasibility and cost-effectiveness.
Various PM methodologies use various approaches and techniques for developing a project appraisal.
Step #1. Concept Analysis
- To conduct a range of analyses in order to determine the concept of the future project and provide the Decision Package for the senior management (project sponsors) for approval.
- To carry out the problem-solution analysis that determines the problem/need to be addressed and the solution used to handle the problem.
- The solution should analyzed by cost-effectiveness and feasibility (various project appraisal methods and techniques can be used).
- Identify stakeholders (those people and organizations involved in or affected by the problem and/or solution) and analyze their needs (how they relate to the problem and/or solution).
- After all, you must develop a decision package that includes the problem statement, the solution proposal, the stakeholder list, and the funding request. This package will then be submitted to the sponsor for approval (or rejection).
- If the sponsor approves the project concept, then you can proceed to the next step.
Step #2. Concept Brief
- Develop a summary of the project concept to define the goals, objectives, broad scope, time duration and projected costs.
- This data is used to develop the Concept Brief.
- Develop a project statement document that specifies the project mission, goals, objectives and vision.
- Create a broad scope statement that specifies the boundaries, deliverables ad requirements of your endeavor.
- Finally, make a preliminary schedule template that determines an estimated duration of the project
- Develop a cost projection document based on cost estimates and calculations.
Step #3. Project Organization
- Determine an organizational structure of the project
- This structure should be developed and explained in the Project Organizational Chart.
- The document covers such issues as governance structure (roles and responsibilities), team requirements and composition, implementation approach, performance measures, other info.
- The idea behind the Project Organizational Chart is to create a visual representation of the roles, responsibilities and their relationships and what people/organizations are assigned to what roles and duties within the project.
Step #4. Project Approval
- The final stage requires you to review all the previous steps and gather them into a single document called the Project Appraisal.
- This document summarizes all the estimations and evaluations made, to justify the project concept and verify that the proposed solution addresses the identified problem.
- The financial, the cost-effectiveness and the feasibility analyses will serve as the methods of project appraisal to approve the project.
- The document is must be submitted to the snooper stakeholders (the customer, the sponsor) for review and approval.
- If the appraisal is approved, then the project steps to the next phase, the planning.
Types of Appraisals
Political Appraisal:
Three perceptual dimensions frame appraisee’s perception of appraisal politics (APAP)
- First is appraiser's manipulation of ratings to achieve their self-serving ends such as own reputation, maintaining good relationships, building in-groups, and handling dependency threats from appraises.
- Second dimension constitutes fellow appraises' upward influence behaviors to get higher ratings and rewards.
- Third dimension relates to the outcome of appraisal, i.e., pay and promotion decisions that can be discriminatory when performance is ignored.
- Such actions are detrimental for good performers and performance culture. Drawing from the organizational justice theories, it is proposed that those appraisal-related structural (e.g., criteria), process (e.g., voice) and contextual antecedents (e.g., relation with appraiser) that enhance appraisee’s perceived control, understanding, and prediction of appraisal decision and process can mitigate APAP.
Social
Social appraisal processes provide clients with information about the outcomes of programs and actions that they have implemented.
Facilitating improved strategies to deliver cost effective benefits for businesses and communities.
Strong technical capabilities and ability to work as part of an integrated team of that are adaptable and flexible in meeting the clients’ needs.
The Social Appraisal, monitoring and evaluation programs assist our clients with the right information to appreciate and benchmark:
- Changing demographics and institutional contexts;
- Community perceptions of all aspects of the project;
- Current emerging issues and impacts;
- The most effective management and enhancement programs, based on regional, national and international evidence;
- Business performance in a social and environmental sense.
Environmental
Environmental appraisal is the process of identifying opportunities and threats the organization faces.
Factors affecting environmental Appraisal
- Strategist related factors: Since strategist play a central role in formulation of strategies such as age, education, experience, motivation, cognitive styles, ability to withstand, responsibility have an impact to the extent in which they are able to appraise the environment.
- Organizational factors: Characteristics of the organization, which affect the environment, are nature of business, age, size, complexity, nature of market, product or service that it provides.
- Environment factors: The nature of environment faced by the organization determines how appraisal could be applied.
Economical
- The project aspects highlighted include requirements for raw material, level of capacity utilization, anticipated sales, anticipated expenses and the probable profits.
- A business should have always a volume of profit clearly in view which will govern other economic variables like sales, purchases, expenses and alike.
- It has to be calculated on how much sales would be necessary to earn the targeted profit.
- The demand for the product will be estimated for anticipating sales volume.
- Therefore, demand for the product needs to be carefully spelled out to a great extent on the deciding factor of feasibility of the project.
Financial
Finance is one of the most important pre-requisites to establish an enterprise. It is finance only that facilitates an entrepreneur to bring together the labour of one, machine of another and raw material of yet another to combine them to produce goods.
In order to adjudge the financial viability of the project, the following aspects need to be carefully analysed:
Assessment of the financial requirements both – fixed capital and working capital
Knowing that fixed capital normally called ‘fixed assets’ are those tangible and material facilities which can be purchased once and used again and again. Land and buildings, plants and machinery, and equipment’s are the familiar examples of fixed assets/fixed capital.
But, while assessing the fixed capital requirements, all items relating to the asset like the cost of the asset, architect and engineer’s fees, electrification and installation charges (which normally come to 10 per cent of the value of machinery), depreciation, pre-operation expenses of trial runs, etc., should be duly taken into consideration.
If any expense is to be incurred in remodeling, repair and additions of buildings should also be highlighted in the project report.
In accounting, working capital means excess of current assets over current liabilities. Generally, 2: 1 is considered as the optimum current ratio.
Market Analysis:
Before the production actually starts, the entrepreneur needs to anticipate the possible market for the product. He/she has to anticipate who will be the possible customers for his product and where and when his product will be sold.
Thus, knowing the anticipated market for the product to be produced becomes an important element in every business plan.
Key Takeaways:
- Project Appraisal is a consistent process of reviewing a given project and evaluating its content to approve or reject the project.
- Types of Appraisals are Political Appraisal, social, environmental, Techno legal, Economical and Financial.
- Social appraisal processes provide clients with information about the outcomes of programs and actions that they have implemented.
- Environmental appraisal is the process of identifying opportunities and threats the organization faces
- A business should have always a volume of profit clearly in view which will govern other economic variables like sales, purchases, expenses and alike
- Finance is one of the most important pre-requisites to establish an enterprise
Criteria for Project Selection
There are various project selection methods practiced by modern business organizations. The methods contain different features and characteristics. Therefore, each selection method is applicable according to the need of the organization.
There are many differences in project selection methods but the concepts and principles remain the same.
For our consideration let us browse through two methods
- The value of one project needs to be compared against the other projects in order to use the benefit measurement methods. This could include various techniques but common is: You and your team could come up with certain criteria that you want your ideal project objectives to meet.
- Then give each project scores based on how they rate in each of these criteria and then choose the project with the highest score.
- When it comes to the Discounted Cash flow method, the future value of a project is ascertained by considering the present value and the interest earned on the money.
- The higher the present value of the project, the better it would be for your organization.
- The rate of return received from the money is what is known as the IRR.
- The mathematical approach is commonly used for larger projects. The constrained optimization methods require several calculations in order to decide on whether or not a project should be rejected.
- Cost-benefit analysis is used by several organizations to assist them to make their selections. In this method consider all the positive aspects of the project which are the benefits and then deduct the negative aspects from the benefits. Based on the results choose the option that would be most viable and financially rewarding.
Benefit and Cost Analysis
These benefits and costs have to be carefully considered and quantified in order to arrive at a proper conclusion. Questions that you may want to consider asking in the selection process are:
- Would this decision help me to increase organizational value in the long run?
- How long will the equipment last for?
- Would I be able to cut down on costs as I go along?
- In addition to these methods, choose the opportunity cost –
- When choosing any project, keep in mind the profits that need to made if you decide to go ahead with the project. Profit optimization is therefore the ultimate goal.
NPV
Net present value (NPV) is the difference between the present value of cash inflows and the present value of cash outflows over a period of time. NPV is used in capital budgeting and investment planning to analyze the profitability of a projected investment or project.
The following formula is used to calculate NPV:

Where
Rt= Net cash inflows-outflows during a single period t.
I= Discount rate or return that could be calculated in alternative installments.
t=number of time periods
NPV=TVECF−TVIC
Where:
TVECF=Today’s value of the expected cash flows
TVIC=Today’s value of invested cash
IRR
The internal rate of return (IRR) is a metric used in capital budgeting to estimate the profitability of potential investments. The internal rate of return is a discount rate that makes the net present value (NPV) of all cash flows from a particular project equal to zero. IRR calculations rely on the same formula as NPV does.
Formula and Calculation for IRR
It is important for a business to look at the IRR as the plan for future growth and expansion. The formula and calculation used to determine this figure follows.

Ct = net cash flow during period t.
C0 = total investment cost
IRR = initial rate of return
T = number of periods.
The internal rate of return allows investments to be analyzed for profitability by calculating the expected growth rate of an investment’s returns and is expressed as a percentage.
Internal rate of return is calculated such that the net present value of an investment yields zero, and therefore allows the comparison of the performance of unique investments over varying periods of time
Modified internal rate of return allows the comparison of the fund when different rates are calculated for the initial investment and the capital cost of reinvestment which often differ.
Calculating IRR in Excel
There are two ways to calculate IRR in Excel:
- Using one of the three built-in IRR formulas
- Breaking out the component cash flows and calculating each step individually, then using those calculations as inputs to an IRR formula—as we detailed above, since the IRR is a derivation, there is no easy way to break it out by hand
The second method is preferable because financial modeling works best when it is transparent, detailed, and easy to audit. The trouble with piling all the calculations into a formula is that you can't easily see what numbers go where, or what numbers are user inputs or hard-coded.
Payback Period
Payback period is the time required to recover the initial cost of an investment.
It is the number of years it would take to get back the initial investment made for a project.
Therefore, as a technique of capital budgeting, the payback period will be used to compare projects and derive the number of years it takes to get back the initial investment.
The project with the least number of years usually is selected.
Features
- It ignores the time value of money. All other techniques of capital budgeting consider the concept of time value of money. Time value of money means that a rupee today is more valuable than a rupee tomorrow. So other techniques discount the future inflows and arrive at discounted flows.
- It is used in combination with other techniques of capital budgeting. Owing to its simplicity the payback period cannot be the only technique used for deciding the project to be selected.
Illustrations
Let us understand the payback period method with a few illustrations.
Apple Limited has two project options. The initial investment in both the projects is Rs. 10,00,000.
Project A has even inflow of Rs. 1,00,000 every year.
Project B has uneven cash flows as follows:
Year 1 – Rs. 2,00,000
Year 2 – Rs. 3,00,000
Year 3 – Rs. 4,00,000
Year 4 – Rs. 1,00,000
Now let us apply the payback period method to both the projects.
The formula for computing payback period with even cashflows is:
Project A
If we use the formula, Initial investment / Net annual cash inflows then:
10,00,000/ 1,00,000 = 10 years
Project B
Total inflows = 10,00,000 (2,00,000+ 3,00,000+ 4,00,000+ 1,00,000)
Total outflows = 10,00,000
Project B takes four years to get back the initial investment.
Now, let us modify the cash flows of project B and see how to get the payback period:
Say, cash inflows are –
Year 1 – Rs. 2,00,000
Year 2 – Rs. 3,00,000
Year 3 – Rs. 7,00,000
Year 4 – Rs. 1,50,000
The payback period can be calculated as follows:
Year | Total Flow (in Lakhs) | Cumulative flow |
0 | (10) | (10) |
1 | 2 | (8) |
2 | 3 | (5) |
3 | 7 | 2 |
4 | 1.5 | 3.5 |
Now to find out the payback period:
Step 1: We must pick the year in which the outflows have become positive. In other words, the year with the last negative outflow has to be selected. So, in this case, it will be year two.
Step 2: Divide the total cumulative flow in the year in which the cash flows became positive by the total flow of the consecutive year.
So that is: 5/7 = 0.71
Step 3: Step 1 + Step 2 = The payback period is 2.71 years.
Therefore, between Project A and B, solely on the payback method, Project B (in both the examples) will be selected.
The example stated above is a very simple presentation. In an actual scenario, an investment might not generate returns for the first few years. Gradually over time, it might generate returns. That too will play a major role in determining the payback period.
Advantages
- Payback period is very simple to calculate.
- It can be a measure of risk inherent in a project. Since cash flows that occur later in a project's life are considered more uncertain, payback period provides an indication of how certain the project cash inflows are.
- For companies facing liquidity problems, it provides a good ranking of projects that would return money early.
Disadvantages
- Payback period does not take into account the time value of money which is a serious drawback since it can lead to wrong decisions. A variation of payback method that attempts to address this drawback is called discounted payback period method.
- It does not take into account, the cash flows that occur after the payback period. This means that a project having very good cash inflows but beyond its payback period may be ignored.
Break even Analysis
- A break-even analysis is a financial tool, which helps you to determine at what stage your company, or a new service or a product, will be profitable.
- It’s a financial calculation for determining the number of products or services a company should sell to cover its costs (particularly fixed costs).
- Break-even is a situation where you are neither making money nor losing money, but all your costs have been covered.
- Break-even analysis is useful in studying the relation between the variable cost, fixed cost and revenue.
Components
Fixed costs
Fixed costs also called as the overhead cost. These overhead costs occur after the decision to start an economic activity is taken and these costs are directly related to the level of production, but not the quantity of production.
Fixed costs include (but are not limited to) interest, taxes, salaries, rent, depreciation costs, labour costs, energy costs etc.
These costs are fixed no matter how much you sell.
Variable costs
Variable costs are costs that will increase or decrease in direct relation to the production volume.
These costs include cost of raw material, packaging cost, fuel and other costs that are directly related to the production.
Calculation
The basic formula for break-even analysis is calculated by dividing the total fixed costs of production by the contribution per unit.
Contribution per unit = selling price per unit – variable cost per unit.
Breakeven point in quantity (BEP) = FC / Contribution per unit or FC/(P-VC)
Benefits:
- Set revenue targets: Once the break-even analysis is complete, you will get to know how much you need to sell to be profitable. This will help you and your sales team to set more concrete sales goals.
- Make smarter decisions: Entrepreneurs often take decisions in relation to their business based on emotion. Emotion is important i.e., how you feel, though it’s not enough. In order to be a successful entrepreneur, your decisions should be based on facts.
- Fund your business: This analysis is a key component in any business plan. In order to fund your business, you have to prove that your plan is viable. Furthermore, if the analysis looks good, you will be comfortable enough to take the burden of various ways of financing.
- Better Pricing: Finding the break-even point will help in pricing the products better. This tool is highly used for providing the best price of a product that can fetch maximum profit without increasing the existing price.
- Cover fixed costs: Doing a break-even analysis helps in covering all fixed cost.
Key Takeaways:
- There are many differences in project selection methods but the concepts and principles remain the same.
- The higher the present value of the project, the better it would be for your organization
- The benefits and costs have to be carefully considered and quantified in order to arrive at a proper conclusion.
- Net present value (NPV) is the difference between the present value of cash inflows and the present value of cash outflows over a period of time.
- NPV is used in capital budgeting and investment planning to analyze the profitability of a projected investment or project.
- The internal rate of return (IRR) is a metric used in capital budgeting to estimate the profitability of potential investments. The internal rate of return is a discount rate that makes the net present value (NPV) of all cash flows from a particular project equal to zero
- Payback period is the time required to recover the initial cost of an investment
- A break-even analysis is a financial tool, which helps you to determine at what stage your company, or a new service or a product, will be profitable
- Variable costs are costs that will increase or decrease in direct relation to the production volume.
Study of Project Feasibility report
- Feasibility study is one of the key activities within the project initiation phase.
- It aims to analyze and justify the project in terms of technical feasibility, business viability and cost-effectiveness.
- The study serves as a way to prove the project’s reasonability and justify the need for launch.
- Once the study is done, a feasibility study report (FSR) should be developed to summarize the activity and state if the particular project is realistic and practical.
Definition
A Feasibility Study Report (FSR) is a formally documented output of feasibility study that summarizes results of the analysis and evaluations conducted to review the proposed solution and investigate project alternatives for the purpose of identifying if the project is really feasible, cost-effective and profitable. It describes and supports the most feasible solution applicable to the project.
The report gives a brief description of the project and some background information.
Importance
The process to write the report is called feasibility study reporting. Often it is a responsibility of the project manager to control such a process. The importance of writing the report consists in providing legal and technical evidence of the project’s vitality, sustainability and cost-effectiveness. The reporting process allows the senior management to get the necessary information required for making key decisions on budgeting and investment planning.
A well-written feasibility study report template lets develop solutions for:
- Project Analysis because an example of FSR helps link project efficiency to budgeted costs.
- Risk Mitigation because it helps with contingency planning and risk treatment strategy development.
- Staff Training because the report can be used by senior management to identify staffing needs as well as acquire and train necessary specialists.
The process of reporting is the trigger to run the project investing process through underpinning the business case document, stating the reasons for undertaking the project, and analyzing project costs and benefits.
Steps
Regardless of project size, scope and type, there are several key steps to writing such an important document.
- Write Project Description
At this step, you need to collect background information on your project to write the description.
Example, your company needs to increase online sales and promote your products/services on the Web. Then in the first part of your report you could write the next description:
“This project is website development to promote the products/services in Internet and increase online sales through encouraging customers to visit the website and make online bargains.”
2. Describe Possible Solutions
In order to take this step to write a feasibility study report template, you’ll need to perform an alternatives analysis and make a description of possible solutions for your project.
Example, in your FSR template your e-commence project might have the following solutions description:
“This project can be undertaken by the implementation of the two possible solutions: 1) Online Shop; 2) Corporate Website. Each of the solutions is carefully analyzed, and necessary information required for making the final decision is available for the management team.”
3. List Evaluation Criteria
This step of feasibility study report writing requires you to investigate the solutions and put them against a set of evaluation criteria.
Example, you could add the following criteria to your report:
“The possible solutions of this project are evaluated and compared by the following criteria: 1) Concept Spec.; 2) Content Audit; 3) Technical Design Spec.; 4) Launch Schedule & Time-frames.”
4. Propose the Most Feasible Solution
Once the criteria are used to evaluate the solutions, your next step for writing a feasibility study report is to determine the most economically reasonable and technically feasible solution which lets the company 1) keep to optimal use of project resources and 2) gain the best possible benefit.
For example, your report might include:
“After the evaluation of the possible solutions, the most feasible solution for this project is identified and selected, so the project turns to be cost-effective, vital and practical.”
5. Write Conclusion
The final step of the feasibility study reporting process requires you to make a conclusion by summarizing the project’s aim and stating the most feasible solution.
For example, the conclusion of your FSR might be:
“This project’s purpose is to develop a sophisticated and original design of the website that will contribute to online sales increasing, attract the target customer’s attention, and be cost-effective. The most feasible solution for the project has been chosen and approved and now is ready for further elaboration.”
Content Requirements
The content of sample feasibility report is formatted and structured according to a range of requirements which may vary from organization to organization.
Front Matter
To begin with writing a sample feasibility report, first you need to create a title page that provides a descriptive yet concise title, your (i.e., author’s) name, email, job position, and also the organization for which you’re writing the report. Next, you must include an itemized list of contents that provides headings and sub-headings sequenced the same way as they are structured in the report body. Also add a list of all material (tables, figures, illustrations, annexes) used within the doc. Remember that the title page shouldn’t be numbered and that no more than 4-5 pages should be dedicated to the front matter.
Report Body Format
Because there are many different styles and requirements for formatting the body of feasibility study report, it may be difficult for you to select right format for your report, so I suggest you discuss this issue with your curator or supervisor who should provide you with right styling and format requirements.
Meanwhile, there are several common suggestions as follows:
- Each page of the report body needs to include a descriptive header with an abbreviated title for the report, the author’s name and page number (at the right top)
- Structure the report by headings and sub-headings and indicate this structure within the document content.
- Make sure headings are properly formatted (i.e., flush left, indented, etc.) on each page.
- Use the same style for headings throughout the entire report template.
- Never use too larger or too small font (font should have a professional look, 10-12 point)
- Use the same citation style (e.g., CBE, APA, etc.) for formatting sources used in your feasibility study template
Report Template Sections
The following list provides an outline of the key sections to be included in report content:
- Executive Summary – a description of the problem/opportunity highlighted in the study, the purpose of the report, and the importance of the research for your target audience.
- Background – a more detailed description of the feasibility study, who it was carried out, and whether it was implemented elsewhere
- Analysis – an examination and evaluation method employed in the conducting your feasibility study
- Alternatives and Options – an overview of any alternative proposals or options and their features in comparison to the main proposal of the study
- Cost-Benefit Evaluation – a rigorous analysis method that was implemented to examine and evaluate the main proposal for cost-benefit effectiveness and to demonstrate the tech feasibility, economic practicality, social desirability, and eco soundness of the proposal.
- Conclusion – a summary of the work done and your own conclusions regarding your analysis
- Recommendations – a series of recommendations practices and follow-up actions based on your conclusions
Back Matter
One last thing you need to consider when writing your feasibility study report template is that the report should include a
Reference page that lists all reference material (articles, books, web pages, periodicals, reports, etc.) cited in your document. This page should be styled appropriately.
Create an Appendix page that provides detailed discussions of all criteria used in analyzing feasibility and examples of each criterion. This page should also be styled appropriately.
Detailed Project Report
As the identification and intention for the implementation of the project grow, the depth of the study for the probable project increases. Further analyses of the details relevant to such a project become imperative.
We know that the feasibility report contains sufficient detailed information. It is from the study of the pre-feasibility or feasibility report that approval is made by the project owner (an individual or a project director/manager or the management of a company) for the investment on the project or for a request to prepare the DPR.
Preparation of DPR is a costly and time-taking job (which may even extend to one year) when reports of specialists from different streams like market research, engineering (civil, mechanical, metallurgical, electrical, electronics), finance etc.—as relevant to the project itself—are considered in the DPR.
Objectives
The objectives in preparation of the DPR should ensure that:
(a) the report should be with sufficient details to indicate the possible fate of the project when implemented.
(b) the report should meet the questions raised during the project appraisals, i.e., the various types of analyses—be it financial, economic, technical, social etc.—should also be taken care of in the DPR.
Background
The background should also include details of the product, sizes with capacity, organization and the technical know-how involved:
Project at a glance
Market Report
Technical Details
Plant and Machinery
Project Schedule
Organization
Cost and Sources of Finance
Let us consider these aspects with an example
Background:
A. Organisation
A Greenfield project to be launched by Indian promoters in partnership with a foreign company renowned in the relevant business along with their equity participation and a representation in the company’s board.
B. Product:
Manufacture of products Q, R, S etc. are mainly used in the medical field. These products are not currently manufactured in India, except one or two units with quality reportedly inferior to international standard. Hence, there is a need and opportunity felt by the promoters, as the project is favourable for the saving of foreign exchange.
C. Technical know-how:
The expertise, along with the supply of the major plant and machineries, are to be provided by the foreign partner, who is well experienced in this field.
The required training of key personnel will also be provided by the collaborator.
The concerned authorities have approved the participation in equity by the foreign company and the terms of the ‘know-how agreement’.
The collaborator is ready to buy-back the entire production, but it has been agreed that about 20% of the total production will be marketed in India. In view of this, the company has been identified as an Export Oriented Unit (EOU).
2. Project at a Glance:
A. Product:
Q, R, S etc. for Medical Instruments.
B. Capacity:
35,000 pcs per annum.
C. Production:

D.Sales:
In lakhs of Rs. 360 600 900 1,200 1,350
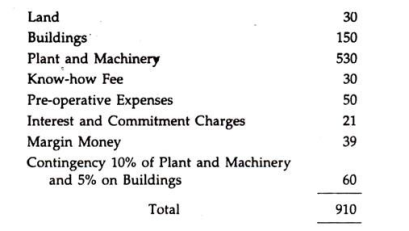
E. Source of financing
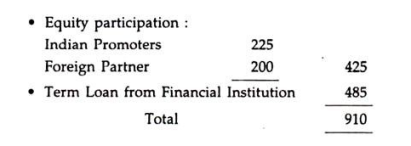
Market Research on the Product:
The special report indicates:
a. Expected volume of the market and its growth;
b. Expected volume of the market share;
c. The possible marketing channels and the need for the specific background of the dealers;
d. The dealers’ expectation about their commission, discounts etc.;
e. The credit period to be extended to the dealers, major customers etc., the prevailing market trend in this area;
f. The requirement of service after sales;
g. The behavioral pattern of the ultimate customers and their reaction to the availability of such products. (This is a delicate area and depends upon the sectors of the customers to whom the product is addressed housewives, executives, professionals, doctors etc. In the project under discussion, the customers are primarily the doctors who are interested in the usage of the Q, R, S etc. for medical instruments 
h. The competitors, their strength and weakness and their market share.
4. Technical Details:
The details of the products include:
A. Products:
i. ‘Q’: There are strands of high purity element with cylindrical inner core with high refractive index. The outer shell is called cladding with comparative lower refractive index, the light rays propagating within the core of the fibre is reflected back into the core.
The fibre dia. Varies between x microns to y microns and, as such, can work as flexible light cables.
Ii. ‘R’: This is used to transmit light through flexible cables.
Iii. ‘S’: This is ideal for usage as an accessory for surgical microscope in Ophthalmia, Gynecology, Plastic and Neuro-surgery etc. where temperature is a critical factor.
B. Manufacturing process:
Fiber drawing:
The fibers are drawn from the element which is melted in a furnace. The process draws continuous length of fiber from the melting element whose softening temperature is lower than that of quartz; then the fibers are wound in large drums.
The other operations to follow include:
i. Fiber cleaning and washing;
Ii. Fiber laying and cutting;
Iii. Sheathing;
Iv. End fitting;
v. Epoxy curing;
Vi. Grinding and polishing; and
Vii. Quality inspection.
(Similar description of the process for the manufacturing of R and S are narrated in the DPR.)
C. Plant layout:
The project report includes a diagram of the plant layout taking care of:
i. The suggestions from the building architect.
Ii. The site, the plant drawings with the locations of the machineries, center for power house, the power connections.
Iii. The process work flow, taking care of the flow of the materials, manufacturing process and delivery to the finished goods store.
Iv. The passage for the inward delivery of the raw materials, their receipts, incoming equality inspections etc. should not cross the passage-for outward delivery of the finished goods. Similarly, within the manufacturing area, the production process centers follow the serial order of the production processes, with facilities for issue of the raw materials to the relevant process centre, their movements without disturbing other process centres.
There should be scope of ‘quality inspection’ in the stages of production process. The layout should take care of the delivery of the finished goods to the finished goods store with least disturbance of other movements within the production floor.
The basic idea of the layout should also take care of:
i. The required space per head for direct workers;
Ii. Movement of materials and men should be without interruption;
Iii. Convenience to supervise with a clear overview for the plant manager;
Iv. Utilities including toilets, canteen, first-aid room, rest room etc.; and
v. Security aspect.
5. Plant and Machinery:
The plant and machinery required for the project include:
i. Drawing Tower;
Ii. Grinding and Polishing Machine;
Iii. Diamond Wheel Saw/Cut-off Saw;
Iv. Epoxy Curing Oven;
v. Electrolytic Etching Machine and
Vi. Optometer.
The auxiliary service equipment includes:
i. Power requirements for the plant;
Ii. Utilities: water for the manufacturing process, air-washing plant;
Iii. Equipment for maintenance workshop and
Iv. Requirements for Pollution Control.
6. Project Schedule:
The project report should have complete details of the estimated time schedule for the implementation of the project from the start till the final ‘trial run’ i.e., just before the start of commercial production. The essential main steps for the implementation are listed in serial order of such steps. Such steps are then chronologically arranged along with the estimated time to complete the works involved in each step.
While the actual step is to be taken at a certain point of time—whenever the situation permits—the necessary preparatory work should be carried out earlier so that the step can be taken in time.
For example, before a placement of order to an overseas supplier and opening of the necessary Letter of Credit (LC), the preparatory works include:
a. Establishment of the specification of the materials to be ordered along with its qualities;
b. Enquiries and their responses from different suppliers;
c. The time schedule required for deliveries;
d. The final payment terms;
e. The quality and the replacements in case of defectives/damages;
f. The insurance coverage;
g. The arbitration, in case of disputes etc.
Similarly, the appointments of senior personnel such as Production Manager, Supervisor, technical hands, finance and administration, personnel, security etc. must precede the appointment of Directs and Indirect in the plant.
The Project Schedule with work packages in project implementation and time plan is presented as per the following bar chart:
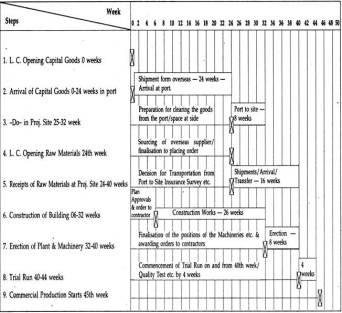
Considerable amount of work is involved in procurement of materials from overseas, placing order with the delivery schedule, opening of letter of credit etc. including:
a. Quality of material available from different suppliers;
b. Time schedule required by suppliers for delivery;
c. Competitive prices, taking care of cost, insurance freight and inland transportation;
d. Replacement in case of defectives/damages, the relevant terms in this regard;
e. Arbitration in case of dispute.
Besides the preparatory works necessary before the start of every major step as illustrated, there are also innumerable types of work involved in the business of starting a project, which may not be possible to describe in the Bar Chart.
For example, before recruitment, it is desirable to decide the ‘personnel policy’, the various grades, the market rates and the rates and scales to be offered.
The Project Schedule helps the management to review the progress and, thus, control the implementation while reviewing the actual progress against the schedule/budget.
Even the ‘possible delay’ is analysed and all means explored to avoid the delay and maintain the time schedule.
This is so important in every project implementation that the Project Manager maintains chart in his office showing the actual process as compared to the budgeted schedule, continuously updating the progress with the passage of time.
7. Organisation:
Considering the detailed volume of activities in Production, Selling, Administration and other support services, e.g., Procurements, Personnel, Maintenance etc., man-power requirements at different grades/levels like Manager, Supervisor, Skilled, Semi-skilled, Unskilled and other work-forces are estimated for each functional group.
Pay scales for different grades should be ascertained and clearly defined to avoid anomalies/disputes in future. Recruitments should be planned in accordance with the strength of work-force required as per the volume of activities forecasted in stages.
8. Project Costs and Source of Finance:
[The project report should contain the salient features of the project costs as per the major heads of accounts.]
The project costs of Rs. 9:1 crores are detailed as follows:
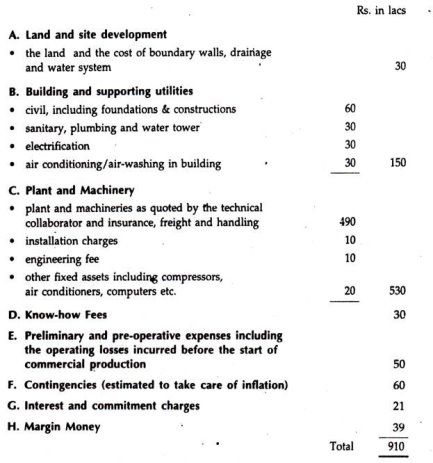
The project costs are codified and summarised along with the sourcing of the fund required for the project:
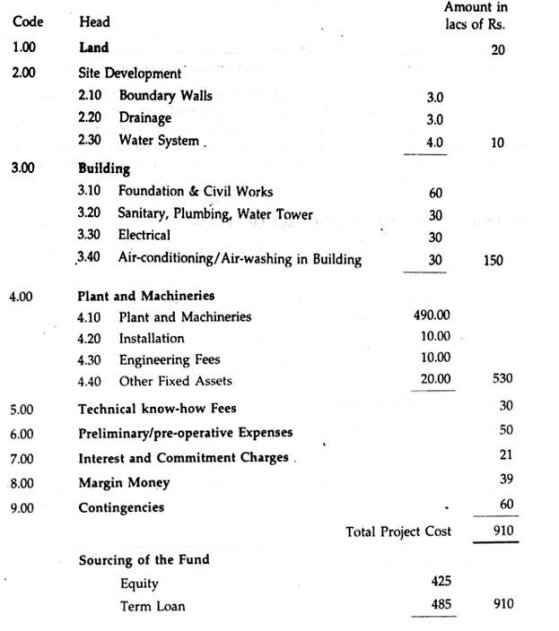
Cost of production:
The DPR deals with the financial estimates of the project operation for five to eight years from the start of the commercial production. We have dealt with such estimates for five years. The report shows under this head the details of the cost of production depending upon the envisaged volume of activities.
The estimated cost of production for initial five years is shown in the following table:
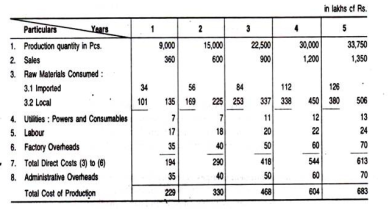
Profit and loss account:
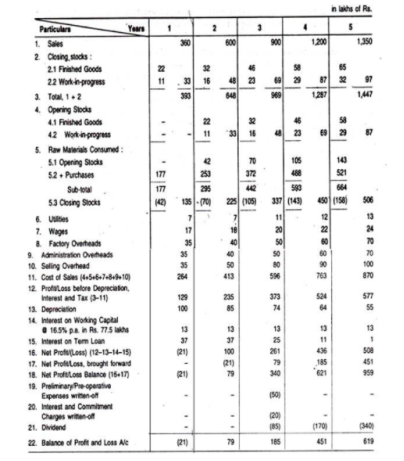
Balance sheet at the end of the year
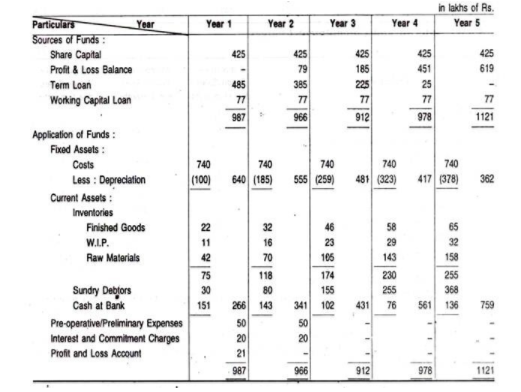
Fund flow
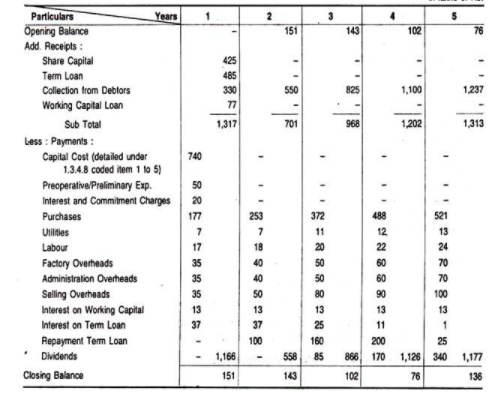
Interest and commitment charges
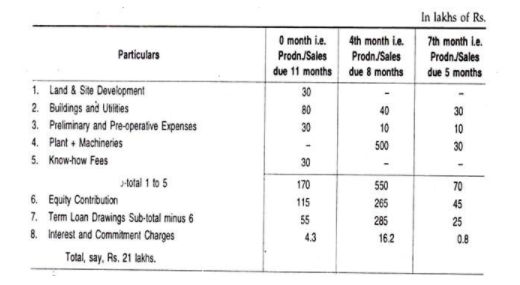
Working Capital
The working capital represents the net current assets, i.e., the Current Assets less the Current Liabilities and, as such, generally includes: Inventories for Raw Materials, Finished Goods, W.I.P.; Debtors (less creditors); Overheads for 1 to 2 month(s).
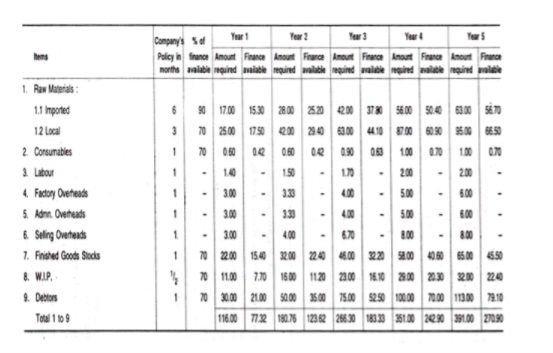
Debt service coverage ratio (DSCR):
The DPR also shows the capability of the project to serve the borrowings for its implementation.
DSCR is also important to indicate the liquidity position of the project, i.e., generating not just the profit margin, but sufficient surplus cash to service the lenders, the shareholders (in the form of dividends).
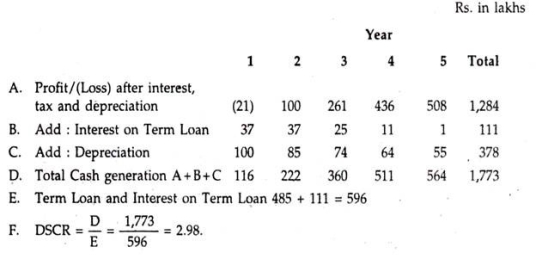
Break-even analysis:
The DPR shows a detailed calculation to indicate the level of activities (with the projected figures), when the organisation breaks even. We know that the excess of sales over the variable costs is called the ‘contribution’, that is, the contribution towards the company’s fixed costs and the contribution in excess of the fixed costs represents the profit margin.
The components of the total cost are analysed to (1) the fixed cost and (2) the variable cost. As the company’s activities are not stabilised during the initial years the break-even level is worked out from the details of the projected Profit and Loss Account of the third year. The Break-even analysis of the DPR is shown hereinafter.
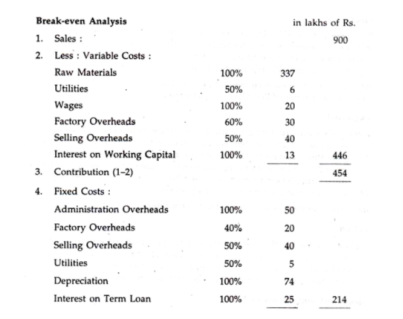
Illustration on ‘offer document’:
A. Project:
1,350 tonnes per day (MTPD) new ammonia project. Ammonia from this plant will be used for in-house consumption as a feedstock for fertilizers already being manufactured by the company. The company has existing plant for manufacturing ammonia of 950 MTPD and the new plant will, eventually, replace the old plant.
B. Background:
The company’s activity during the initial years was manufacture of fertilizers, while ammonia was sold as a by-product. Subsequently, the company diversified to other products like Nylon-6, Melamine and promoted a joint venture (with State Government share of 26% and own share of 25%) for manufacturing Ammonia and Urea.
The company has taken over one unit manufacturing Nylon Filament Yarn and Nylon Chips and another unit, which is now ‘Polymers Unit’, manufacturing 5,000 tpa polymers.
C. Location:
The plant is located within the present activity site where space is no constraint. The suppliers of the feedstock, Natural Gas and also Naphtha are also located in the neighbourhood with all convenience for the supply of raw materials and, being housed with the present activities, the finished product can be conveniently used for captive consumption.
D. Project cost and means of finance:
The company’s project was initially appraised by IDBI in 1994 with the estimated project cost of Rs. 750 crores. Initially, the raw materials envisaged for the project was natural gas. However, to enable the project, to have a greater flexibility, changes were made in the equipment design, drawing etc. for the use of naphtha as an alternate feedstock.
This change along with the increase in the Customs Duty etc. duty to change in rupee parity raise caused a revision of the project cost finalised at Rs. 1,030 crores as detailed below:
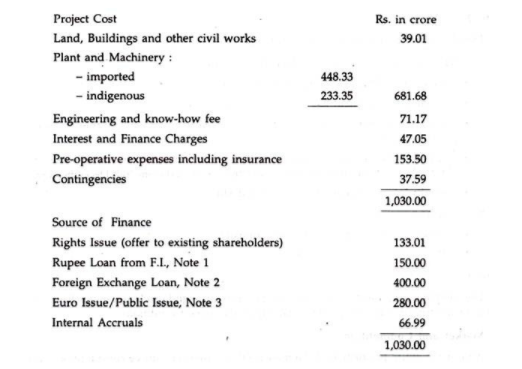
E. Market and competition:
Almost the entire production of Ammonia will be used for captive consumption. Part will be used for production of Urea. Various other players in the industry have also announced capacity expansion in Ammonia and Urea.
As per report on the fertilizer industry (December 1995) demand for Urea in India is expected to increase from 16.4 million tonnes in 1994 to 20.8 million tonnes in 2000 A.D. India would continue to be one of the largest importers of Urea with around 4.9 million tonnes of imports till 2000 A.D.
F. Capacity:
The capacity utilisation of the new Ammonia Plant for four years after the commercial production from October 1997 is estimated as
Year 1 80%
Year 2 90%
Year 3 95%
Year 4 95%
G. Technology arrangements:
Agreements for technology involved with the technical contractors and the process licensors have been finalised as follows:
1. Engineering contractors:
ABC of Germany a leading company in the field of engineering and contracting, material handling, refrigeration and industrial gases. The company will offer licence, know-how, basic engineering and design, training and expatriate services for detailed engineering.
2. Licence:
Process 1: From BCD of Germany with a fee of DM 8, 40,000; Process 2: From CDE of Switzerland with a fee of DM 1.149.999;
The total licence fee of DM 1.989.999 will be paid as:
i. 5% upon effective date of contract;
Ii. 28% upon disbursement of loan agreement;
Iii. 33% upon 5 months from the date of contract or on completion of basic engineering, whichever is later;
Iv. 34% upon acceptance of the plant, at latest 39 months from the effective date of contract.
H. Production process:
The generation of pure ammonia synthesis gas is achieved by adding nitrogen to the pure hydrogen produced.
The process plant is divided into the following sections:
i. Naphtha storage—pre-treatment;
Ii. Natural gas compression;
Iii. Generation of hydrogen and purification;
Iv. Ammonia synthesis based on ‘Casale’ process; and
v. Refrigeration.
I. Raw materials:
The process technology selected as such that either naphtha or natural gas or a combination of the two can be used as feedstock. Natural gas is distributed by a local company and requirement for the plant is now under consideration by the company. Additionally, a Memorandum of Understanding (MOU) has been signed for supply of 3.6 lakh M.T. Of Naphtha.
J. Utilities:
Power:
The new plant has been conceived on a standalone basis and a 21 MW electro- generator has been incorporated in the design of the plant. A 100% capacity requirement is estimated as 19 MW. There is also a provision for emergency power generator.
Water:
The nearby river will be a source of raw water as approved by the State Government. The demineralized water (DM) will be met from the company’s water treatment facility.
Steam:
Waste heat boilers in the plant will supply high pressure, steam and the medium pressure steam will be met from the Turbine of the synthesis gas compressor.
Compressed air:
This will be drawn from the Air separation unit.
K. Manpower:
The plant will employ 44 officers and 123 technicians for the operation and administration of the plant. Availability of key personnel has also been finalised and the company does not have any difficulty of fresh recruitments.
Personnel will be imparted adequate training in the company’s own Training Institute as per the plan.
L. Environmental clearance:
The plant indicates treatment of all factory effluents before it is discharged into the common effluent channel. The State Pollution Control Board has already issued a NOC for the plant.
M. Schedule of implementation:
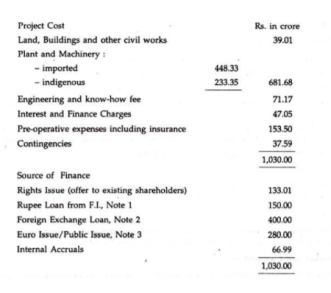
Risk factors and management’s perception of the same:
(a) Internal:
The manufacturing plants are operationally interlinked.
Management perception:
The company maintains high safety standards, hence functioning of one plant does not affect the functioning of another.
(b) External:
The profitability of the fertilizer operation is dependent upon the government’s subsidy policy which may come to the end by 31st March 1997.
Management’s perception:
Government is beginning the process of preparing the fertilizer subsidy policy commencing from April 1997.
O. Financial projections:
As the project is planned within a large existing plant the financial projections of the new ammonia plant, separated from all other activities of the company, are not available in the offer document and the projections are for the company as a whole.
10. Broad Criteria for Pre-Investment Decisions:
The development of a project report, we know, passes through the stages of Project Profile, Project Pre-feasibility and feasibility report, the techno-economic feasibility report and the DPR.
Somewhere at these stages, a tentative decision is made by the project owner/ management for investment in the said project but before a firm decision—certain principles—which are the standards for judging the project and launching on it—are applied and followed. This exercise is called the criteria for pre-investment decision.
Role of Project Management Consultants in Pre-tender and Post- tender.
Pre-Tender
Pre-tendering will always take place after contractor received notice of tender which usually being advertised through electronic medium or convention medium that is through newspaper.
Notice of tender also sometime being mailed to contractor by the parties who call for the tender. This type of tender usually calls invited tender.
Post Tender
Post tendering is a pre-contract activity and, as such, it is more flexible in its approach. It does relate back to a milestone document (i.e., the tender return) but it is not limited to the works carried out under the contract.
Role of Management Consultancy
Pre-tender
- Analyze Clients project requirements.
- Develop project control systems
- Establishment of project communication and reporting system.
- Prepare Master Schedule
- Lead Project Meetings
- Prepare Deliverable Schedule
- Prepare Procurement plan
- Conduct pre-bid meetings for completeness of tender specifications and technical parameters.
- Submitting weekly and monthly progress reports.
Post-Tender
- Probable date of completion
- Collection and Integration of various manuals, commissions.
- Preparation of project close-out report
- Collate and verify as per the initial plans
- Co-ordination with contractors to rectify the defects.
Key Takeaways:
- Feasibility study is one of the key activities within the project initiation phase.
- A Feasibility Study Report (FSR) is a formally documented output of feasibility study that summarizes results of the analysis and evaluations conducted to review the proposed solution and investigate project alternatives for the purpose of identifying if the project is really feasible, cost-effective and profitable.
- The importance of writing the report consists in providing legal and technical evidence of the project’s vitality, sustainability and cost-effectiveness.
- Regardless of project size, scope and type, there are several key steps to writing such an important document.
- The content of sample feasibility report is formatted and structured according to a range of requirements which may vary from organization to organization.
- One last thing you need to consider when writing your feasibility study report template is that the report should include a.
- Reference page that lists all reference material (articles, books, web pages, periodicals, reports, etc.) cited in your document.
- As the identification and intention for the implementation of the project grow, the depth of the study for the probable project increases.
- The report should be with sufficient details to indicate the possible fate of the project when implemented.
- The DPR deals with the financial estimates of the project operation for five to eight years from the start of the commercial production.
- The DPR also shows the capability of the project to serve the borrowings for its implementation
- Pre-tendering will always take place after contractor received notice of tender which usually being advertised through electronic medium or convention medium that is through newspaper.
- Post tendering is a pre-contract activity and, as such, it is more flexible in its approach. It does relate back to a milestone document (i.e.,
the tender return) but it is not limited to the works carried out under the contract.
References:
- Cost-Benefit Analysis for Project Appraisal Per by Olov Johansson
- Project Appraisal and Valuation of the Environment: General Principles and Six Case-Studies in Developing Countries by P. W. Abelson
- Strategic Project Risk Appraisal and Management by Elaine Harris
- Project Appraisal and Financing by Ambrish Gupta.