Unit - 6
Introduction to Geodetic Survey, Hydrograph Survey & Arial Photogrammetry
Key Takeaways:
It is also called as trignometrical surveying and it differs from plane surveying. In geodetic surveying, curvature of earth surface is considered, and it involves the very large areas and very large distances.
Geodetic surveying mainly involves two operations namely:
Following are the important object or purpose of geodetic surveying:
Key Takeaways:
Geodetic surveying is used to precisely determine the relative positions of a system of widely separated points on the surface of the earth. It is also used to find the absolute positions of the various points on the surface of the earth.

Fig.6.1: Well conditioned triangle
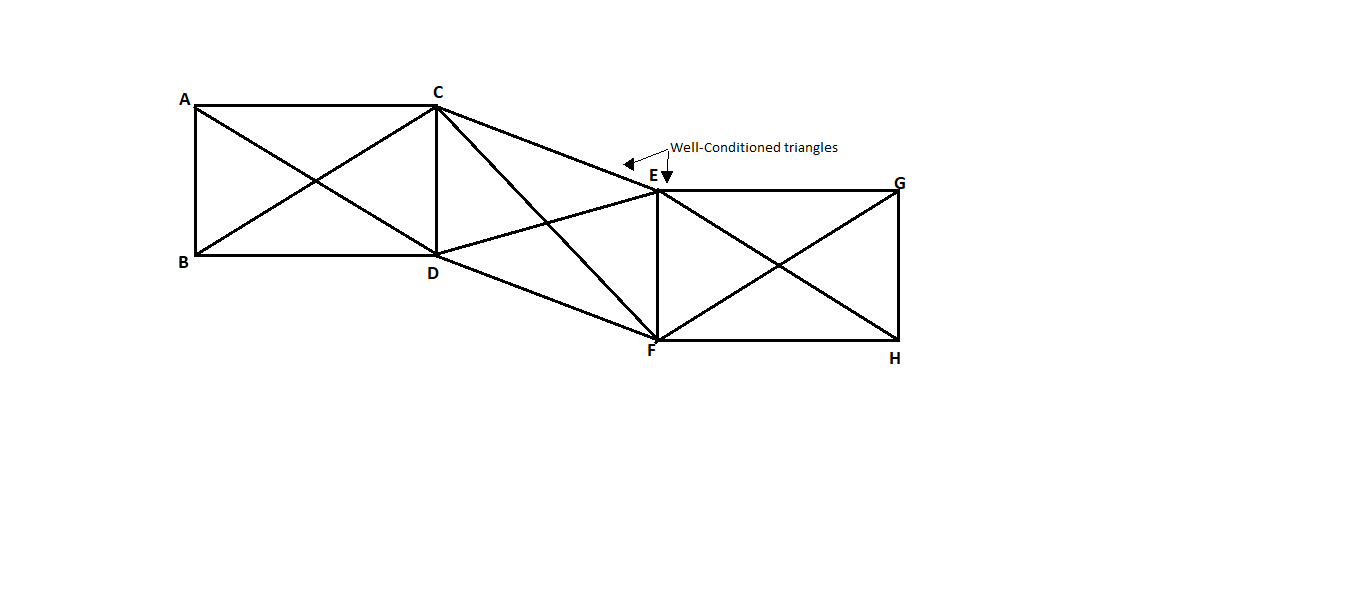
Fig.6.2: Quadrilaterals
Key Takeaways:
The method of measuring the chain angles of a framework of triangle being formed by marking the station on the surface of earth is called as triangulation.
Key Takeaways:
The trilateration consist of series of connected triangles are measured with high degree covering area to be surveyed in which length of all sides of triangle are measured by EDM.
Following are the various uses of triangulation in geodetic surveying.
Key Takeaways:
Object of triangulation is the find the size and shape of the earth surface by performing the various observations for latitude, longitude and gravity.
Based upon the degree of accuracy required, length of the base, length of the sides, the extent of the area for which the survey to be done, the triangulation system is classified into three divisions, namely-
1. Primary triangulation or first order triangulation
Specification for primary triangulation system:
The common and general specifications for the primary triangular system or first order triangulation are given below:
2. Second order triangulation or secondary triangulation
Specification of secondary triangulation or second order triangulation are given below:
3. Third order triangulation and tertiary triangulation
Specification of third order triangulation and tertiary triangulation:
The common and general specification triangulation are given below:
Key Takeaways:
The triangulation system is classified into three divisions, namely-
Following geometrical figures are commonly used in triangulation system:

Fig.6.3: A single chain of triangle
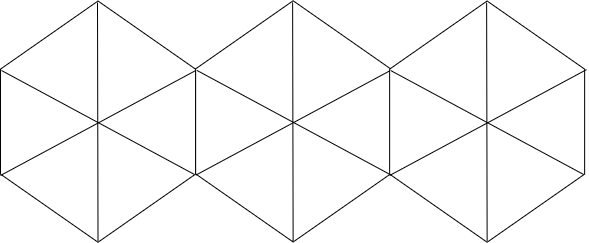
Fig.6.4: A chain of hexagon
Gridiron system:
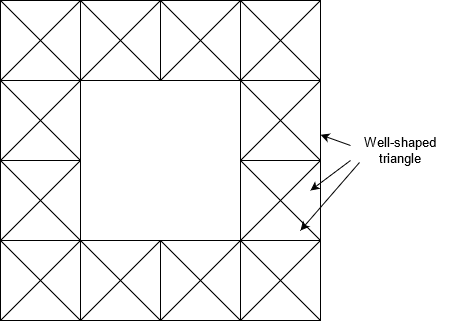
Fig.6.5: Gridiron system
Central system:
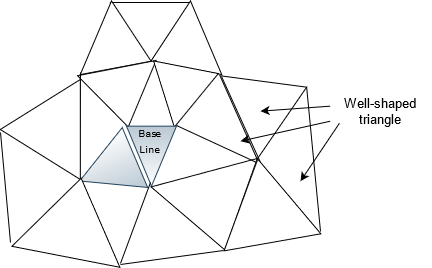
Fig.6.6: Central system
Key Takeaways:
Following geometrical figures are commonly used in triangulation system:
sin 30º = 0.5
sin 30°, 30’ = 0.5075
Change: 0.5075-0.5 =7.5 x 10^-3
sin 70° = 0.9396
sin 70°, 30’ = 0.9426
Change: 0.9426-0.9396=3x10⁻³
From above examples it has been observed that, for a change of 30', the value of sin of 30° changes about twice the value of 70°.
L2= 2
2 )
)
Where, L² = Square of the probable error
d = Probable error of an observed direction in seconds
C= Number of conditions to be satisfied in each Figure
D = Number of directions observed which are forward and backward excluding the directions along the known side.
 = Difference/second in the 6th place of logarithm of the sine of the distance angles A and B respectively (In this case, third angle is an azimuth angle) R represents the strength of figures.
If R =  )
)
The Equation (i) can be written as follows,
L² =4/3 d2R
Factors on which the value of R depends:
Following are the various factors on which the value of R depends:
(i) Magnitudes of the distance angles A and B.
(ii) Number of observed directions (D)
(iii) Number of geometric conditions (C) To find the value of 'C', the following expression is used.
To find the value of ‘C’, the following expression is used
C = (n'-s'+1) +(n-2s + 3) … (2)
Where, C =number of geometric conditions
S = Total number of stations
s' = Number of stations occupied
n = Total number of lines including known side
n'= Number of lines observed in both directions including known side.
Values of C and D for some simple figures:
Simple figures are:
(1) Braced quadrilateral figure
(2) Single triangle figure
(3) Four-sided central - point figure without diagonals.
(4) Four-sided central point figure with one diagonal.
1. Braced quadrilateral figure:
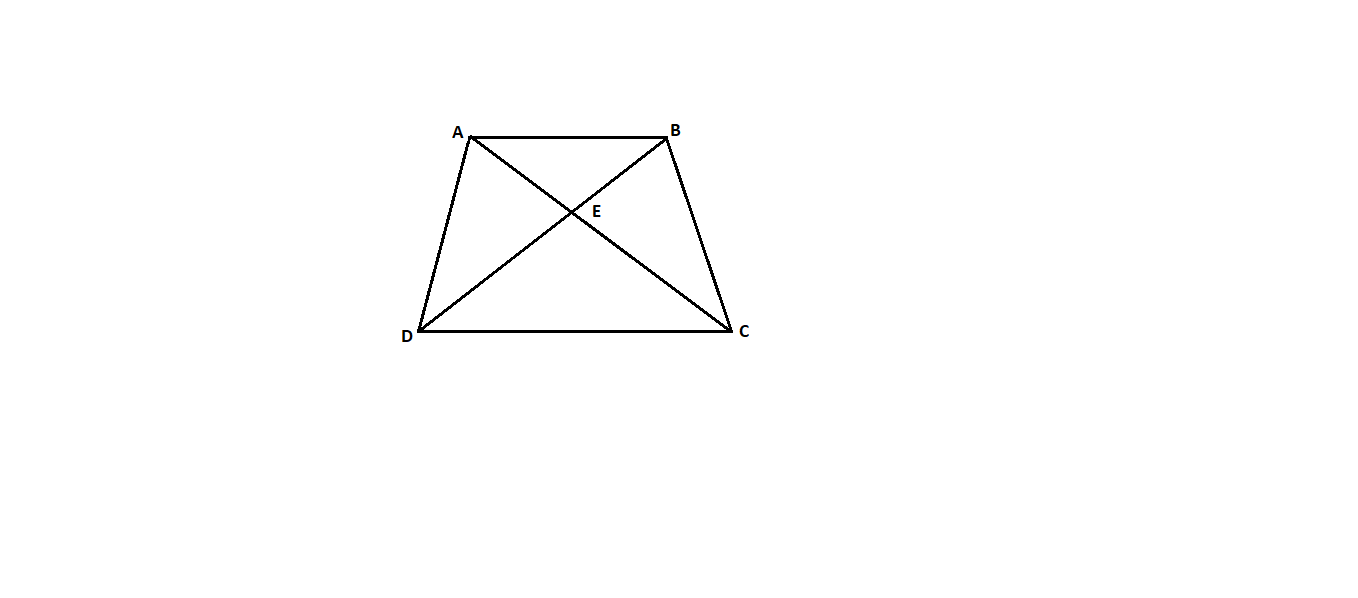
Fig.6.7: Braced Quadrilateral
From Equation (ii), we know,
C = (n'-s'+1) + (n - 2s + 3)
From braced quadrilateral we know,
n= Total number of lines (including known side) = 6,
S = Total number of stations = 4
s' = Number of stations occupied = 4
n' = number of lines observed in both directions including known side 6
∴C = (6-4+1) +(6-2x4+ 3) = 4
D = Number of directions observed (forward and backward) excluding those along known side = 5× 2 = 10
 =0.6
=0.6
2. Single triangle figure:
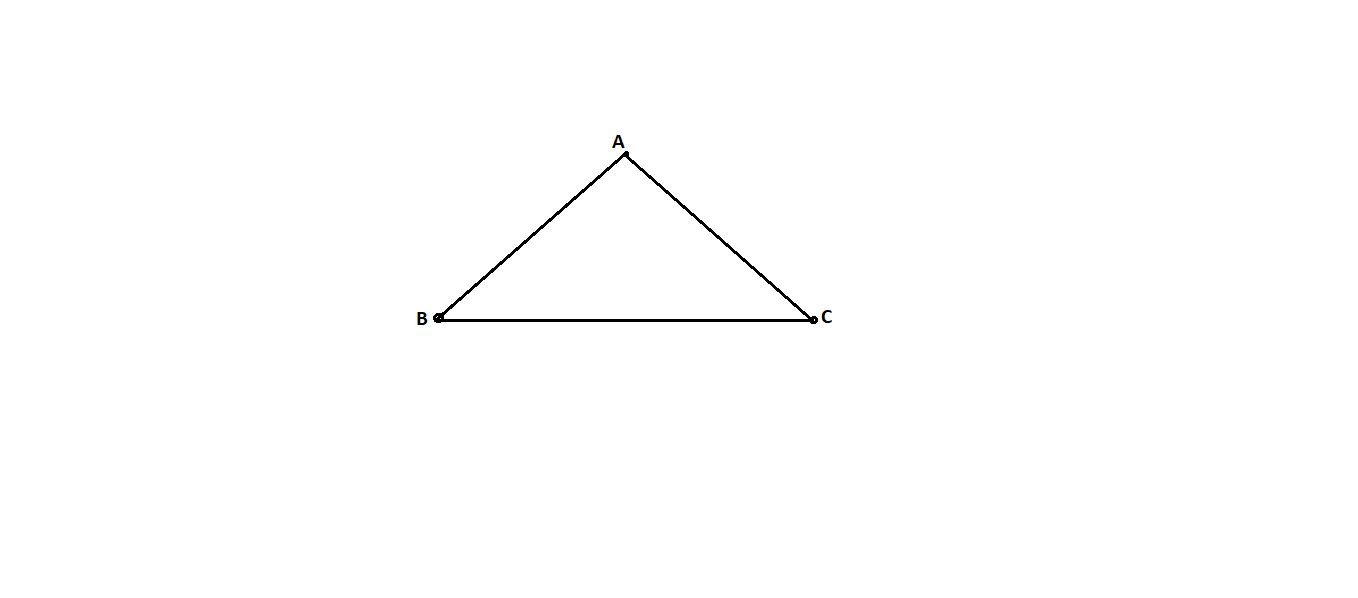
Fig.6.8: Single Triangle
From Fig., we know,
n=Total number of lines including known side = 3
S = Total number of stations = 3
n’=Number of lines observed in both directions including known side = 3
s’=Number of stations occupied= 3
C=(n'-s'+1) +(n-26+3)
= (3-3+1) (3-2x3+3)
∴C = 1+6-6=1
Forward directions AB + BC = 2, Backward direction =CB + BA = 2
D = 2+2= 4, (Excluding one known side)
(D-C)/D= (4-1)/4=0.75
3. Four-sided central point figure without diagonals:
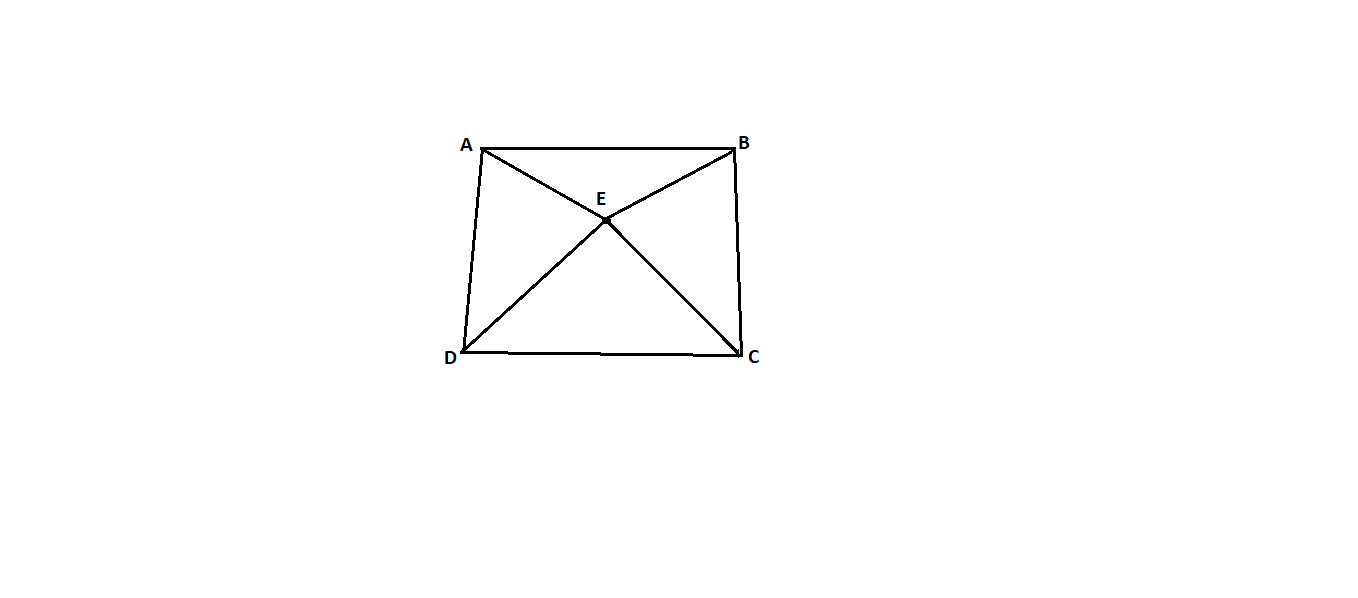
Fig.6.9: Four-sided central point figure without diagonals
Number of backward directions=BA+CB + DC + EC+ EB + EA + ED= 7
D = 7+7= 14, Or D = 2x7= 14
We know,
n = 8, n'=8, s=5, s' = 5
C = (n'-s'+1) + (n +2s + 3) = (8-5+1) + (8-2x5+ 3) = 5
(D-C)/D= (14-5)/14=0.64
4. Four-sided central-point figure with one diagonal:
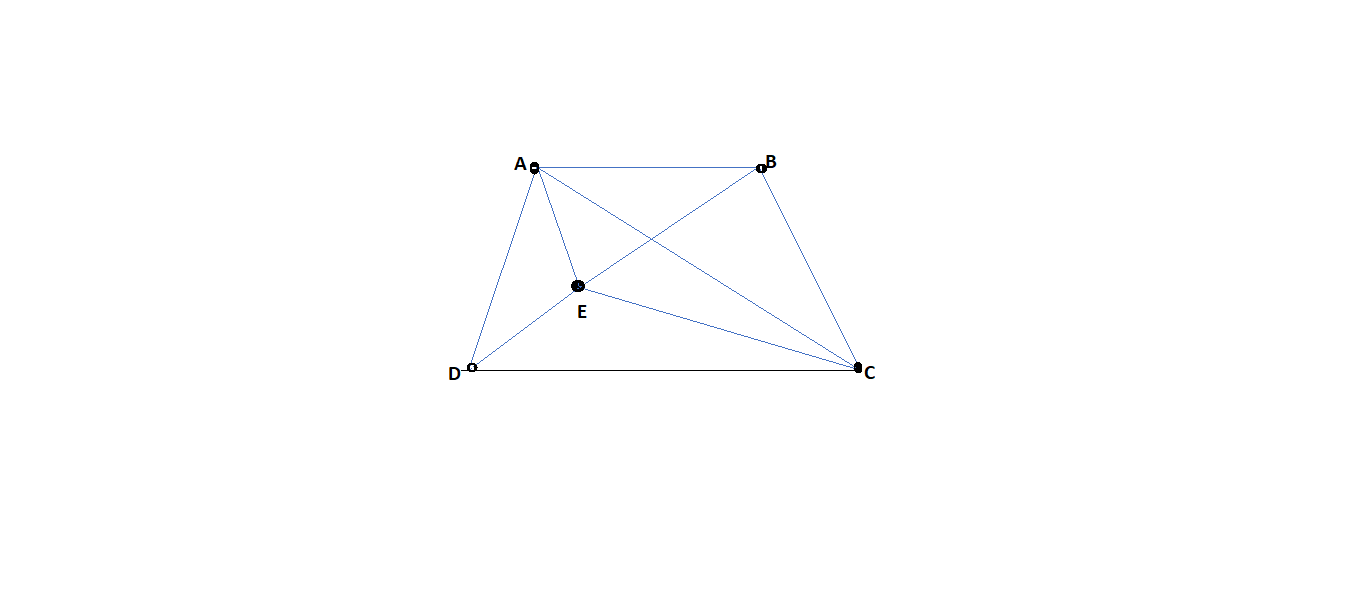
Fig.6.10: Four-sided central-point figure with one diagonal
From Fig.,
D = Number of directions observed (forward and backward excluding those along known side)
=2*8=16
n=9, n’=9, s=5, s’=5
C = (n'-s'+1) + (n -25+ 3) = (9-5+1) +(9-2*5+3) =7
(D-C)/D= (16-7)/16=0.56
Key Takeaways:
Simple figures are:
One second theodolite:
Construction:
Uses:
Electronic Total Station:
Advantages of Total Station over Level and Theodolite:
Use of Total Station:
Key Takeaways:
Electronic Total Station: An electronic total station means an E.D.M. and a digital theodolite built as one unit.
Key Takeaways:
Hydrography in which hydrographic survey can be carried out on or near the body of water like lake, river; docks and harbour, bay; stream etc.
Following are the various purposes or objects of hydrographic survey of the bodies containing still or running water:
Determination of bed depths are also helpful to find the location of underwater works, also helpful to compute the volume of underwater excavation and also useful for the purpose of planning of drainage work and irrigation work.
2. With the help of hydrographic survey, various characteristics and behaviour of bottom of bodies of water can be found out.
3. With the help of hydrographic survey, intensity of tides at sea coast can be measured.
4. With the help of hydrographic survey, areas subjected to scouring and silting can be rectified by determining the direction of current.
5. Hydrographic survey is also useful to measure the velocity, discharge and various characteristics of the flow of water. In such case, measurement of discharge is helpful to water supply schemes, power development, flood control etc.
6. Hydrographic survey is also useful to determine the direction of currents of water. Determination of direction of currents is useful for navigation and for location of sewer outfalls.
Following are the various applications of hydrographic surveying:
Following are the various objects or purpose of the shoreline survey:
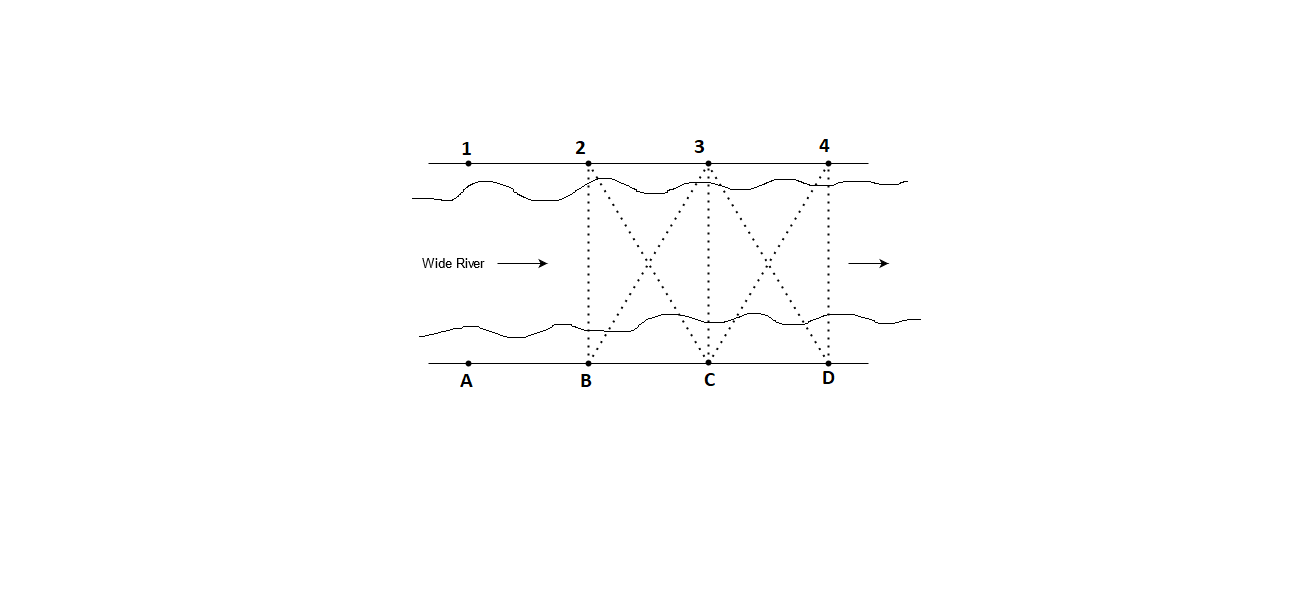
Fig.6.11: Shore line survey
Purpose of Sounding or uses of Soundings:
Following are the various uses of soundings in hydrographic surveying:
Key Takeaways:
Soundings are the measurements of depth below the water surface.
Soundings and their location can be done by the method’s direct method and indirect methods:
Sounding’s methods
1. Direct method
2. Indirect methods
1. Direct method
In this method, following equipments are commonly used, for taking soundings and their locations.
Sounding boat:
Sounding rods or poles:
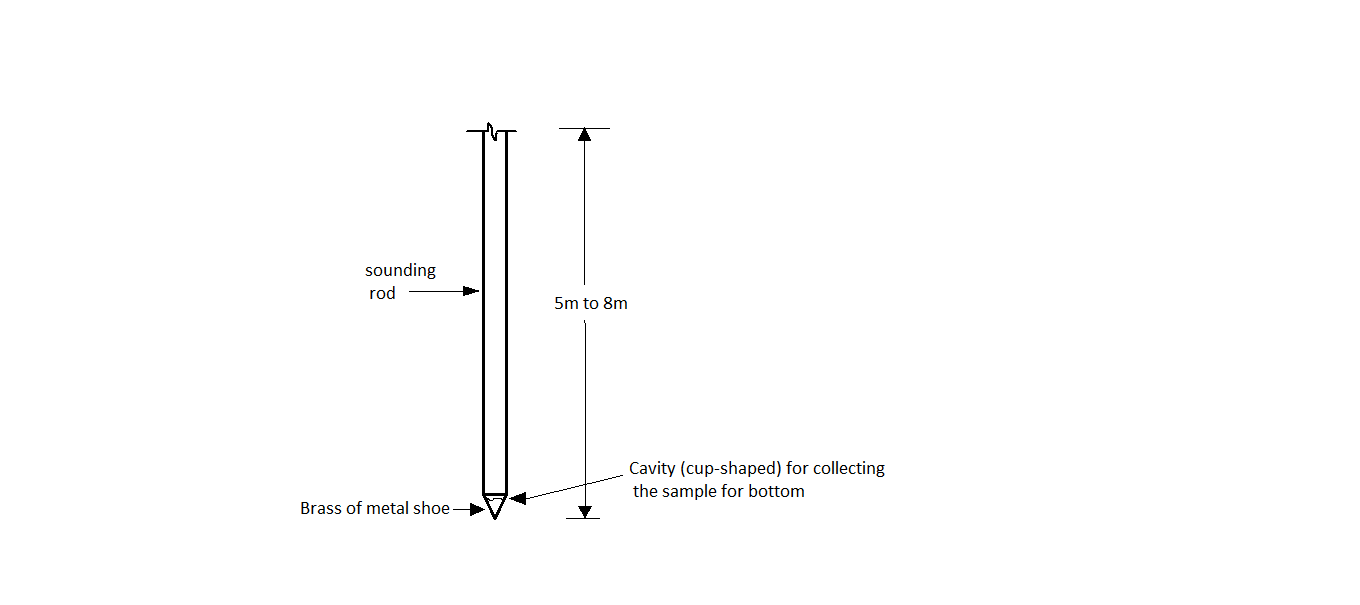
Fig.6.12: Sounding rod with cup shaped cavity
Lead lines Or Sounding Cables:
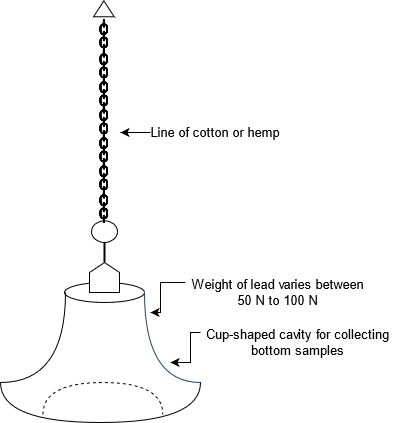
Fig.6.13: lead lines
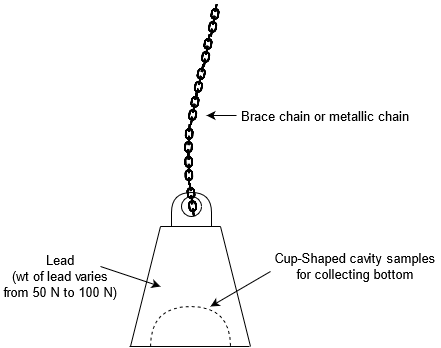
Fig.6.14: Lead lines
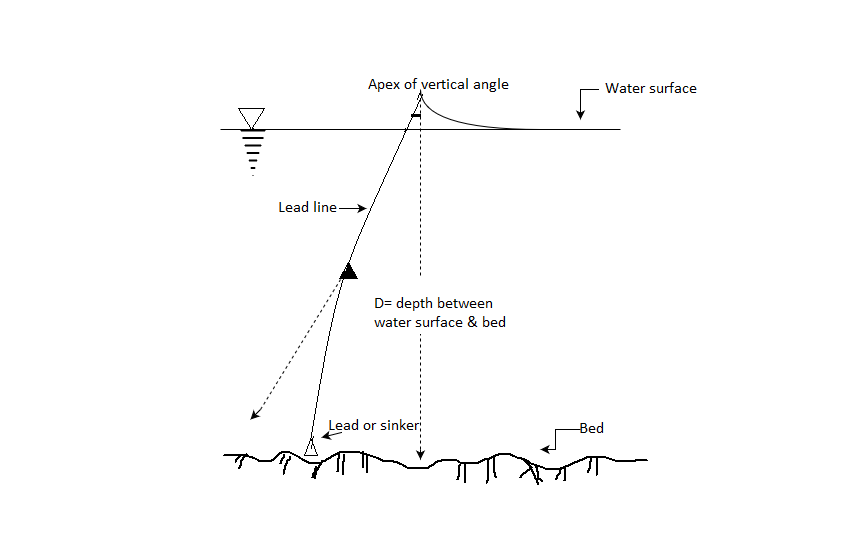
Fig.6.15: Sounding in deep and swift flowing water
Sounding machines:
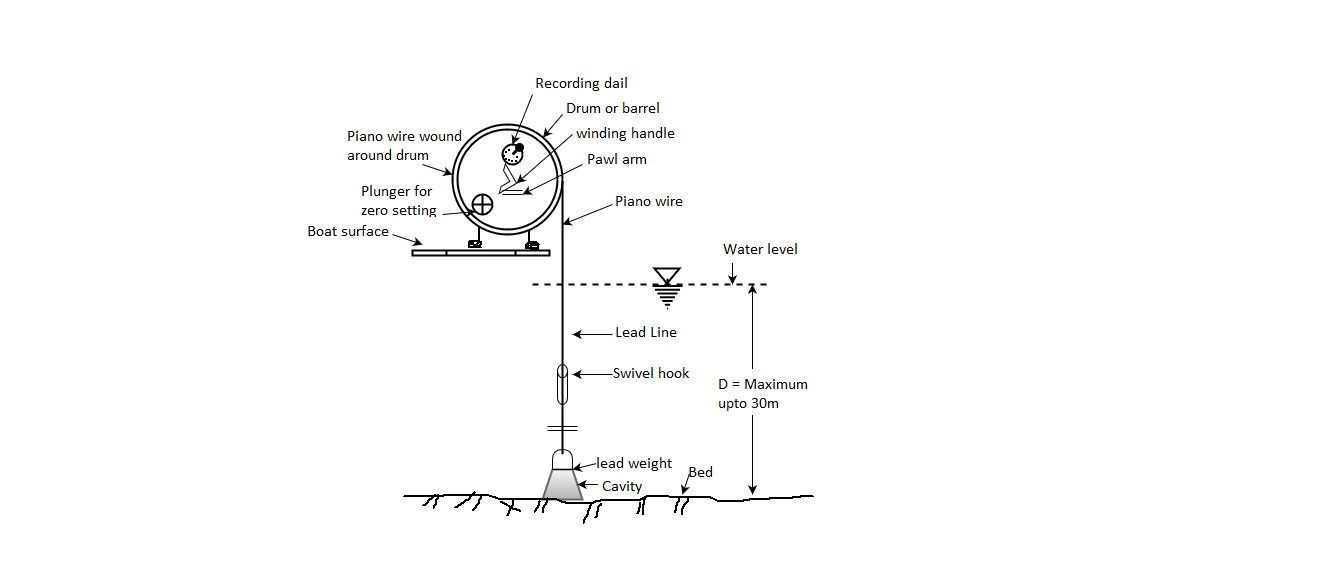
Fig.6.16: Hand driven sounding machine equipment
Sounding chain:
Indirect methods:
Fathometer or Echo-sounder
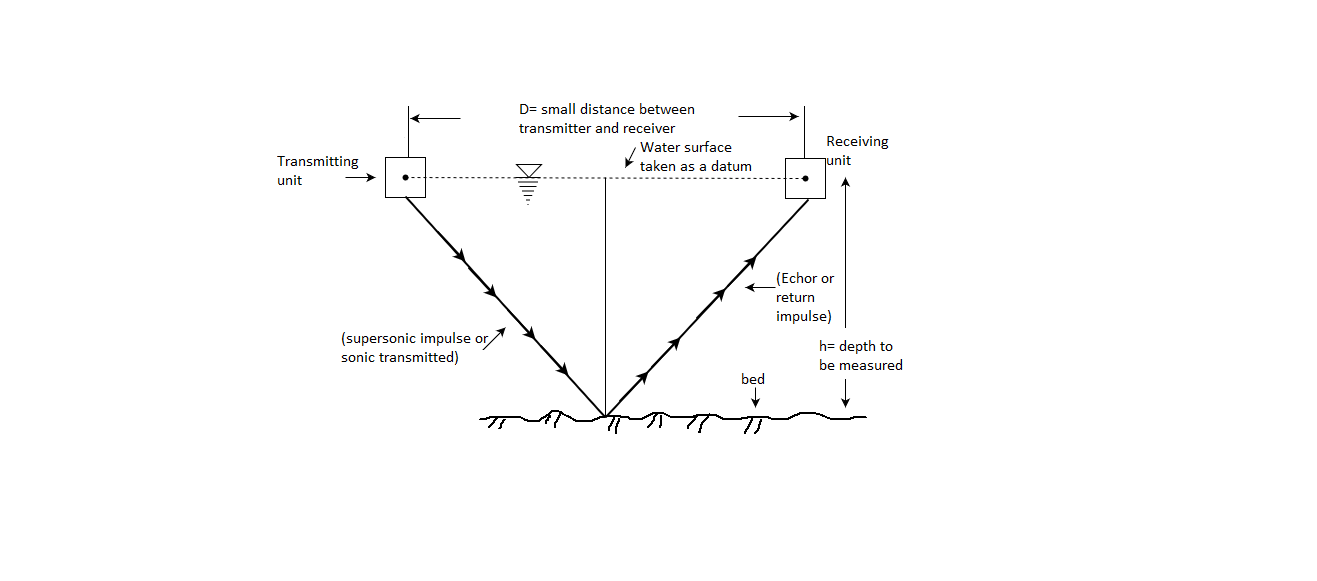
Fig.6.17: Operation of fathometer
The following expression shows the relation with respect to depth (h)
∴h=vt/2
Where,
V = speed of sound in water
T=time interval held between the transmission and reception of the signals.
Note that small correction is needed to apply because distance (D) between transmitter and receiver is small,
Key Takeaways:
Soundings methods are as follows:
1. Direct method
2. Indirect methods
2. Fathometer or Echo-sounder
Key Takeaways:
Stream gaging is a method used to degree the discharge, or the quantity of water transferring via a channel in keeping with unit time, of a flow.


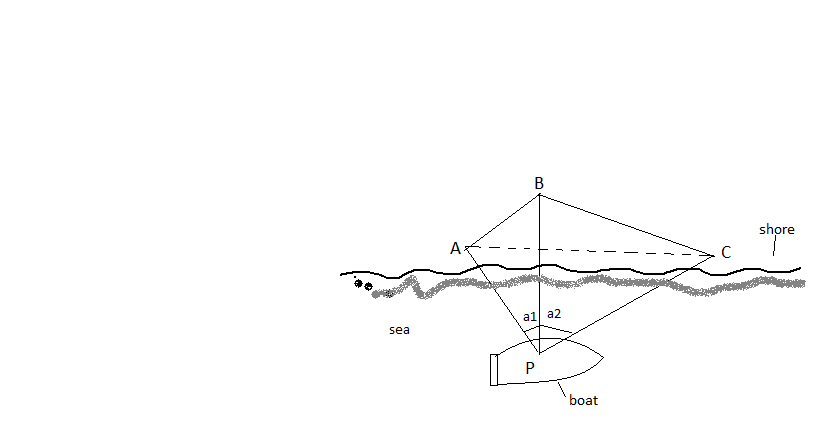
Fig.6.18: Three point problem
Mechanical Method:
There are two ways of using mechanical method either by using a tracing paper or by using a station pointer.
Hence following are two mechanical methods preferably used.
1. Three point problem solved by a station pointer
Procedure of using stational pointer


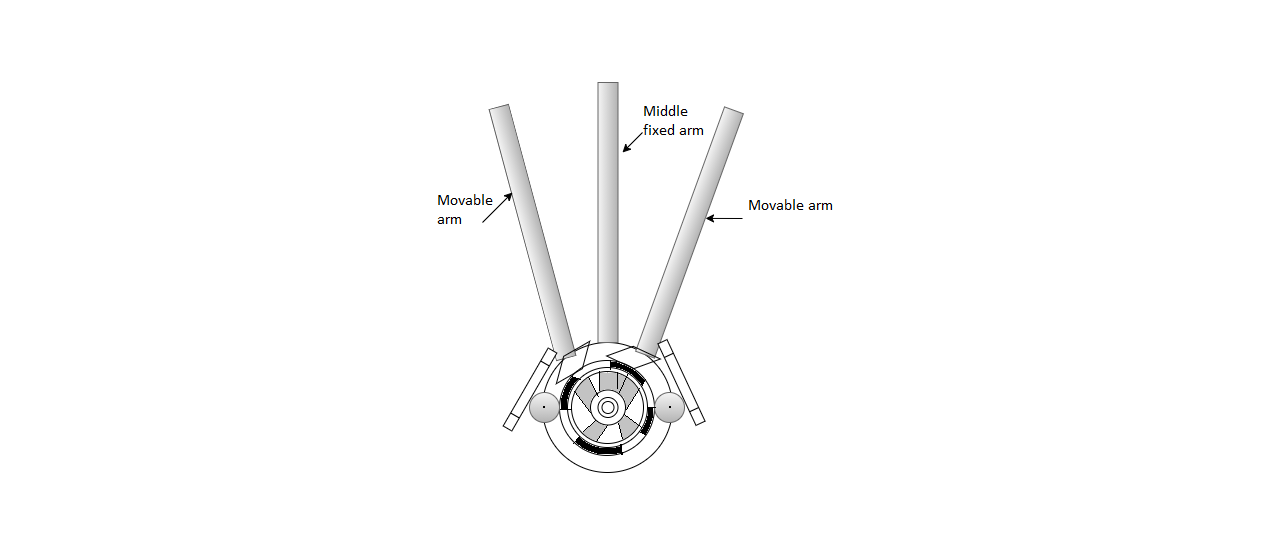
Fig.6.19: Station Pointer
2. Three-point problem solved by a tracing paper
Graphical Method:
There are three graphical methods mentioned as follows:
1. First graphical method
2. Second graphical method
3. Third graphical method
1. First graphical method
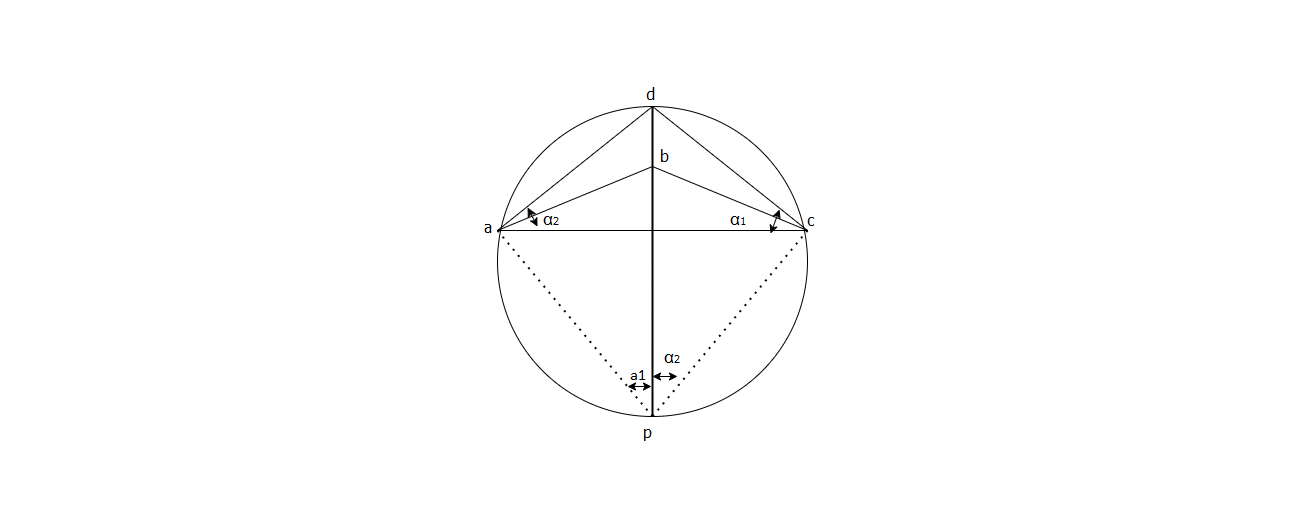
Fig.6.20: First graphical method
Procedure:
2. Second graphical method:
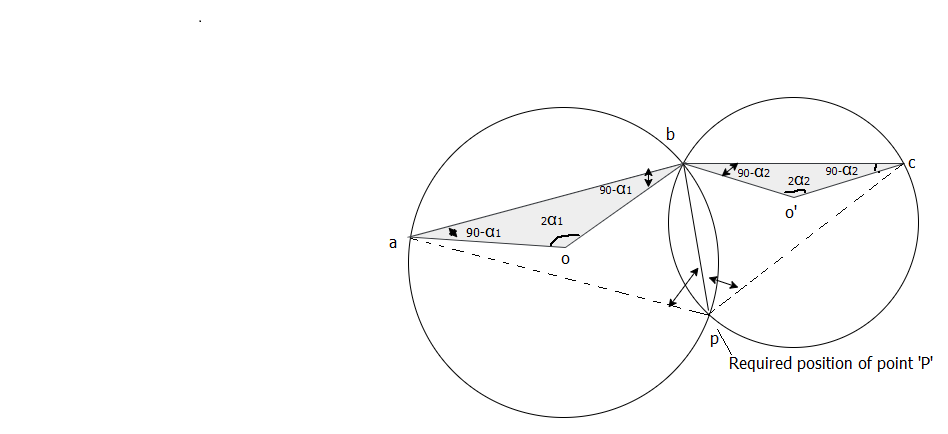
Fig.6.21: Second Graphical method
3. Third graphical method
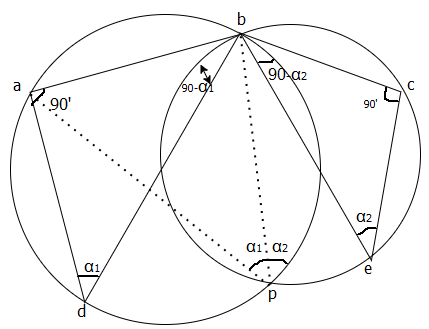
Fig.6.22: Third Graphical method
Key Takeaways:
Three point problem can be solved by three methods viz.
Aerial Photogrammetry is advance technique of obtaining the information (spectral, spatial, temporal) about material objects, area or phenomenon without coming into physical contact with objects or area, or phenomenon under investigation.
Following are the various objects of aerial photogrammetry:
There are two types of photogrammetry which are as follows:
Terrestrial photogrammetry
Aerial photogrammetry
Key Takeaways:
There are two types of photogrammetry:
Sr.No. | Maps | Aerial Photograph |
1 | Maps are plotted by actually taking the linear and angular measurements of the ground and terrain. | A photograph in which a photograph of terrain or ground at the time of exposure and showing all the details of the terrain is
called as aerial
photographs. |
2 | There is no distortion caused by tilt or relief displacement because these maps are prepared after taking the necessary and required measurements. | There is distortion of
details of terrain or ground caused by tilt and relief displacement. |
3 | Contour map which is plotted by carrying actual measurements can be used to determine the elevation of desired objects directly. | Elevation of the different objects or points cannot be taken directly. |
4 | Plotting of map and its reading is common and more familiar to users. Various details of various objects like roads, pond, river, valley, railway crossing, rail-lines, fence etc. can be shown by conventional signs and symbols. | The photo-views so obtained by aerial photographs are not familiar to the eyes of user and it needs a special technique to read the photo-views. |
5 | Plotting of map is economical. | Preparation of maps from aerial photography is uneconomical due to costly automatic plotting machines.
|
6 | Maps can be prepared by conventional methods of surveying. | Aerial photographs are prepared by aerial surveying which is a highly skilled job and also need highly skilled technician. |
7 | Preparation of map is a time-consuming process and need more time. | Preparation of aerial photographs require less time. |
8 | Maps prepared by conventional methods do not depict confusing details and easily recognizable. | Aerial photographs depict confusing details which are not easily identified. |
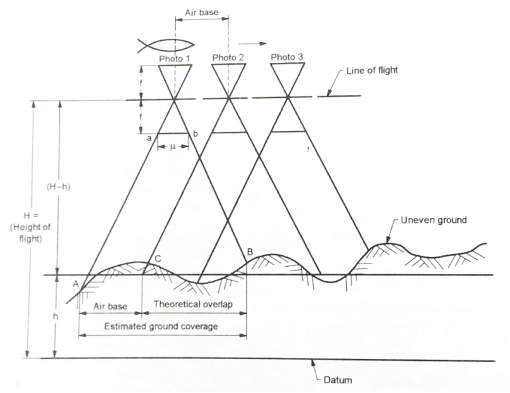
Fig.6.23: Vertical profile through a flight line
1. Longitudinal overlap or forward overlap:
2. Side overlap:
3. Drift:
4. Crab:
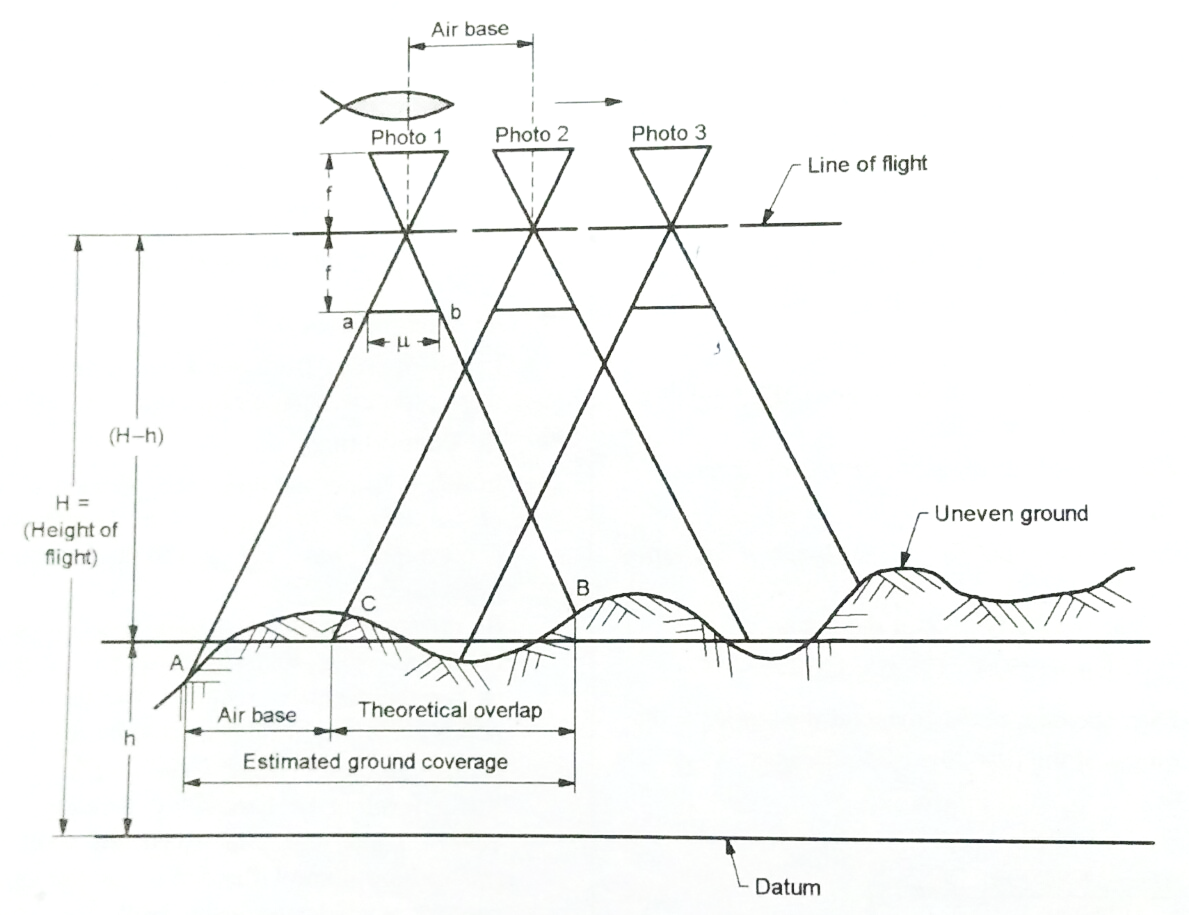
Fig6.24: Crab
Fig.6.25: Drift
5. Altitude of aircraft:
H= (Counter interval) x (C-factor)
Where, H = flying height
C-factor varies from 500 to 1500
H can also be computed by the following formula
S = f/(H-h)
Where,
S = Scale of photograph;
F= Focal length of camera
H = Flying height;
h = Elevation of the ground above m.s.l.
6. Area covered by one photograph:
Key Takeaways:
Flight planning consists of the following information:
L = (1-P₁) SI
Where, P=Longitudinal overlap
1 = Length of the photograph in the direction of flight
S = Scale of a photograph
Where, P = Side overlap
S = Scale of a photograph
W =Width of the photograph normal to the direction of flight
Consider N₁ =Number of photographs in each strip
N₂ = Number of strips required
N₁ = +1
+1
Where, L₁= Length of the area
P₁ = Longitudinal overlap
S = Scale of a photograph
1 = Length of the photograph in the direction of flight
N2= +1
+1
Where, B₁= Width of the area
Pw= Side overlap
S = Scale of photograph
W= Width of the photograph normal to the direction of flight
Hence number of photographs required =N₁ X N₂
References: