Unit-4
Graph-Theory
Graph Terminology:
Graph: A graph (V,E) is an ordered pair , whose V is finite non empty set elements are called vertices and ‘E’ is a set of un-ordered pair of distinct vertices of ‘V’.
i.e. (V, E) – where V is Finite non empty set
where is E is unordered pairs (edges)
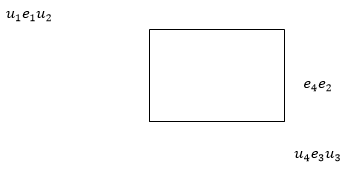
Example 1: 
2: V =  , E =
, E =
Note 1: Vertices is also known as points,nodes and functions
2: Edge is also as line,are branch and link
3. If the edge e = then u and v are both said to be incident with ‘e’ and adjacent to each other u
4. If e=u,v and e’=v,w are edges is G ,then we say that edges e and e’ are adjacent edges
Simple graph:
Multi Graph: A multi graph G=(V,E) is an ordered pair of sets ,where ‘V’ is finite and non-empty set and ‘E’ is set of un-ordered pairs of distinct elements of v and repetitions are allowed in the classes.
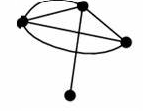
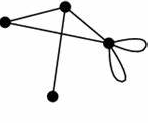
Pseudo Graph: A Pseudo graph G=(V,E) is ordered pairs ,where ‘v’ is finite and non-empty E is set of un-ordered pairs of distinct elements of V and repetitions are allowed in the classes.
Note: Multi-graph and Pseudo-graph same but self loop in the pseudo.
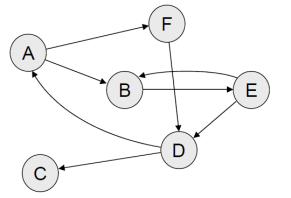
Dia –Graph: A dia-graph G=(V,E) is an ordered pair, where ‘v’ is non-empty finite set and E is the set of unordered pairs of distinct vertices of V.
Weight –Graph: A graph or dia-graph G= (V,E) is said to be weighted graph if there-exist a functions w:E which assign a real number to each edge.
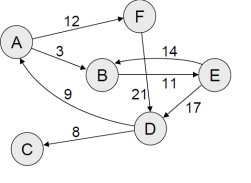
Note: If u=u.v is an edge in a weighted graph then its weight is denoted by  .
.
Source: Let G=(V,E) be a dia-graph . A vertex which has no arcs directed towards it is called source.
Sink: A vertex which has no arcs directed away from it. Then it is called sink.
Network: A network is a dia-graph which possess exactly one source and one sink, the vertices of a network are called nodes.
Label –Graph: A graph is which all the vertices are distinct variables one from other (or) another is called Label graph


Isomorphic Graph: Let  be two graph then
  ,
, are said to be isomorphic if they have same number of vertices and same number of edges.
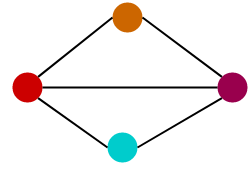
Non Isomorphic Graphs:
Connected –Graphs: A graph is said to be connected-graph if every pair vertices in G are joined by a path.
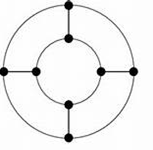
Dis-Connected Graph: A graph which is not connected is called dis-connected graph.
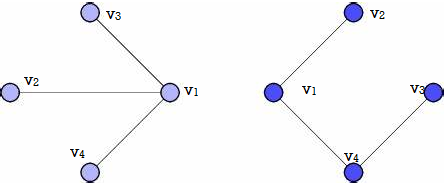

A Cyclic-Graph: A Graph without cycles is called as A-cyclic graph.
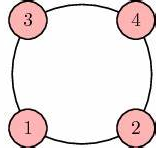
Sub Graph:A Graph is said to be Sub-graph of G if all the vertices and all the edges of g are on G, and each edge of g has same and vertices in g as in G.
Null-graph: A graph G=(V,E) is said to be a null-graph if it has no edges.
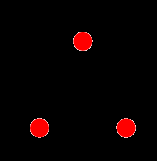
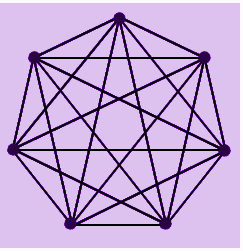
Complete graph:A Graph G=(V,E) is said to be complete graph if every pair of vertices are directly connected by single edge.
Graph isomorphism:In graph theory, an isomorphism of graphsG and H is a bijection between the vertex sets of G and H
f: V(G) V(H)
V(H)
such that any two vertices u and v of G are adjacent in Gif and only iff(u) and f(v) are adjacent in H. This kind of bijection is commonly described as "edge-preserving bijection", in accordance with the general notion of isomorphism being a structure-preserving bijection
If an isomorphism exists between two graphs, then the graphs are called isomorphic and denoted as G . In the case when the bijection is a mapping of a graph onto itself, i.e., when G and H are one and the same graph, the bijection is called an auto morphism of G.
Graph isomorphism is an equivalence relation on graphs and as such it partitions the class of all graphs into equivalence classes. A set of graphs isomorphic to each other is called an isomorphism class of graphs.
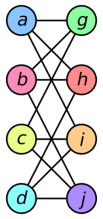
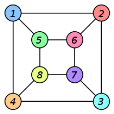
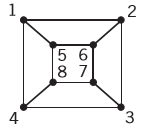
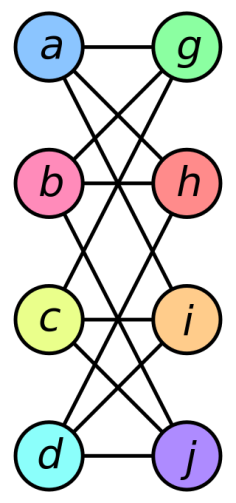
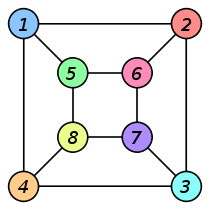
The two graphs shown below are isomorphic, despite their different looking drawings.
EXAMPLE 1:
SOLUTION: The isomorphism for the above is,
f(a)=1, f(b)=6,f(c)=8,f(d)=3,f(g)=5,f(h)=2,f(i)=4,f(j)=7.
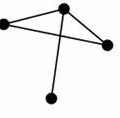
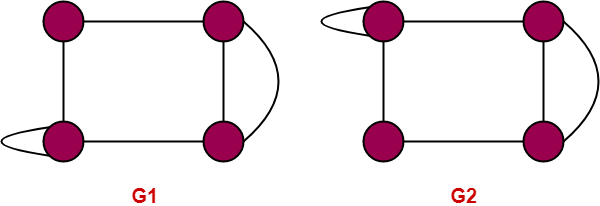
Example 2:Are the two following graphs are isomorphic?

Solution:
We check the necessary and sufficient conditions for the given graphs to be isomorphic
Condition 1:number of vertices in G1 =4
Number of vertices in G2= 4
Here both G1 and G2 have same number of vertices hence the condition satisfied.
Condition 2: number of edges in G1 = 5
Number of edges in G2 = 6
Here they are not equal, therefore the condition is not satisfied.
Hence the given graphs are not isomorphic.
Connectivity:
A graph is a connected graph if, for each pair of vertices, there exists at least one single path which joins them. A connected graph may demand a minimum number of edges or vertices which are required to be removed to separate the other vertices from one another. The graph connectivity is the measure of the robustness of the graph as a network.
In a connected graph, if any of the vertices are removed, the graph gets disconnected. Then the graph is called a vertex-connected graph. On the other hand, when an edge is removed, the graph becomes disconnected. It is known as an edge-connected graph.
There are different types of connected graphs explained in Maths. They are:
Let us learn them one by one.
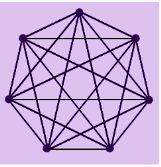
Example.1: If a complete graph has a total of 20 vertices, then find the number of edges it may contain.
Solution: The formula for the total number of edges in a k15 graph is given by;
Number of edges = 
=
=10(19)
=190
Hence, it contains 190 edges.
Example.2: If a graph has 40 edges, then how many vertices does it have?
Solution: As we know,
Number of edges = = 
40 = 
n(n-1) = 80
n2 – n – 80 = 0
On solving the above quadratic equation, we get;
n ≈ 9.45, -8.45
Since, the number of vertices cannot be negative.
Therefore, n ≈ 9
Euler Path: An Euler’s path contains each edge of ‘G’ exactly once and each vertex of ‘G’ at least once. A connected graph G is said to be traversable if it contains an Euler’s path.
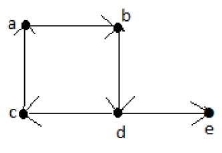
Euler’s Path = d-c-a-b-d-e.
Example 1: Find the Eulerpath for the following figure
Solution:
The graph G1has anEuler circuit for example a,e,c,d,e,b,a has Euler circuit. Neither of the graphs G2 OR G3 has Euler circuits.G3 has an Euler path but not the circuit.
Example 2: Find the Euler path for the following figure.
Solution:
The graph H2 has a Euler circuit i.e., a,g,c,b,g,e,d,f .Neither H3 or H1 has the Euler path but namely H3 has Euler path but not the circuit.
Hamiltonian Path: Hamilton path is a path in a directed or undirected graph that visits each vertex exactly once. The problem to check whether a graph (directed or undirected) contains a Hamiltonian Path is NP-complete, so is the problem of finding all the Hamiltonian Paths in a graph. Following images explains the idea behind Hamiltonian Path more clearly.
Example 1: solve the following graph for Hamilton-path.
Solution:
G1 has a Hamilton circuit at a,b,c,d,e,a. There is no Hamilton-circuit in G2 but it has a Hamilton-path.G3 neither has a Hamilton-circuit or path.
Example 2: Solve the following graph using Hamilton-path
Solution:
There is no Hamilton-circuit in G because it has only one degree namely ‘e’. But it has a Hamilton-path namely e,d,a,b,c.
Now consider the graph H, where the degree of the vertices a,b,d and e are all 2every vertices incident to these vertices must be a part of Hamilton circuit.It is now easy to say that there is no Hamilton-circuit in the Graph H also.And H has a path a,b,c,d,e.
Handshaking-Lemma:
Statement:
In any graph G=(V,E),there are even number of vertices of odd-degree.
Proof:
Suppose G=(V,E) be a graph.
Now put A ={V  / d(V) is an odd number}
Put B = V-a = { U u/d(u) is an even number}

Now we have

Even=  +even
+even
By a known theorem,
We get  = even number…..(1)
Now, since ‘A’ is finite set (A we can write
{
By a known definition d(Vi) is an odd number
 and ti
Now,


We get ‘n’ as an even number
 ’a’ is consisting of even no.of vertices.
Hence there are even number of vertices with odd degree.
Example1:A simple graph G has 24 edges and degree of each vertex is 4. Find the number of vertices.
Solution: Given number of edges =24
Degree of each vertex =4
Let number of vertices in the graph =n
Using Hand-shaking theorem we have
Sum of degree of all vertices = 2  number of edges.
By substituting the values we get,
N  4 = 2
4 = 2
 N =12
N =12
Thus, number of vertices in the graph =12
Example 2: A graph contains 21 edges, 3 vertices of degree 4 all other vertices of degree 2. Find total number of vertices.
Solution: Given
Let number of vertices in the graph = n
Using Handshaking Theorem,we have
Sum of degree of all vertices = 2
Substituting the values,we get
3
12+2n-6=42
2n=42-6
2n=36

Thus,total number of vertices in the graph= 18
Dijkstra’s algorithm is very similar to prim’s algorithm for minimal spanning tree.
Here we generate a minimal spanning tree with shortest distance between the starting and ending point of a graph.
The Dijkstra’s algorithm is stated below:
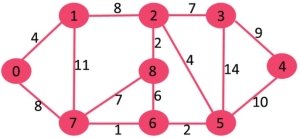
Example: Find the minimal spanning tree of shortest distance for the following graph.
Solution:
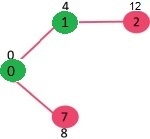
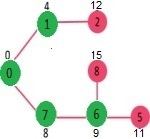
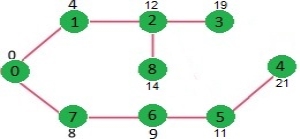
The set sptSet (shortest path tree set)is initially empty and distances assigned to vertices are {0, INF, INF, INF, INF, INF, INF, INF} where INF indicates infinite. Now pick the vertex with minimum distance value. The vertex 0 is picked, include it in sptSet. So sptSet becomes {0}. After including 0 to sptSet, update distance values of its adjacent vertices. Adjacent vertices of 0 are 1 and 7. The distance values of 1 and 7 are updated as 4 and 8. Following sub graph shows vertices and their distance values, only the vertices with finite distance values are shown. The vertices included in SPT are shown in green color.
Pick the vertex with minimum distance value and not already included in SPT (not in sptSet). The vertex 1 is picked and added to sptSet. So sptSet now becomes {0, 1}. Update the distance values of adjacent vertices of 1. The distance value of vertex 2 becomes 12.
Pick the vertex with minimum distance value and not already included in SPT (not in sptset). Vertex 6 is picked. So sptSet now becomes {0, 1, 7, 6}. Update the distance values of adjacent vertices of 6. The distance value of vertex 5 and 8 are updated
We repeat the above steps until sptSet does include all vertices of given graph. Finally, we get the following Shortest Path Tree (SPT).
A graph 'G' is said to be planar if it can be drawn on a plane or a sphere so that no two edges cross each other at a non-vertex point.
Example
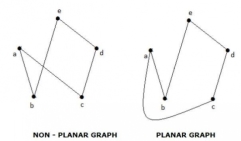
Regions
Every planar graph divides the plane into connected areas called regions.
Example 1:
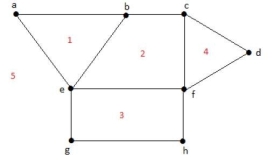
Solution: Degree of a bounded region r = deg(r) = Number of edges enclosing the regions r.
deg(1)=3
deg(2)=4
deg(3)=4
deg(4)=3
deg(5)=8
example 2:
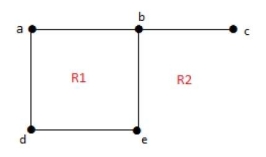
Solution: Degree of an unbounded region r = deg(r) = Number of edges enclosing the regions r.
deg(
deg(
In planar graphs, the following properties hold good −
n ∑ i=1 deg(Vi) = 2|E|
n ∑ i=1 deg(ri) = 2|E|
Based on the above theorem, you can draw the following conclusions −
In a planar graph,
K|R| = 2|E|
K|R| ≤ 2|E|
K|R| ≥ 2|E|
Note− Assume that all the regions have same degree.
3. According to Euler's Formulae on planar graphs,
|V| + |R| = |E| + 2
|V| + |R|=|E| + (K+1)
Where, |V| is the number of vertices, |E| is the number of edges, and |R| is the number of regions.
4. Edge Vertex Inequality
If 'G' is a connected planar graph with degree of each region at least 'K' then,
|E| ≤  - 2{|v|-2}
You know, |V| + |R| = |E| + 2
K.|R| ≤ 2|E|
K(|E| - |V| + 2) ≤ 2|E|
(K - 2)|E| ≤ K(|V| - 2)
|E| ≤  - 2{|V| - 2}
5. If 'G' is a simple connected planar graph, then


There exists at least one vertex V∈ G, such that deg(V) ≤ 5
6. If 'G' is a simple connected planar graph (with at least 2 edges) and no triangles, then

Graph coloring:
Coloring a graph is nothing more than assigning a color to each vertex in a graph, making sure that adjacent vertices are not given the same color.
Example 1: color the following graph
Solution:
Let's color the graph shown above in above figure. We will start using vertex P.
Vertex P: We will color this vertex blue.
Vertex Q: Since Q is adjacent to P, we cannot assign blue to it. We will color it red.
Vertex R: Since vertex R is adjacent to Q and P, we cannot assign blue or red to it. We will color it green.
Vertex S: Since S is adjacent to P, Q and R, we cannot assign it any of the previous colors. We will color it purple.
![C:\Users\RENU\AppData\Local\Microsoft\Windows\Temporary Internet Files\Content.IE5\PM2HC7YU\coloring_a_graph[1].png](https://glossaread-contain.s3.ap-south-1.amazonaws.com/epub/1643150450_4146028.png)
Example 2:
![C:\Users\RENU\AppData\Local\Microsoft\Windows\Temporary Internet Files\Content.IE5\PM2HC7YU\coloring_a_graph_example_2[1].png](https://glossaread-contain.s3.ap-south-1.amazonaws.com/epub/1643150450_4607158.png)
Solution:
Let us color the PQRS graph in the above figure starting with vertex P.
Vertex P: Let's assign it the color blue.
Vertex Q: Q is adjacent to P. We cannot assign it the same color as P. We will color it red.
Vertex R: R is adjacent to Q. We cannot assign it the same color as Q. We will color it blue.
Vertex S: S is adjacent to P. We cannot assign it the same color as R. We will color it red.
The colored graph would look like the one in the below figure.
![C:\Users\RENU\AppData\Local\Microsoft\Windows\Temporary Internet Files\Content.IE5\VEI2B21K\colored_graph_pqrs[1].png](https://glossaread-contain.s3.ap-south-1.amazonaws.com/epub/1643150450_5078757.png)

