UNIT - 1
Digital Control System
A digital control system basically consists of digital computers used as controller devices. A digital controller has a versatility that its control function can be easily modified by providing change in instructions. These controllers accept the data as the short duration pulse.

Figure: Sampled Data control system
The sampler and A/D converters are needed at the input end. The sampler converts the continuous time error signal into a sequence of pulses. These signals are in binary form and hence, provided to the D/A converter. This continuous time signal then controls the plant.
Sampled data technique is the most efficient technique for long distance data transmission. The signal sampling reduces the power demand on signal and helps the signal with low power.
Advantages:
- Unlike analog system the digital system has less power consumption.
- They are more reliable.
- They have decision making ability which is the need of present time.
- They can handle non-linear systems.
- These systems are smaller in size and hence have very less weight.
- They are highly accurate as they work on the present data.
Limitations:
- Due to conversion of analog signal to digital system stability is affected.
- There is loss of information due to the conversion of signal from one form to another at the sending and receiving end.
- The mathematical analysis of the signal from controller is complex compared to continuous data control.
- There is delay in the signal due to the converter A/D and D/A.
The analog signal available is first converted to digital form by rounding off of the values which are approximately equal to the analog values.
The method of sampling takes a few points on the analog signal and then connect them to the approximated values calculated to get the nearest stabilised values. This process is called as Quantization.
The conversion of signals from analog into digital form and vice-versa is performed by A/D and D/A converters.
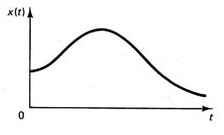
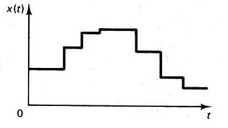
Fig: Original Signal Fig: Quantised Signal
Sampling usually refers to conversion of continuous signal into short duration of pulses each pulse followed by a skip period when no signal is available. Below shown is a uniformly sampled signal.
Following are two popular sampling operations:
1. Single rate or periodic sampling
2. Multi-rate sampling
Figure below shows the structure and operation of a finite pulse width sampler, where (a) represents the basic block diagram and (b) illustrates the function of the same. T is the sampling period and p is the sample duration.

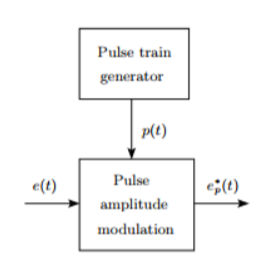
Figure (a): Basic block diagram
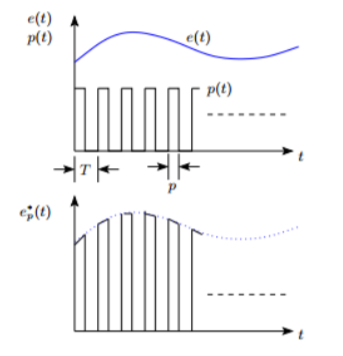
Figure (b): Sampler output
Finite pulse width sampler converts a continuous time signal into a pulse modulated or discrete signal. The most common type of modulation in the sampling and hold operation is the pulse amplitude modulation.
The block diagram of sampler is shown above, having a pulse train of p seconds and sampling period of T seconds.
p(t)= unit pulse train with period T
p(t)=
Us(t)=unit step function

In frequency domain p(t) can be represented as
p(t)= 
 = 2π/T
Cn=
p(t)=1 for 0≤ t ≤p
The output of the ideal sampler can be expressed as
f*(t)=
F*(s)=
The output of the sampler can be approximated as
Cn=
=
Reconstruction process
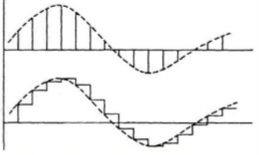
The sampled data signal is modified by the controller. The hold circuit than converts the signal to analog form. The simplest hold circuit is ZOH (zero order hold) in which the reconstructed signal acquires the same value as the last received sample for the entire sampling period.
The basic sampler is shown in above figure (a) and output in figure (b). The high frequency signal present in the reconstructed signal is filtered by the controller elements which are the low pass in frequency behaviour.
The first or higher order holds have no advantage over the ZOH. In the first order hold the last two signal samples are used to reconstruct the signal for the current sampling period.
In sampling the signal m(t) is multiplied with periodic pulse train. Let M(ω) the spectrum of the input signal be band limited with the maximum frequency of fm as shown in figure 1.
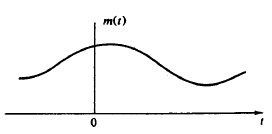
Figure: 1

Figure: 2 (fs>2 fm)

Figure: 3 (fs<2 fm)
The frequency spectrum of this signal when impulse sampled is plotted in figure 2 (for fs>2 fm). In figure 3 for (fs<2 fm). From figure 2 and figure 3 we can conclude that as long as fs≥2fm the original signal is preserved in the sampled signal and can be extracted from it by the low pass filter. This is known as Shannon’s Sampling theorem. This theorem states that the information contained in a signal is fully preserved in the sampled form as long as the sampling frequency is at least twice the maximum frequency contained in the signal.
1) When fs>2 fm due to aliasing there is loss of information as seen from the above figure. The signal components do not possess fm. Some components are outside the bandwidth.
2) In order to avoid aliasing the anti-aliasing filters are used. The cut off frequency fs/2 of the filter needs to be higher than the bandwidth of the system.
3) There is dead time in the system due to conversion of signals. Hence, the sampling interval is selected in such a manner that the stability limit of the closed loop control system as the sampling interval is increased.
4) As the signal is converted to digital form errors occur. As the sampling interval increases the error also increase.
5) The Empirical rule for the selection of the sampling rate states that a sampling period needs to be selected much shorter than any of the time constants in the continuous time plant to be controlled digitally. The sampling rate equal to one tenth of the smallest time constant is recommended.
Data hold is a process of generating a continuous-time signal h(t) from a discrete time signal x(kT). The signal x(kT) can be approximated by a polynomial  as
as
h(kT+ )=an
)=an n+an-1
 n-1+….+a1
 +a0 0≤
 ≤ T
≤ T
h(kT)=x(kT)
h(kT+ )=an
)=an n+an-1
 n-1+….+a1
 +x(kT)
If the data hold circuit is an nth order polynomial it is called as nth order hold circuit.
Zero Order Hold (ZOH)
If n=0 in above equation the zero-order hold is obtained.
h(kT+ )= x(kT) 0≤
 ≤ T k=0,1,2,3…….

Fig: Zero Order Hold
h(t)=x(0)[u(t)-u(t-T)]+x(t)[u(t-T)-u(t-2T)]+x(2T)[u(t-2T)-u(t-3T)]……..
=
Taking Laplace transform of above equation we get
L[u(t-kT)] = 
L[h(t)]=L{ }
}
H(s)= =
= 
Gho(s)=
X*(s)=
The transfer function of ZOH is Gho(s)=
For first order hold system the equation will be
h(kT+ )= a1
)= a1 +x(kT) 0≤
 ≤ T k=0,1,2,3……
h((k-1)T)=x((k-1)T)
h((k-1)T)=-a1T+x(kT)
Equating the above two equations we get
-a1T+x(kT)= x((k-1)T)
a1=
h(kT+ )= a1
)= a1 +x(kT)
Substituting a1 in the above equation we get
h(kT+ )= x(kT) +
 0≤
0≤ ≤ T
≤ T
For obtaining the transfer function let the input to the system be a unit step function
x*(t)= =
=

Fig: First Order Hold Circuit
h(t)=(1+ u(t) -
  u(t-T) – u(t-T)
Taking Laplace Transform of above equation we have
H(s)= ( -
- 
 -
- 

=  +
+ 
=( )
) 
But we also know that L[u(t)]=
The transfer function for First Order Hold is given as
Gh1(s)= =(
=( )2(
)2(  )
)
Gh1(s)= (
(  )
)
Above equation is the required transfer function of First Order Hold.