UNIT 4
Automatic Generation and Control (AGC)
In modern large interconnected systems, active and reactive power demands are never steady and they continually change. Steam input to turbo-generators (or water input to hydro-generators) must, therefore, be continuously regulated to match the active power demand, failing which the machine speed will vary with consequent change in frequency which may be highly undesirable.
Also, the excitation of generators must be continuously regulated to match the reactive power demand with reactive generation, otherwise the voltages at various system buses may go beyond the prescribed limits.
For Large Interconnected systems, manual controlling for all these parameters, is not practical. So, for this one needs to install automatic generation and voltage regulation recruitments at each generator. Figure 1, shows tone such arrangement for regulation.
The controllers are set for a particular operating condition and they take care of small changes in load demand without frequency and voltage exceeding the prescribed limits. With the passage of time, as the change in load demand becomes large, the controllers must be reset either manually or automatically.
The regulators must be designed to be insensitive to that random changes, otherwise the system will be prone to hunting resulting in excessive wear and tear of rotations machines and control equipment
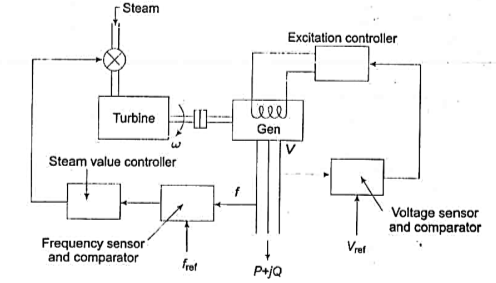
Fig. 1: schematic diagram of load frequency and excitation voltage regulators of a turbo-generator
Turbine speed governing system
Consider a single turbo-generator system supplying an isolated load.
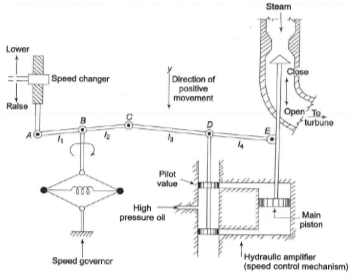
Fig. 2 Schematic of Turbine speed governing system
FIy-ball speed governor: This is the heart of the system which senses the change in speed (frequency). As the speed increases the fly balls move outwards and the point B on linkage mechanism moves downwards. The reverse happens when the speed decreases.
Hydraulic amplifier: It comprises a pilot valve and main piston arrangement. Low power level pilot valve movement is converted into high power level piston valve movement. This is necessary in order to open or close the steam valve against high pressure steam.
Linkage mechanism: ABC is a rigid link pivoted at B and CDE is another rigid link pivoted at D. This link mechanism provides a movement to the control valve in proportion to change in speed. It also provides a feedback, from the steam valve movement (link 4).
Speed changer: It provides a steady state power output setting for the turbine. It’s down words movement opens the upper pilot wall so that more steam is admitted to the turbine under steady state condition. The reverse happens for upward movement of speed changer.
Turbine speed governor model (Mathematical Model):
Under the steady state condition linkage mechanism is stationery and pilot valve closed, team valve open by a definite magnitude, turbine running at constant speed with turbine power output balancing the Governor load.
Suppose the point A on the linkage mechanism mood down words by a small amount . This causes the turbine power output to change and can be written as.

Where,  is the corresponding output.
This change is followed by a sequence of events. The Pilot valve moves upwards, high pressure oil flows and the main piston moves downwards, Due to this theme input increases to the turbine and hence Governor speed increases, sofa pencil goes up, this can be modelled as follows.
At point C, in diagram
 contributes-
  or
or  (i. e. Upwards) of
- Increase in frequency
 causes the fly balls to move upwards so that the B moves downwards by a proportional amount K’2
  . The consequent movement of C with A remaining fixed at
  is +
is +  (i.e. downwards)
Net movement at C is given by  (1)
(1)
Movement of D,  , which opens pilot valve, is given by,

 (2)
(2)
According to  , oil moves in, which moves the piston and opens steam valve by
  . Assuming internal reaction forces are negligible.
The movement of  is given by
 (3)
(3)
Taking Laplace transform of Eq. (1), (2) and (3)...
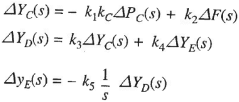
Eliminating,  and
and  , we get,

 (4)
(4)
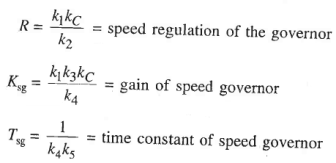
Equation (4), represented in block diagram below in figure 3.
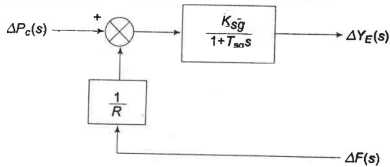
Fig. 3 Block diagram of Turbine speed governing System
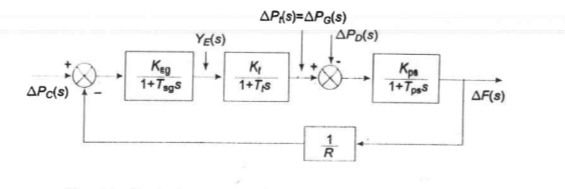
Fig. 4 Block diagram model of Load frequency control for Isolated system/Single area case.
The model of Fig. 8.6 shows that there are two important incremental inputs to the load frequency control system -  PC, the change in speed changer setting; and
  PD, the change in load demand.
Consider, Free Governor operation in which,  PC = 0, and load Demand Changes.
For this condition the steady change in frequency is given by,
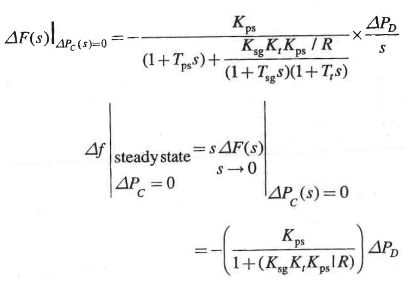
Gain Kt, is fixed for Turbine, and Kps is Fixed for the power system. The Ksg, Gain of speed governing system is easily adjusted, and thus, assuming Ksg*Kt is adjusted approx. Equal to 1.
Also, Kps =1/B, Where,
B= /
/ (in pu MW/unit change in frequency).

This equation gives steady state change in frequency caused by changes in load demand.
Speed Regulation R is adjusted naturally so that changes in frequency are small and remain about 5%. Due to this, the linear relationship between Frequency and load for free governor operation with speed changer set to give a scheduled frequency of 100% at full load.
The droop or slope of this relationship is -
Power system parameter B is very small compared to 1/R, and can be neglected.
So now, 
The droop is mainly determined by R, speed governor regulation.
Also, under steady state condition, increase in load demand  is met partly by increased generation due to opening of steam valve and partly by decreased load demand due to drop in system frequency.
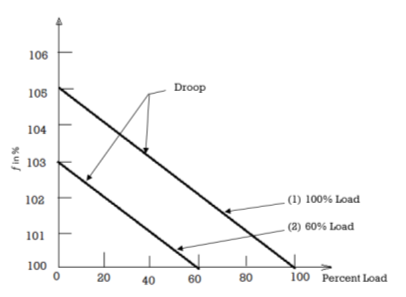
Fig. 5 Steady State Load Frequency Characteristics of a Speed Governing System

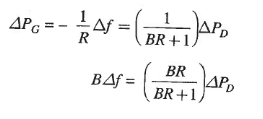
Contribution of load demand is much lesser than increase in generation.
Effect of speed changer setting:
The steady state change in frequency with change in speed changer setting is obtained as follows.
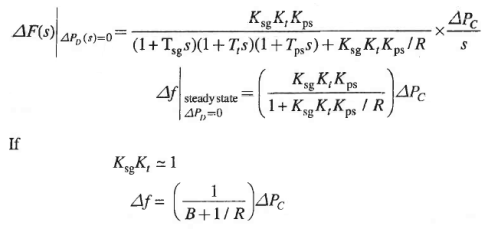
If the speed changer setting is changed by  while the load demand changes by
  the steady change in frequency is obtained by superposition, i.e.

From above equation, the frequency changes caused by load demand can be compensated by changing setting of speed changer
Figure 5 shows two load frequency plots (1) to give scheduled frequency at 100% rated load (2) To give the same frequency at 60% rated load
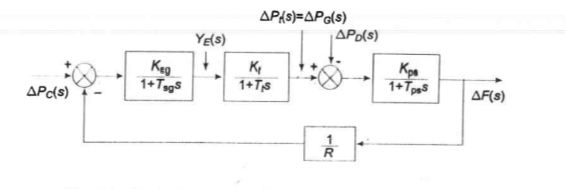
Fig. 6 Block diagram model of Load frequency control for Isolated system/Single area case.
For the two important incremental inputs to the load frequency control system -  PC, the change in speed changer setting; and
  PD, the change in load demand. Free Governor operation in which,
  PC = 0, and load Demand Changes. For this condition the steady change in frequency is given by,

The dynamic response for obtaining change in frequency according to time steps can be obtained by taking Laplace inverse of above equation.
The characteristic equation is approximated as 1st order. Typical values of the time constants of load frequency control system are related as.

Normally, Tsg = 0.4 sec. Tt = 0.5 sec. And Tps = 20 sec.
Let, Tsg = Tt = 0, and Ksg, Kt Approx. Equal to 1, the block diagram in figure 6 reduces to fig 7. From which we have.
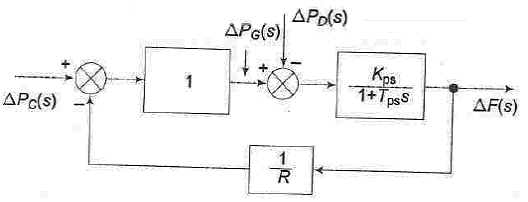
Fig. 7 First order approximation block diagram of load frequency control of an Isolated area.
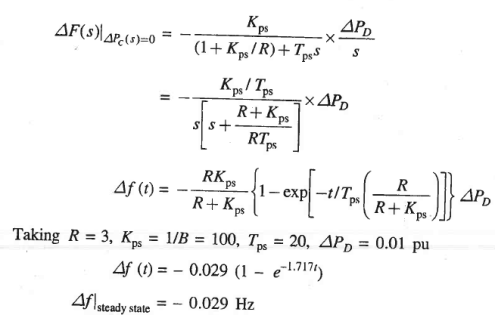
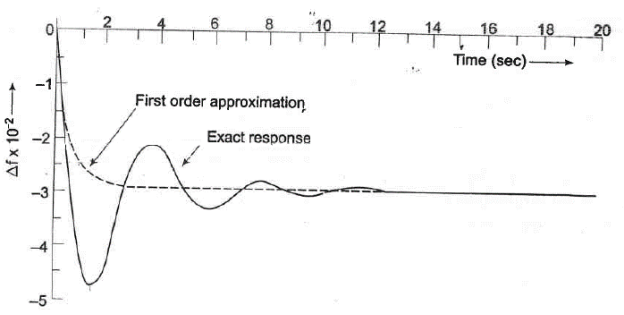
Fig. 8 Dynamic response of change in frequency with respect to step change in load (  =0.01pu, Tsg = 0.4 sec. Tt = 0.5 sec. And Tps = 20 sec., Kps= 100, R=3)
The plot of change in frequency versus time for first order approximation given above and the exact response are shown in Fig. 8.
Consider a practical system with e number of generating stations and loads. It is possible to divide an extended power system (say, national grid) into sub-areas (may be, State Electricity Boards) in which the generators are tightly coupled together so as to form a coherent group, i.e. all the generators respond in unison to changes in load or speed changer settings. Such a coherent area is called a control area in which the frequency is assumed to be the same throughout in static as well as dynamic conditions. For purposes of developing a suitable control strategy, a control area can be reduced to a single speed governor, turbo-generator and load system. All the control strategies discussed so far are, therefore, applicable to an independent control area.
Proportional plus Integral Control:
Fact, it is expected that the steady change in frequency will be zero, steady state frequency can be brought back to the scheduled value by adjuring speed changer setting, the system could undergo intolerable dynamic frequency changes with changes in load. the speed changer setting be adjusted automatically by monitoring the frequency changes. For this purpose, a signal from  is fed through an integrator to the to the speed changer. The resulting block diagram is shown below.
The system now modifies to a proportional plus integral controller, which, as is well known from control theory, gives zero steady state error, i.e.  Steady state = 0.
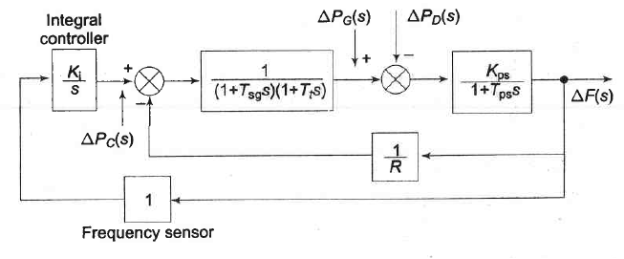
Fig. 9 Proportional plus integral load frequency control.
The signal  generated by the integral control must be of opposite sign to
  , which accounts for negative sign in the block for integral controller.

Also,

We find that the steady state change in frequency has been reduced to zero by the addition of the integral controller. This can be argued out physically as well.  reaches steady state (a constant value) only when
  Constant. Because of the integrating action of the controller, this is only possible if
  .
.
In central load frequency control of a given control area, the change (error) in frequency is known as Area Control Error (ACE). The additional signal fed back in the modified control scheme presented above is the integral of ACE.
The dynamic response of the proportional plus integral controller with Ki = 0.09 for a step load disturbance of 0.01 pu obtained through digital computer are plotted in Fig. 9. For the sake of comparison, the dynamic response without integral control action is also plotted on the same figure.
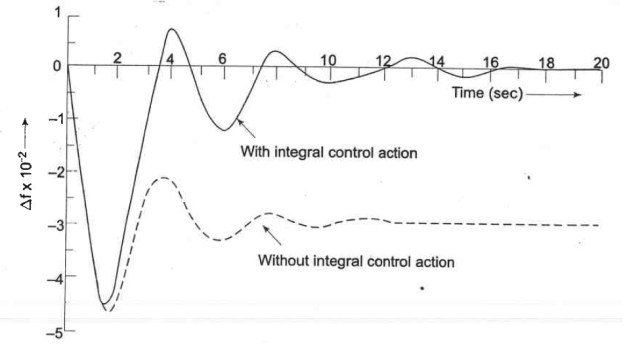
Fig. 10. Dynamic response of load frequency controller with and without integral control action. (  = 0.01pu, Tsg = 0.4 sec. Tt = 0.5 sec. And Tps = 20 sec., Kps= 100, R=3, Ki = 0.09).
Control area concept, TWO AREA load frequency control:
Consider a two-area case connected by a single tie line as shown in figure below.

Fig. 11 Two inter connected control areas (Single tie line)
The control objective now is to regulate the frequency of each area and to simultaneously regulate the tie line power as per inter area power contracts. As in the case of frequency, proportional plus integral controller will be installed so as to give zero steady state error in tie line power flow as compared to the contracted power.
It is assumed that each control area can be represented by an equivalent turbine, generator and governor system. Symbols used with suffix I refer to area 1 and those with suffix 2 refer to area 2.
Since a tie line transport, power in or out of an area, this fact must be accounted for in the incremental power balance equation of each area.
Power transported out of area 1 is given by.
 (1)
(1)
Where,
 = power angles of equivalent machines of the two areas.
For the incremental changes in  the incremental tie line power can be expressed as
 (2)
(2)
 (3)
(3)
Since incremental power angles are integrals of incremental frequencies, we can write equation (2).
 (4)
(4)
Where  and
and  are incremental frequency changes of areas 1 respectively. Similarly, the incremental tie line power out of area 2 is given by.
 (5)
(5)
Where,
 (6)
(6)
The incremental power balance equation for area 1 can be written as.
 (7)
(7)
It may be noted that all quantities other than frequency are in per unit in equ. (7)
Taking Laplace Transform and rearranging. We get,
 (8)
(8)
 (9)
(9)
Taking Laplace Transform of Equation (2)

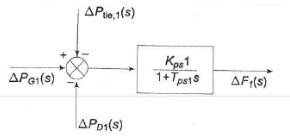
Fig. 12 Block diagram corresponding to equation (9)
Similarly, For the control area 2,
 (10)
(10)
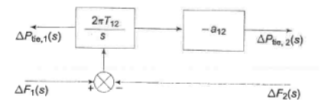
Fig. 13 Block diagram corresponding to equation (10)
Effect on ACE (area control error) in the presence of a tie line:
In order that the steady state tie line power error in a two-area control be made zero another integral control loop (one for each area) must be introduced to integrate the incremental tie line power signal and feed it back to the speed changer. This is accomplished by a single integrating block by redefining ACE as a linear combination of incremental frequency and tie line power. Thus, for control area 1.
 (11)
(11)
Where the constant b1, is called area frequency bias.
Equation (10) can be expressed in the Laplace transform as  (12)
(12)
Similarly, for the control are a 2, ACE2 is expressed as
 (13)
(13)
The composite block diagram of Two area load frequency control (feedback provided with integral of respective area control errors.
Fig. 14 Block diagram of Two area load frequency control (feedback provided with integral of respective area control errors.
Let the step changes in loads  and
and  can be simultaneously applied in control areas 1 and 2, respectively. When steady conditions are reached, the output signals of all integrating blocks will become constant and in order for this to be so, their input signals must become zero. We have, therefore, from Fig 14.
 (14)
(14)
 (15)
(15)
 (16)
(16)
We know from previous equations,

Hence Equations (14) to (16) are simultaneously satisfied only for

And

Thus, under steady condition change in the tie line power and frequency of each area is zero. This has been achieved by integration of ACEs in the feedback loops of each area.
Figure 15. Gives the schematic diagram of an automatic voltage regulator of a generator.
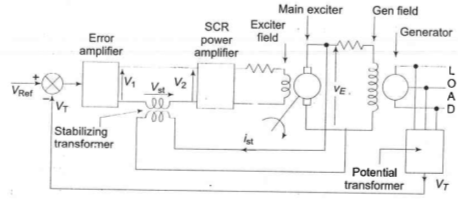
Fig. 15 schematic diagram of an automatic voltage regulator of a generator.
It basically consists of a main exciter which excites the alternator field to control the output voltage. The exciter field is automatically controlled through error  suitably amplified through voltage and power amplifiers. It is a type-0 system which requires a constant error e for a specified voltage at generator terminals. The block diagram of the system is given in Fig. 16. The function of important components and their transfer functions is given below:
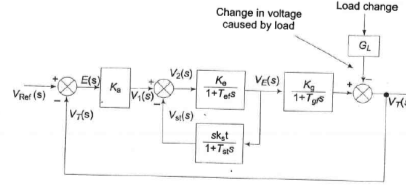
Fig. 16 Brock diagram of alternator voltage regulator scheme
Potential transformer: It gives a sample of terminal voltage v.
Differencing device: It gives the actuating error

The error initiates the corrective action of adjusting the alternator excitation. Error wave form is suppressed carrier modulated, the carrier frequency being the system frequency of 50 Hz.
Error amplifier: It demodulates and amplifies the error signal. Its gain is Kr. SCR power amplifier and exciter field: It provides the necessary power amplification to the signal for controlling the exciter field. Assuming amplifier time constant to be small enough to be neglected, the overall transfer function of these two is

Where Tef is the exciter field time constant.
Alternator; Its field is excited by the main exciter voltage vE. Under no road it produces a voltage proportional to field current. The no load transfer function is

Where
Tgf= generator field time constant.
The load causes a voltage drop which is a complex function of direct and quadrature axis currents. The effect is only schematically represented by block GL.
Stabilizing transformer: Tef and Tgf are large enough time constants to impair the system's dynamic response. It is well known that the dynamic response of a control system can be improved by the internal derivative feedback loop. The derivative feedback in this system is provided by means of a stabilizing transformer excited by the exciter output voltage vE. The output of the stabilizing transformer is fed to negatively at the input terminal of SCR power amplifier. The transfer function of the stabilizing transformer is derived below. Since the secondary is connected at the input terminals of an amplifier, it can be assumed to draw zero current. Now
Taking Laplace transform

This is the transfer function of the stabilizing transformer.
Reference & Text Books:
1. “Modern power System Analysis”, By I J Nagrath, D P Kothari
2. “Power System Analysis and Design”, By B R Gupta
3. “Power System Stability and Control” By P. Kundur
4. “Power system analysis operation and control “By Abhijit Chakrabarti and Sunita Halder
Note: Author of this content has taken all the figures and diagrams from above reference and textbooks mentioned above to make the notes more accurate and universal.