Unit V
Oscilloscope
A cathode ray oscilloscope is an electronic test instrument that displays electrical signals graphically, usually as a voltage (vertical or Y axis) versus time (horizontal or X axis) as shown in figure 1. The intensity or brightness of a waveform is sometimes considered the Z axis. There are some applications where other vertical axes such as current may be used, and other horizontal axes such as frequency or another voltage may be used.
Oscilloscopes are also used to measure electrical signals in response to physical stimuli, such as sound, mechanical stress, pressure, light, or heat. For example, a television technician can use an oscilloscope to measure signals from a television circuit board while a medical researcher can use an oscilloscope to measure brain waves.
Oscilloscopes are commonly used for measurement applications such as:
• Observing the wave shape of a signal
• Measuring the amplitude & frequency of a signal
• Measuring the time between two events
• Observing whether the signal is direct current (DC) or alternating current (AC)
• Observing noise on a signal
Construction & Working
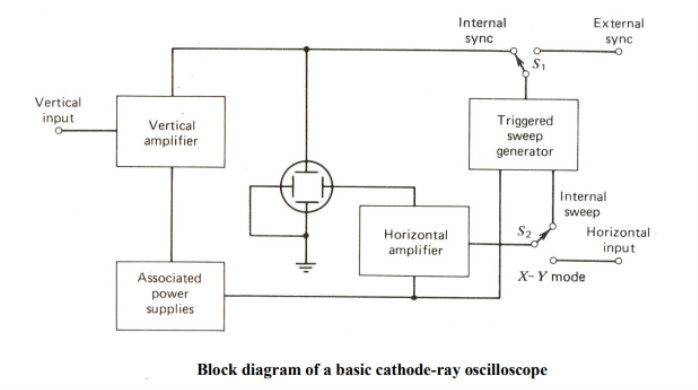
It consists of following parts
(i) Cathode Ray Tube: A cathode ray tube (CRT) much like a television tube provides the visual display showing the form of signal applied as a waveform on the front screen. The CRT is the heart of the CRO providing visual display of an input signal waveform. A CRT contains four basic parts: 1. Electron gun to provide a stream of electrons.
2. Focusing and accelerating elements to produce a well define beam of electrons.
3. Horizontal and vertical deflecting plates to control the path of the electron beam.
4. An evacuated glass envelope with a phosphorescent screen which glows visibly when struck by electron beam.
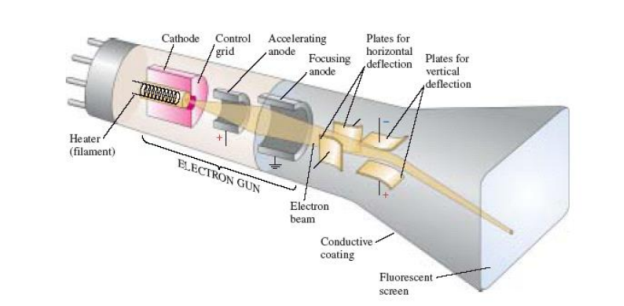
Figure 2 shows the basic construction of CRT. A cathode containing an oxide coating is heated indirectly by a filament resulting in the release of electrons from the cathode surface.
The control grid, which has a negative potential, controls the electron flows from the cathode and thus controls the number of electron directed to the screen. Once the electron passed the control grid, they are focused into a tight beam and accelerated to a higher velocity by focusing and accelerating anodes. The high velocity and well-defined electron beam then passed through two sets of deflection plates.
The first set of plates is oriented to deflect the electron beam vertically. The angle of the vertical deflection is determined by the voltage polarity applied to the deflection plates. The electron beam is also being deflected horizontally a voltage applied to the horizontal deflection plates. The tube sensitivity to deflecting voltages can be expressed in two ways that are deflection factor and deflection sensitivity.
The deflected beam is then further accelerated by very high voltages applied to the tube with the beam finally striking a phosphorescent material on the inside face of the tube. The phosphor glows when struck by the energetic electrons – the visible glow will be seen continue to emit light for a period of time after the source of excitation is removed.
(ii) Trigger Circuit: The signal is amplified and applied to the vertical deflection plate, which cause the beam to be deflected in the vertical plane. As can be seen in Figure 1, the output of the vertical amplifier is connected to the internal sync position of switch S1. With the switch set to internal sync, as it is for normal operation of the oscilloscope, the output of the vertical amplifier is applied to the sweep generator. This signal triggers the sweep generator, except in low-cost oscilloscopes with a free-running sweep generator. The purpose of the sweep generator is to develop a voltage at the horizontal deflection plate that increase linearly with time. This linearly increasing voltage, called ramp voltage or a saw tooth waveform, causes the beam to be deflected equal distance horizontally per unit of time.
(iii) Time Base Generator: It is used to reproduce the waveform accurately .It generates ramp voltage which is having constant horizontal velocity which the function of deflecting voltage and expressed in time per division.
(iv) Horizontal Amplifier: It amplifies the sweep generator output, during the ordinary mode of CRO operation vertical input signal is amplified and during the x-y mode of CRO operation horizontal input signal is amplified.
(v) Vertical Amplifier: This receives the input signal and determines the sensitivity and bandwidth of oscilloscopes and expressed in terms of oscilloscopes and expressed in bandwidth of oscilloscopes and expressed in terms of volt per division.
(vi) Delay Line: Delay line is mainly used to delay the transmission of signal voltage.
(vii) Power Supply: It provides the voltage required by the CRT to generate and accelerate the electron beam. It also provides the voltage for various stages. High voltage is given to CRT and low voltages to all other circuits.
Oscilloscope Application
(i) Voltage Measurement:
The most direct voltage measurement made with an oscilloscope is the peak-peak value. The rms value of the voltage can easily be calculated from the peak to peak measurement if desired. The peak to peak value of voltage is compute as VP-P = (vertical p-p division) x volts/div.
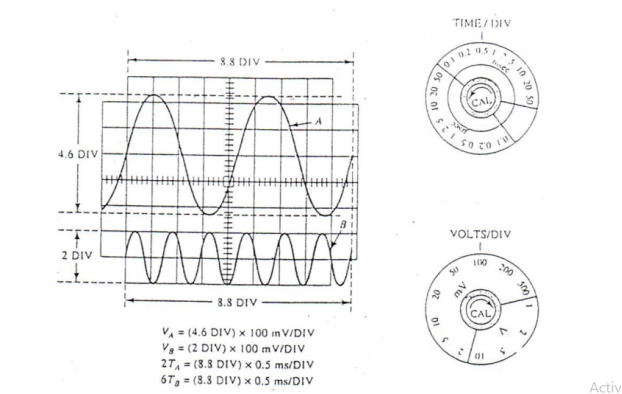
Figure 3: The peak-peak voltage of a waveform is measured by multiplying the VOLTS/DIV setting by the peak-peak vertical divisions occupied by the waveform. The time period is determined by multiplying the horizontal divisions for one cycle by the TIME/DIV setting.
Refer to figure 3, find the peak-peak voltages for each wave. Wave A : Vp-p =(4.6 divisions) x 100 mV = 460 mV Wave B : Vp-p = (2 divisions) x 100mV = 200mV
(ii) Period & frequency Measurement:
The time period of a sine wave is determined by measuring the time for one cycle in horizontal divisions and multiplying by setting of the time/div control Period, T = (horizontal divisions / cycle) (time / div) Frequency, f = 1 / T.
(iii) Phase Difference Measurement:
Phase Difference, 
The phase difference between two waveforms is measured by the method illustrated in figure 4.
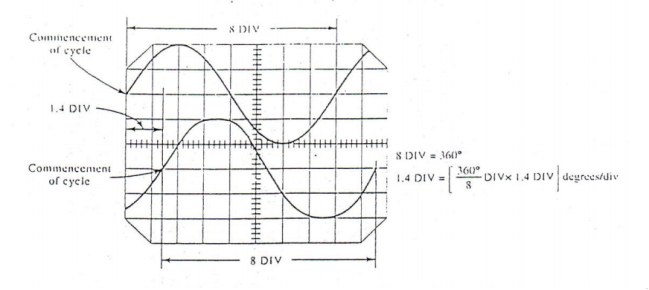
Each wave has a time period of 8 horizontal divisions, and the time between commencements of each cycle is 1.4 div one cycle = 8 div = 360° 1 div= 45° Thus, the phase different is θ = (1.4)(45° /div) = 63°.
(a) Frequency Measurement
If we apply input signal to both horizontal and vertical deflection plates of x-y oscilloscope and time base generator is disconnected, it forms a vector pattern that allows us to discern the relationship between the two signals. Such diagram are called Lissajous pattern.

Where, Fy= Frequency of signal applied to Y-Plates (Vertical)
Fx= Frequency of signal applied to X-Plates (Horizontal)
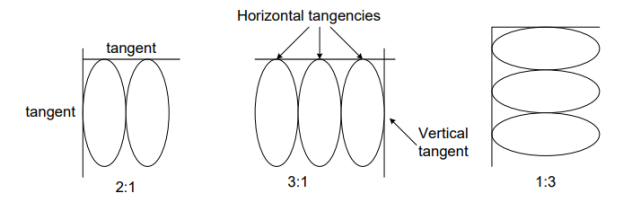
Lissajou patterns with different frequency ratios
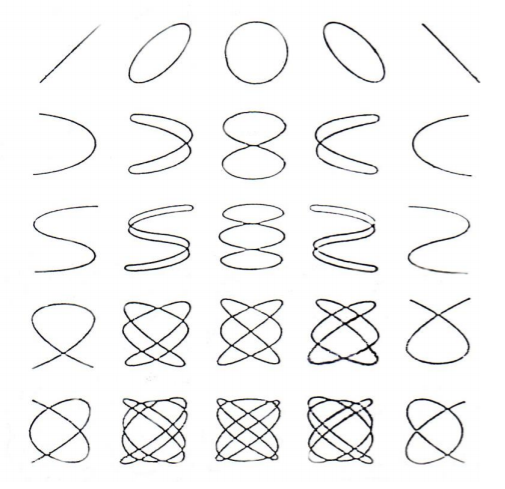
Lissajou Pattern
(b) Phase Angle Computation
Oscilloscope can also be used in the X-Y mode to determine the phase angle between two signals of the same frequency
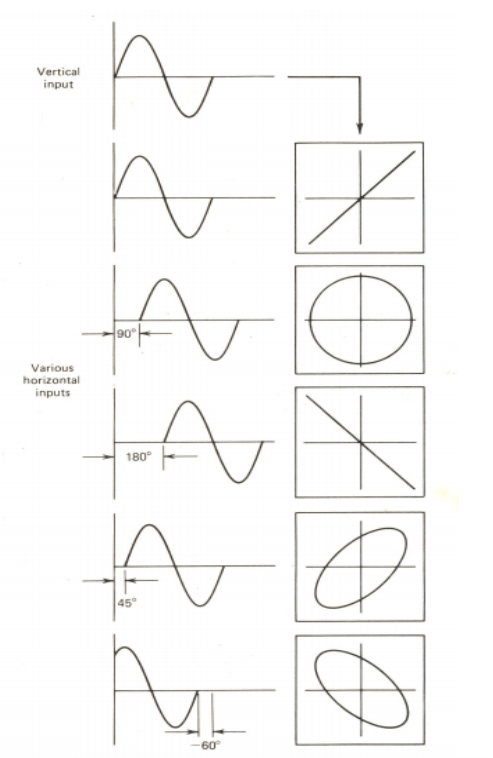
Lissajous Pattern for selected phase angle
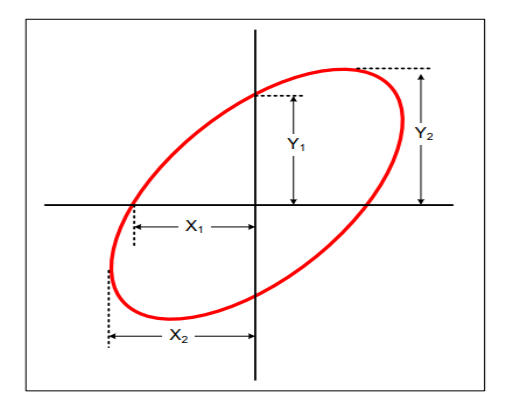
Determination of Angle of Phase Shift
The phase angle:

Where, 
The digital storage oscilloscope has the capability of retaining the image on the screen for longer than those of the previous possible techniques. Digital storage oscilloscopes are available in 2 different types. They are
(a)Processing type: The processing type digital storage oscilloscope includes built-in computing power in which all data is already in digital form
(b)Non-processing type: The non-processing type digital storage oscilloscopes are designed as replacements for analog instruments (or) both storage and non-storage types.
Construction
(a) Attenuator & Offset
(b) Analog to Digital Converter
(c) Memory Part
(d) Record Control
(e) Trigger Circuit
(f) Timing & Mode Logic
(g) Digital to Analog Converters
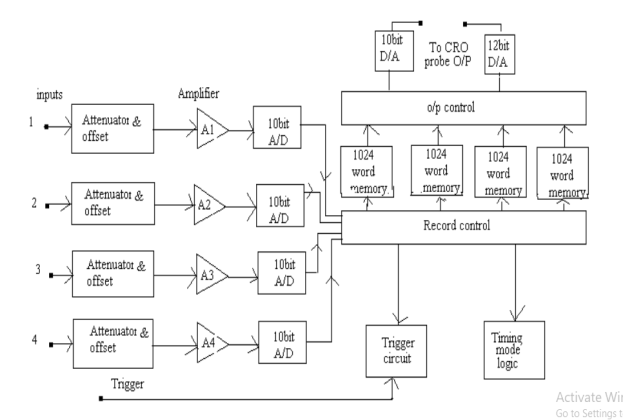
The analog voltage, input signal is digitized in a 10 bit ADC with a resolution of 0.1% and frequency response of 25 kHz. The total memory storage capacity is 4096 for a single channel 2048 for two channels each and 1024 for four channels each. The analog input voltage is sampled at adjustable rates and data points are read are read onto the memory. Once the sampled record of the event is captured in memory, many useful manipulations are possible. If the memory is readout rapidly and respectively, an input event which was a single short transient becomes a repetitive or continuous waveform. The digital recorder can be set to record continuously, until the trigger signal is received. Then the recording is stopped. In this way freezing data is received prior to the trigger signal in the memory.
Advantages of DSO
- Resolution of 0.025%
- Accuracy of 0.1%
- Better than analog oscilloscope.
- Easy comparison of two signals, due to split-screen
- Pre trigger capability
II. Transducers
A transducer is a device that converts one form of energy to other form. It converts the measurand to a useable electrical signal. It can also be defined as a device that is capable of converting the physical quantity into a proportional electrical quantity such as voltage or current. The physical quantity may be mechanical, chemical, optical or thermal.
Characteristics of Transducer
- High Accuracy & Output
- High Stability & Output
- High Sensitivity & Fast Speed of Response
- Small Size & Dynamic Range
- Process Repeatability
Selection Factor of Transducer
- Nature of measurement
- Range
- Loading Effect
- Environmental considerations
- Measuring system compatibility
- Cost & availability
- Errors & Calibration
Following are the classification of transducers
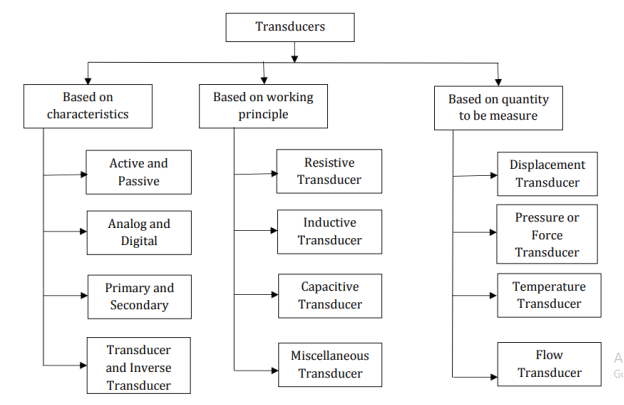
(I) Active Transducer
The transducers, which develop their output in form of electrical voltage or current without any auxiliary source, are known as active transducers. They draw energy from the system under measurement. They give very small output and use of amplifier is essential. Examples: Tachogenerator, Thermocouple & Piezo-electric Crystals
(II) Passive Transducer
The transducers in which, the electrical parameters i.e. resistance, inductance and capacitance changes with change in input signal. They require external power source for energy conversion. In this, electrical parameters causes a change in voltage, current or frequency of the external power source. They may draw some energy from the system under measurement. Examples: Resistive, Inductive & Capacitive
(III) Analog Transducer
It converts input signal into signal of the form of pulses, it gives discrete output. Analog transducer combined with Analog to Digital Converter is called Digital Transducer. Examples: encoders & Hall Effect Sensors.
(IV) Primary Transducer
When input signal is directly sensed by transducer & physical phenomena is converted into electrical form directly then such transducer is called primary transducer. Example: Thermistor
(V) Secondary Transducer
When input signal is directly sensed first by some sensor and then its output being of some form other than input signal I given as input to a transducer for conversion into electrical form, then it’s called secondary transducer. Example: LVDT
(VI) Transducer (Electrical)
It is a device that converts a non-electrical quantity into an electrical quantity. Example: Thermocouple, Pressure Gauge
(VII) Inverse Transducer
It is a device that converts an electrical quantity into non-electrical quantity. It is a precision actuator having an electrical input and low-power non-electrical output. Application of inverse transducer is in feedback measurement systems. Example: Piezo-electric Crystal
(VIII) Displacement Transducer
A device which converts linear or angular motion into electrical output signal is known as displacement transducer. Example: LVDT, RVDT
(IX) Pressure/Force Transducer
A device which converts pressure or force into electrical output signal is known as pressure or force transducer. Example: Strain Gauge, Bourdon Tube
(X) Temperature Transducer
A device which converts transducer into electrical output signal is known as pressure or force transducer. Example: RTD, Thermocouple
(XI) Flow Transducer
A device which converts flow into electrical output signal is known as pressure or force transducer. Example: Ultrasonic Flow meter
(XII) Resistive Transducer
The resistance changes due to change in physical phenomena. The resistance of metal conductor is expressed as

Where R = resistance of conductor in Ω
l= length of conductor
A= cross sectional area of conductor
 =resistivity of conductor material in Ω-m
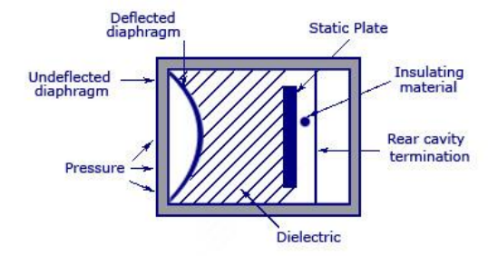
(XIII) Capacitive Transducer
In capacitive transducers the measurand is converted to a change in the capacitance. The relationship between the capacitance & size of capacitor plate, amount of separation & the dielectric is given by;

Where d = separation distance
C = capacitance in Farad
 = absolute permittivity of vacuum
 = relative permittivity
A= effective over lapping area of plates in m2
A movable diaphragm forms one plate of the capacitor and the distance between diaphragm & static plate changes when a force is applied to it. The change in capacitance is measured with an AC bridge as change in frequency. It can measure both static & dynamic changes. The main disadvantage is the sensitivity to temperature variations.
(XIV) Inductive Transducer
When a force is applied to ferromagnetic armature, the air gap changes, varying the reluctance of magnetic circuit. Applied force is measured as change in inductance of coil. It has a limited frequency response and can measure both static & dynamic changes.
Advantages of Electrical Transducers
Electrical output can be amplified to any desired level
Low power requirement
Easy transmission
Suitable with digital control
Low cost & small size
Reduced friction effect
The output can be modified as per requirements of the indicating or controlling equipments
III. Measurement of Pressure
Pressure is defined as force per unit area that a fluid exerts on a surface. It is a function of force, F, and Area, A.

SI Unit of Pressure is Pascal, Newton/per metre2 (N/m2)
Pressure can be measured using three methods and they are Absolute, Gauge & Differential. Absolute pressure is referred to the pressure in vacuum whereas gauge & differential are referenced to another pressure such as the ambient atmospheric pressure or pressure inside an adjacent vessel.

Absolute Pressure
The absolute measurement method is relative to 0 Pa, the static pressure in a vacuum. The pressure being measured is acted upon by atmospheric pressure in addition to the pressure of interest. Therefore, absolute pressure measurement includes the effects of atmospheric pressure. This type of measurement is well-suited for atmospheric pressures such as those used in altimeters or vacuum pressures. Often, the abbreviations Paa (Pascal’s absolute) or psia (pounds per square inch absolute) are used to describe absolute pressure
Gauge Pressure
Gauge pressure is measured relative to ambient atmospheric pressure. This means that both the reference and the pressure of interest are acted upon by atmospheric pressures. Therefore, gauge pressure measurement excludes the effects of atmospheric pressure. These types of measurements include tire pressure and blood pressure measurements. Similar to absolute pressure, the abbreviations Pag (Pascal’s gauge) or psig (pounds per square inch gauge) are used to describe gauge pressure.
Differential Pressure
Differential pressure is similar to gauge pressure; however, the reference is another pressure point in the system rather than the ambient atmospheric pressure. You can use this method to maintain relative pressure between two vessels such as a compressor tank and an associated feed line. Also, the abbreviations Pad (Pascal’s differential) or PSID (pounds per square inch differential) are used to describe differential pressure.
Vacuum Pressure
A Pressure measuring instrument generally measures the difference between the unknown pressure (P) and the atmospheric pressure (Patm). When the atmospheric pressure (Patm) is greater than the unknown pressure (P), the pressure measured by the instrument is called as the vacuum pressure. Atmospheric pressure is typically about 100 kPa at sea level, but is variable with altitude and weather. If the absolute pressure of a fluid stays constant, the gauge pressure of the same fluid will vary as atmospheric pressure changes. Use of the atmosphere as reference is usually signified by a (g) after the pressure unit e.g. 30 psi g, which means that the pressure measured is the total pressure minus atmospheric pressure.
Static & Dynamic Pressure
Static pressure is uniform in all directions, so pressure measurements are independent of direction in an immovable (static) fluid. Flow, however, applies additional pressure on surfaces perpendicular to the flow direction, while having little impact on surfaces parallel to the flow direction. This directional component of pressure in a moving (dynamic) fluid is called dynamic pressure. An instrument facing the flow direction measures the sum of the static and dynamic pressures; this measurement is called the total pressure or stagnation pressure. Since dynamic pressure is referenced to static pressure, it is neither gauge nor absolute; it is a differential pressure. While static gauge pressure is of primary importance to determining net loads on pipe walls, dynamic pressure is used to measure flow rates and airspeed. Dynamic pressure can be measured by taking the differential pressure between instruments parallel and perpendicular to the flow. Pitot-static tubes, for example perform this measurement on airplanes to determine airspeed. The presence of the measuring instrument inevitably acts to divert flow and create turbulence, so its shape is critical to accuracy and the calibration curves are often non-linear.
McLeod Gauge
The McLeod Gauge is used to measure vacuum pressure. It also serves as a reference standard to calibrate other low pressure gauges. The components of McLeod gauge include a reference column with reference capillary tube. The reference capillary tube has a point called zero reference point. This reference column is connected to a bulb and measuring capillary and the place of connection of the bulb with reference column is called as cut off point. It is called so because if the mercury level is raised above this point, it will cut off the entry of the applied pressure to the bulb and measuring capillary. Below the reference column and the bulb, there is a mercury reservoir operated by a piston.
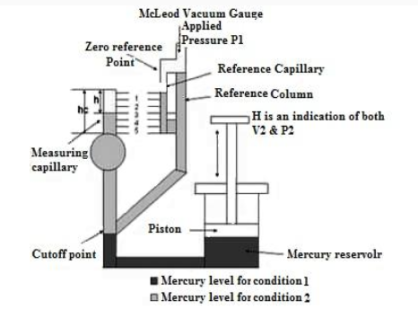
The pressure to be measured (P1) is applied to the top of the reference column of the McLeod Gauge as shown in figure. The mercury level in the gauge is raised by operating the piston to fill the volume as shown by the dark shade in the diagram. When the applied pressure fills the bulb and the capillary, again the piston is operated so that the mercury level in the gauge increases. When the mercury level reaches the cut-off point, a known volume of gas (V1) is trapped in the bulb and measuring capillary tube. The mercury level is further raised by operating the piston so the trapped gas in the bulb and measuring capillary tube is compressed. This is done until the mercury level reaches the Zero reference Point marked on the reference capillary. In this condition, the volume of the gas in the measuring capillary tube is read directly by a scale besides it. That is, the difference in height H of the measuring capillary and the reference capillary becomes a measure of the volume (V2) and pressure (P2) of the trapped gas. Now as V1, V2, and P2 are known, the applied pressure P1 can be calculated using Boyle’s Law given by:
P1V1 = P2 V2
The working of McLeod Gauge is independent of the gas composition. A linear relationship exists between the applied pressure and height and there is no need to apply corrections to the readings. The limitations are that the gas whose pressure is to be measured should obey the Boyle’s law and the presence of vapours in the gauge affects the performance.
Pirani Gauge
The Pirani gauge consists of a metal wire open to the pressure being measured. The wire is heated by a current flowing through it and cooled by the gas surrounding it. If the gas pressure is reduced, the cooling effect will decrease; hence the equilibrium temperature of the wire will increase. The resistance of the wire is a function of its temperature and by measuring the voltage across the wire and the current flowing through it, the resistance can be determined and so the gas pressure is evaluated.
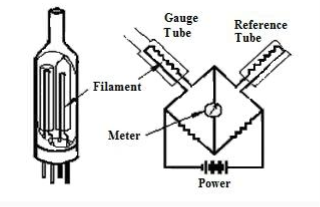
The above figure shows a Pirani gauge with two platinum alloy filaments which act as resistances in two arms of a Wheatstone bridge. One filament is the reference filament and the other is the measurement filament. The reference filament is immersed in a fixed-gas pressure, while the measurement filament is exposed to the system gas. A current through the bridge heats both filaments. Gas molecules hit the heated filaments and conduct away some of the heat. If the gas pressure around the measurement filament is not identical to that around the reference filament, the bridge is unbalanced and the degree of unbalance is a measure of the pressure. The unbalance is adjusted and the current needed to bring about balance is used as a measure of the pressure.
Capacitive Pressure Transducer
Capacitive pressure sensors measure pressure by detecting changes in electrical capacitance caused by the movement of a diaphragm. The capacitive transducer is used for measuring the displacement, pressure and other physical quantities. It is a passive transducer that means it requires external power for operation. The capacitive transducer works on the principle of variable capacitances. The capacitance of the capacitive transducer changes because of many reasons like overlapping of plates, change in distance between the plates and dielectric constant.
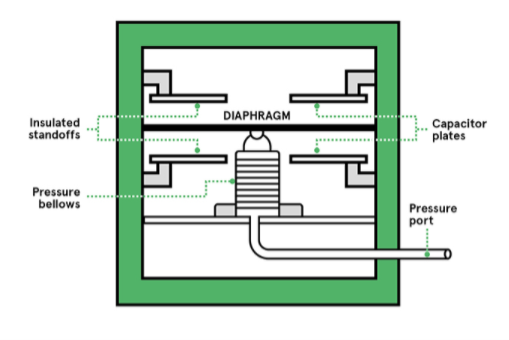
The capacitive transducer contains two parallel metal plates. These plates are separated by the dielectric medium which is either air, material, gas or liquid. In the normal capacitor the distance between the plates are fixed, but in capacitive transducer the distance between them are varied.
The capacitive transducer uses the electrical quantity of capacitance for converting the mechanical movement into an electrical signal. The input quantity causes the change of the capacitance which is directly measured by the capacitive transducer.
The capacitors measure both the static and dynamic changes. The displacement is also measured directly by connecting the measurable devices to the movable plate of the capacitor. It works on with both the contacting and non-contacting modes.
Working Principle
The equations below express the capacitance between the plates of a capacitor where A= overlapping area of plates in m2
d= distance between the two plates in m = permittivity of the medium
 = permittivity of free space
 = relative permittivity
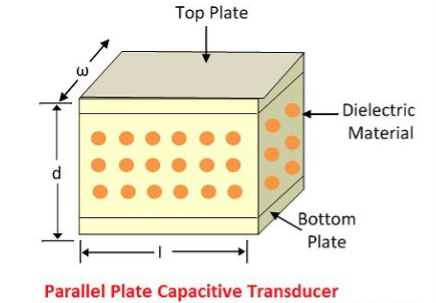
The change in capacitance occurs because of the physicals variables like displacement, force, pressure, etc. The capacitance of the transducer also changes by the variation in their dielectric constant which is usually because of the measurement of liquid or gas level.
The capacitance of the transducer is measured with the bridge circuit. The output impedance of transducer is given as

The capacitive transducer uses the following three effects.
- Variation in capacitance of transducer is because of the overlapping of capacitor plates.
- The change in capacitance is because of the change in distances between the plates.
- The capacitance changes because of dielectric constant.
Advantages
- It requires an external force for operation and hence very useful for small systems.
- The capacitive transducer is very sensitive.
- It gives good frequency response because of which it is used for the dynamic study.
- The transducer has high input impedance hence they have a small loading effect.
- It requires small output power for operation.
Disadvantages
- The metallic parts of the transducers require insulation.
- The frame of the capacitor requires earthing for reducing the effect of the stray magnetic field.
- Sometimes the transducer shows the nonlinear behaviors because of the edge effect which is controlled by using the guard ring.
- The cable connecting across the transducer causes an error.
Bourdon Tube
It is most widely used as a pressure sensing element. It consists of a narrow bore tube of elliptical cross-section, sealed at one end. The pressure is applied at the other end which is open and fixed. The tube is formed into a curve, a flat spiral or a helix. When the pressure is applied, the effect of the forces is to straighten it so that the closed end is displaced. The figure illustrates a C bourdon tube as used in direct indicating gauge which usually has an arc of 250. The process pressure is connected to the fixed socket end of the tube while the tip end is sealed. Because of the difference between inside and outside radii, the bourdon tube presents different areas to pressure, which causes the tube to tend to straighten when pressure is applied. The resulting tip-motion is non-linear because less motion results from each increment of additional pressure. This non-linear motion has to be converted to linear rotational pointer response. This is done mechanically by means of a geared sector and pinion movement as shown in figure. The tip motion is transferred to the tail of the movement sector by the connector link. The angle between the connecting link and the sector tail is called the travelling angle. This angle changes with tip movement in a non-linear fashion and so the movement of the pinion and pointer is linear.
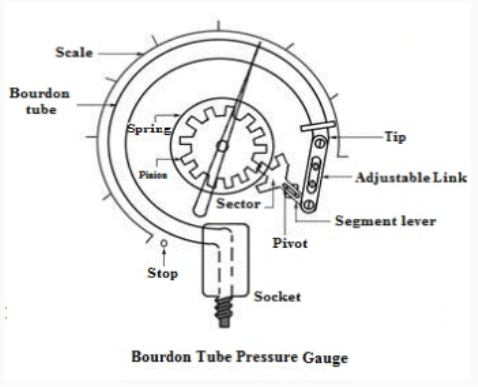
Frequently used bourdon tube materials include bronze, alloy and stainless steel. These elements are not ideally suited for low pressure, vacuum or compound measurements because the spring gradient of bourdon tube is too low.
The advantages of Bourdon tube pressure gauges are that they give accurate results. Bourdon tubes are simple in construction and their cost is low. They can be modified to give electrical outputs. They are safe even for high pressure measurement and the accuracy is high especially at high pressures. The Bourdon gauge coupled with a S.S, capsule type sensing bulb is used in milk homogenizer.
The Bourdon tube pressure gauges have some limitations also. They respond slowly to changes in pressure. They are subjected to hysteresis and are sensitive to shocks and vibrations. As the displacement of the free end of the bourdon tube is low, it requires amplification. More over, they cannot be used for precision measurement.
Elastic Diaphragm Gauge
When an elastic transducer, such as diaphragm, is subjected to a pressure, it deflects. This deflection is proportional to the applied pressure when calibrated. Elastic diaphragm gauges are built on this principle. The main part of the diaphragm gauge is a thin circular plate which is firmly fixed around its edges. The diaphragm may either be flat, dish, corrugated or corrugated as shown.

The top portion of the diaphragm is fixed with a bourdon tube of negligible weight. This bourdon tube is in-turn connected to a link sector pinion arrangement using mechanical means for displacement magnification. A pointer is connected to the pinion which makes it sweep over a pressure calibrated scale. The bottom side of the diaphragm is exposed to the pressure which is to be measured. Due to the applied pressure, the diaphragm deforms. That is the diaphragm tends to move upwards. This deformation of the diaphragm is proportional to the applied pressure. In a mechanical system, this deformation is magnified by the link sector pinion arrangement. That is, the linear displacement of the diaphragm is converted to a magnified rotary motion of the pinion. When the pinion rotates, it makes the pointer attached to it to assume a new position on the pressure calibrated scale which becomes a measure of the applied pressure. As the top side of the diaphragm is usually subjected to the atmospheric pressure, generally less than the applied pressure, the elastic diaphragm gauges usually read gauge pressure.
If the displacement is sensed by a secondary transducer such as a parallel plate capacitor, its movable plate is connected to the external circuit. In such arrangement the movable plate moves upwards, thus reducing the gap between the plates. This makes the capacitance of the capacitor becomes a measure of the applied pressure.
Elastic diaphragm gauges are they are used to measure medium pressure. But they can also be used to measure low pressures including vacuum. They are used to measure draft in chimneys of boilers and as level gauges for milk in silos, which are fitted at floor level
References
1) R.K. Rajput -“Electrical Measurements and Measuring Instruments” – S. Chand Limited, 2009
2) J.B. Gupta - “ Electrical Measurements and Measuring Instruments ” – S.K. Kataria & Sons
3) E.W. Golding - “ Electrical Measurements and Measuring Instruments ”