Unit - 1
Distribution Systems
Though in practice 3-phase 3- wire ac system is Universally used for transmission and 3-phase
h- wire ac system is used for distribution of electric power, but for special purposes, other systems may also be used those systems are:
1) Dc system: -
a) Dc two-wire system
b) Dc two-wire system with midpoint earthed
c) DC three-wire system
2) Single-phase AC system:
a) Single-phase two-wire system
b) 1- 2 wire system with midPoint earth
C) 1- 3 wire system
3) Two-Phase AC Systems:
a) 2- 4- wire System
b) 2- 3- wire System
4) Three-phase AC System:
a) 3- 3- wire system
b) 3- 4 – wire system
Overhead line | Underground Cable |
1) Open to sunlight, storm moist atmosphere, rain, etc.
2) Looks crowded network & spoils the beauty of good localities
3) Cheap in cost
4) Fault detection is easy
5) Maintenance is frequent
6)In case of a fault, joining /replacing is easy
7) Faults detected & repaired in less time & consumers effected for a short time
8) The time required for erections more
9) The line is affected by facing trees
10) In populated areas, there is much more rick & chance of an accident
11) disturbance to telecommunication
| Burned underground and therefore not affected & exposed
Network not seen & beauty of locality not spoiled
Very costly
Fault detection requires a special test
Maintenance is occasional
In case of a fault, joining is tedious & time consuming
Repairs take a lot of time and consumers
Cable laying takes less time
No such chance
Risk is rare
No such chance as the lead sheath is provided |
The following points have been assumed for the overhead system:
- Same power (P watts) transmitted by each system.
- The distance (l metre) over which power is transmitted remains the same.
- The line losses (W watts) are the same in each case.
- The maximum voltage between any conductor and earth (Vm) is the same in each case.
1) DC System:
a) Dc 2 – Wire System with midpoint earthed:
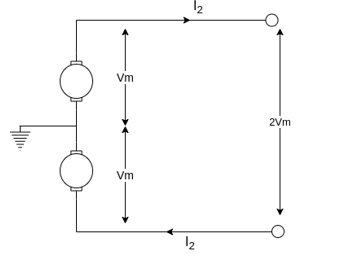
The max Voltage between any conductor & earth is “V”
 Maximum voltage between conductors = 2Vm Volts
Load Current I2 = 
Let a be the area of cross-section of the conductor.
The volume of conductor material required = 2al
Line Losses, W = 2 (I2)2R2 = 2  [
[ ]
]
W = 
Area of cross-section, a = 
Volume of conductor required = 2al = 2  =
= 
Let this volume be noted by K
2) 1- 2-write system with midPoint earthed
Assuming the power factor of the load to be cos Φ,
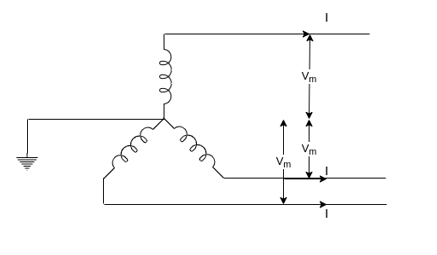
The peak value of Voltage between conductors = 2 Vm Volts
Rms value of Voltage between conductors =  =
=  Vm Volts
Load current, I = 
Line Losses W = 2
= 2
= 
 a =
a = 
Volume of conductor material required = 2al
= 2  =
= =
= 

3) 3- Ac system
a) 3- 3-wire system:
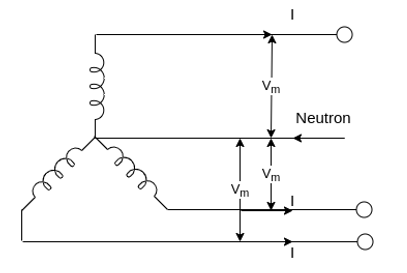
Voltage across each phase = Vm
RMS value of voltage per phase = Vm/
Power transmitted per phase = P/3
Load current per phase, I =  =
= 
Line losses W = 3I2R
=  =
= 
 =
= 
The volume of conductor material required:
= 3 a l
= 
= 
b) 3- 4-wire system:
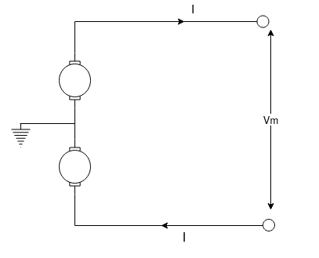
Assuming balanced load, there will be no current in neutral wire and copper loss be the same as in 3- 3 wire system
i.e. W = 
 a =
a = 
Taking cross-section of neutral wire as half of the line conductor
 The volume of conductor material required
=3.5al
= 
= 
 K
K
II) The volume of conductor required for underground systems the assumptions are:
(i) In all cases, the power to be transmitted is the same (‘p’ watts)
(ii) The distance over which the power is to be transmitted is the same (l)
(iii) The line losses are the same (w watts)
(iv) The max voltage between two conductors is the same (Vim volts)
1) Dc- 2 wire system with midpoint earthed
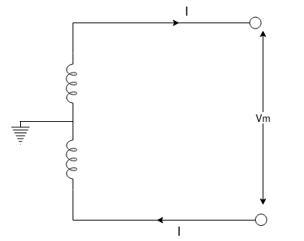
Voltage between two conductors = Vm volts
The load current, I = 
Line losses W = 2I2R
= 

 =
= 
Volume of conductor material required = 2al
= 4 = K
= K
2) 1- 2 – wire system with midpoint earthed:
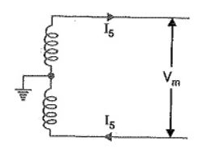
Max Value of voltage between outer conductors = Vm volts
RMS Value of Voltage between outer conductors = Vm/ vatts
vatts
The load current, I =  =
= 
Line losses, W = 2I2 R = 2
 W =
W = 
 a =
a = 
Volume of conductor material required
= 2a l
= 
= 
3) 3-  A C System:
a) 3-  3- wire system:
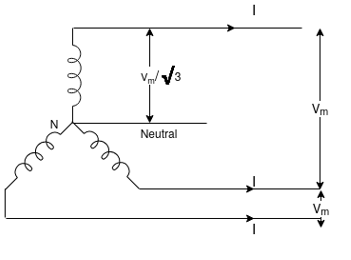
Max value voltage between conductors = Vm
RMS Value of voltage between conductors = Vm/
R.M.S Value of voltage per phase =  =
= 
The load current, I =  =
= 
Line losses W = 3 =
= 

 W =
W = 
 =
= 
The volume of conductor material required = 3al
= 
= 
b) 3- 4 –wire system:
If the loads are balanced, then particular wire carries do current consequently, the system reduces to 3-  , 3- wire system except that there is the additional neutral wire. Assuming the area of cross-section of the neutral wire to be half that of the conductor. So, the volume of conductor material required
= 3.5 al
=
= 
Primary distribution system:
It is that part of AC Distribution System which operates at voltages at (such as 3.3 kV, 6.6 kV, or 11 kV) which is higher than that of general utility (415/240V). The primary distribution is universally carried out by 3- 3-wire system.
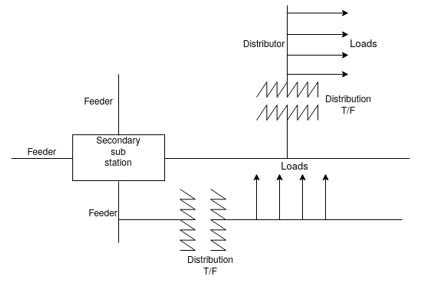
Electric power from the generating station is transmitted through extra high tension transmission lines at voltages from 33 to 765 kV, to various substations located in or near the city at these substations called the secondary substation. Voltage is stepped down to 11, 6.6 or 3.3 kV (Usually 11Kv) with the help of step down transformer. Power is supplied to various substations for distribution or to big consumers at this voltage. This forms the high voltage distribution or primary distribution.
Types of Primary distribution system:
1) Radial feeders: It derives its name from the fact that the feeder radiates from the second am substation and brand at into sub feeders and laterals which extend into our parts of the area served. The distribution T/F (11 kv/41 BV) are connected to the primary feeders, sub- feeders, and laterals Redial feeder is the simplest, most economical and most commonly used one It is advantageous for supplying power to heavy industrial load near the secondary substation, isolated loads, such as tube wells and area of low load density such as villages
However, it suffers from the drawback of poor reliability when a fault occurs at any point on the feeder, supply to all consumers beyond the fault point towards the tail a geas interrupted.
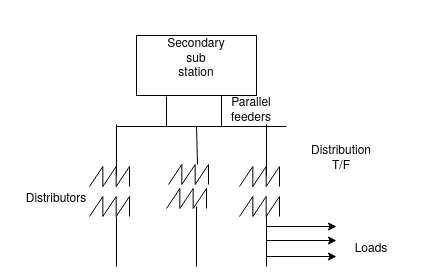
2) Parallel feeders:
In a parallel feeder system, two radial feeders originating from the same or different second subscriptions are run parallel, each feeder thought capable of supplying the load, shares the load equally in normal condition, thought the system is expensive, but ratability is increase as in case of a fault. The total load can be supplied by healthy feeder interpersonal. Of supply is only for the time duration that is taking transferring the load from the faulty feeder healthy one either by manual or automatic switches such a system is employed wherever the continuity of supply is of greater importance.
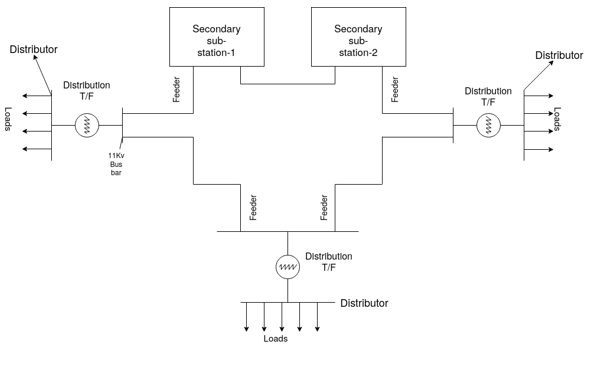
3) 3) Ring Main Distribution System:
A similar level of system reliability to that of the parallel feeders can be achieved by using ring distribution system. Here, each distribution transformer is fed with two feeders but in different paths. The feeders in this system form a loop which starts from the substation bus-bars, runs through the load area feeding distribution transformers and returns to the substation bus-bars.
4) Interconnected network system:
When a ring main feeder is energized by two or more substations or generating stations, it is called as an interconnected distribution system. This system ensures reliability in an event of transmission failure. Also, any area fed from one generating stations during peak load hours can be fed from the other generating station or substation for meeting power requirements from increased load.
Type of secondary distribution system:
It is that part of AC Distribution System which includes the range of voltages at which the ultimate consumer utilizes the electrical energy delivered to him. The secondary distribution employs 400/230 V, 3-phase, 4-wire system. 3 -  , 3 wire system is employed for balanced loads such as power load, 3 -
  , 4 wire system is employed for unbalanced loads such as light and power loads.
1) 3 -  , 4 wire Distribution:
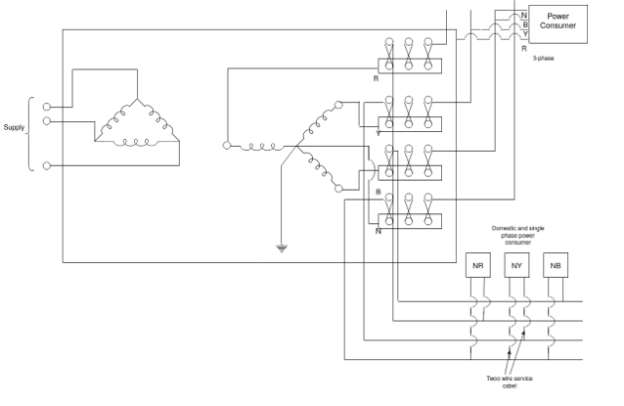
Transformer substation are built at or near the load center of the area where the load is to be supplied. The substation contains high voltage switchgear and bus- bars low voltage fuses or links. The supply to primary is by high Voltage or extra high voltage feeder cable from the generating station.
This system uses star connected phase windings and the fourth wire or neutral wire is taken from the star point. If the voltage of each winding is V, then the line-to-line voltage (line voltage) is √3V and the line-to-neutral voltage (phase voltage) is V. This type of distribution system is widely used in India and many other countries. In these countries, standard phase voltage is 230 volts and line voltage is √3x230 = 400 volts. Single-phase residential loads, single-phase motors, which run on 230 volts etc., are connected between any one phase and the neutral. Three phase loads like three-phase induction motors are put across all the three phases and the neutral.
2) 1-  , 2-wire Distribution:
For supplying purely domestic Loads 1 - 2-wire distributors are employed. These are connected to 1-
 and neutral at the substation bus–bar with different distributors to different phases.
The secondary distribution may be Radial, Open – loop or Network distribution.
Radial System:
The Radial distribution system is the cheapest to build, and is widely used in sparsely populated areas. A radial system has only one power source for a group of customers. A power failure, short-circuit, or a downed power line would interrupt power in the entire line which must be fixed before power can be restored.
Loop System:
In an open-loop system, two low voltage distributors run from a single distribution transformer thereby supplying power to the area through which it runs. The two distributors are then tied up by a normally open switch at the far end.
This system of distribution somewhat improves the reliability compared to the radial system of distribution. During the event of a fault on one of the distributors, the power can be supplied from another distributor.
Network System:
In a network system of distribution, power is supplied from two or more distribution transformers through interconnected distribution lines.
Such a system finds its best application and advantage to supply power in high-load density areas such as metropolitan cities.
This system of ac distribution increases the reliability of the distribution system, improves voltage regulation, and provides better load distribution
Economic choice of AC transmission voltage:
Let the power delivered by N-phase system, be ‘P’ watts per phase voltage of ‘V’ volts and power factor cos
Load Current per phase I= 
The resistance of Conductors, R = 
Where ‘l’ is the length of the line, ‘a’ is the cross-section of conductor and ‘s’ is the resistivity of conductor materials
Power loss in the line (Per Phase)
W =  =
=
 (I)
(I)
Also, a cross-section of the conductor
 =
=  =
=  where ‘s’ is the current density
So, substituting  =
=  in eqn I
W= 
 ƍl
ƍl 
 =
=  ---II
---II
Transmission efficiency
 =
= =
= 

 =
=  =
=  =
= III
III
Resistance drops per line
= IR =  = ƍl
= ƍl Iv
Iv
Volume of conductor material required per phase
=  l =
l =  v
v
Substituting  =
=  from II in v
Volume at conductor materials required per phase
= pl 
 =
=  = vi
= vi
Hence from the above equation, it is obvious that far constant value of P, l , Cos
, Cos &ƍ
&ƍ
i] With the increase in transmission line losses is reduced.
Ii] The transmission efficiency increases with the increase in transmission voltage ‘V’.
Iii] Percentage resistance drop decreases with the increase in transmission voltage 'V'
Iv] The volume of conductor material required is inversely proportional to supply voltage.
v] From eqn, for the same line losses and transmission of a given amount of power over a given distance through the conductor of a given material and at a given power factor that for constant values of W, P, L cause conductor material required inversely proportional the square of the supply voltage.
The above formula besides showing the great saving of conductor materials by employing a high transmission voltage a very considerable economy can be affected in the conductor material if the transmission line is operated at a high-power factor there are some limitations with the increases.
There are some limitations with the increase in Voltage. Of transmission.
i] The insulation required between the conductors and the earthed tower increases. This increases the cost of line supports.
Ii] More clearance is required between conductors and ground. Hence higher towers are required.
Iii] More clearance is required between conductors, hence longer cross-arms are required.
For every transmission line, there is a superior limit fixed for the voltage to be employed, beyond which nothing is gained in the matter of economy. This limit is reached when the cost of conductors, cost of insulators, supports, T/F, switchgear, lightning arrestors, and also the cost of erection is minimum.
The method of finding the optimum voltage is to choose a certain standard voltage and calculate the cost of:
(i) Transformers to be used at the generating and receiving stations (ii) Switchgear consisting of isolators, bus-bars, circuit breakers, relays, etc (iii)
Lightning arresters, (iv) Insulators, (v) Supports including the cross-arms and other fittings, (vi) Conductors & cost of erection The total sum of all the costs gives the total capital cost of transmission. Thus, for various standard voltage, the total capital cost is worked out and a curve of capital cost against the transmission voltage is plotted. The curve plotted is of the form shown
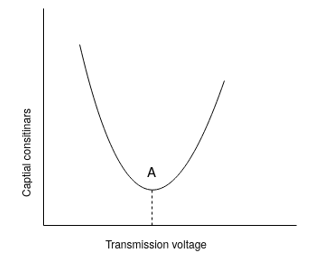
The optimum voltage from an economic point of view will be voltage corresponding to point A on the curve. Higher voltage. Would be chosen as with large working voltage, power loss & voltage drop are reduced, the load can be increased & control becomes easier.
1) The fixed cost is on account of annual interest and depreciation on the capital cost of conductors, supports and insulators and the cost of their erection in case of overhead systems.
2) For underground systems, the fixed cost is on account of annual interest and depreciation on the cost of conductors, insulation, and the cost of laying the cables.
3) For a particular voltage cost of insulation is practically constant and does not change with the x-section of the conductor, but the cost of conductors varies directly as the x-section of the conductor irrespective of the system of transmission.
4) In the case of an overhead system, the cost of supports and their creation partly varies as the cross-section of the conductors and partly constant.
5) Thus, total annual fixed cost may be represented as Rs (P1 + P2 a) where P1 and P2 are constants and ‘a’ is the area of cross-section of the conductor.
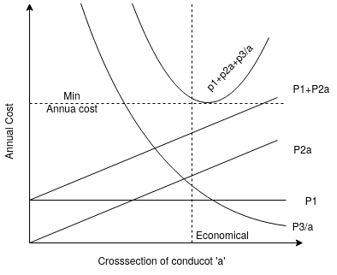
6) The annual running cost is on account of energy lost in the conductor due to its ohmic resistance i.e., I2 R losses; losses in insulating material, and metallic sheaths (for insulated cables).
7) The losses in insulating material and metallic sheaths are very small and in comparison, to ohmic losses may be neglected for the low voltage, but at higher voltages these are considerable.
8) The ohmic resistance R is inversely proportional to the area of cross-section of the conductor, and therefore for a given curve of demand for current throughout the year i.e., for a given annual load curve, the energy lost in the conductor will be proportional to the resistance and inversely proportional to the area of cross-section.
9) Hence annual running cost on account of energy lost in the transmission line may be represented as P3/a is a constant.
 The total annual cost, C =
This total annual cost will be minimum if the differentiation of it with respect to a is zero
i.e if  = 0
= 0

 (
( ) = 0
) = 0

 -
-  = 0
= 0

 =
= 
i.e., if the variable part of annual cost on account of interest and depreciation on the capital outlay is equal to the annual cost of electrical energy wasted in the conductors, the total annual cost will be minimum and the corresponding size of the conductor will be most economical. This statement is a modified version of Kelvin’s law.
Limitations on Kelvin’s Law:
Theoretical it is possible to apply this law for finding the most economical conductor size area of the conductor but ideally, it is not possible to the correct extend due following limitations:
1) At the time of estimation, actual load curves may not be available to estimate energy loss.
2) Interest and depreciation on the capital cost cannot be estimated to close accurately.
3) Safe current density mechanical strength of conductor, corona loss, etc., such physical factors are not taken into account in this law
4) The relation ( ) regarding annual cost on account of interest and depreciation on total outlay is strictly spiking not true for e.g., neither the cost cable dielectric & sheath in underground cables vary according to this simple law nor the cost of laying.
5) The conductor size determined using this law may not always be practicable, it may be too small for safely carrying the current.
Numericals on Kelvin's Law:
1) Calculate the most economic C.S area of the two-conductor cable carry a current of 200A throughout the year i) Length of cable = 1000m
Ii) Cost of cable including in installation is (20a+20) per meter where ‘a’a is c.s. The area in cm2.
Iii) Cost of energy Rs 0.06 per kwh
Iv) Interest & depreciation charges 10.
To find the resistance of one conductor
R =  assume
 R =
R =  = l =1000
 R
R  =a
=a
The energy lost per annum for both conductors =  kwh
kwh
= 2
 8760
8760 kwh
kwh
[1year =8760hours]
=  kwh
kwh
The annual cost of energy lost = Rate  Energy Lost
= 0.06 kwh
kwh
=  - (i)
- (i)
Give that capital cost (variable) of cable is Rs 20a per m
 For 1000m = 20a
 1000 = Rs. 20,000a
Variable annual charge = Annual Interest and depreciate
On capital cost (Variable) of cable
= 
= 2000a (II)
As per Kelvin’s law equating (I) &(II) for most economical size:
 2000 a =
 = 3.637145.
 = 1.907cm2
Most economical c.s area of conductor = 1.907cm2
2) A5MVA, 33KV H.V 3- transmission line supplies a loa as of 5000kw at 0.8 PF. Throughout the year. Per km cost of the line Rs (25000a+2500) where ‘a’ is c.s. The area in cm2 The other details are
i) Interest & depreciation total 10% per annum
Ii) Energy loss cost Rs 0.05 per kWh
Iii) The resistivity of conductor material is 1 Ω – m
Ω – m
Find the most economical c.s. Area of a conductor in cm2
To find Resistance R
R =  =
=  =
=  Ω (l = 1000
 )
)
To find current (I)From the power supplied
Power =  VL = I cos
5000 =
=  I
I  0.8
0.8
 I = 109.36A
To workout waste energy per annum for 3 conductors
The energy lost per annum =  = 3
= 3


=  kwh.
kwh.
Annual cost of energy lost = Rate  Energy Loss
= 0.05 =
=  (I)
(I)
The give capital (Variable) cost of cable is 25000 a/Km
 Variable annual charge @ 10% = 0.1
 25000a
= 2500a (II)
To find most economical C.S area, equating (i)&(II)
Variable annual charge = Annual cost of energy lost
2500a = 

 =
=  = 0.62848 cm2
 = 0.7927cm
 Most economical C.S area = 0.7927CM2
3) The cost per km for each of the copper conductors of a section a cm2 for a transmission line is Rs (2800a+1300) The load factor of the load current is 80% and the load factor of the losses is 65%. The rate of interest and depreciation is 10% and the cost of energy is 50 paisa per Kwh. Find the most economical Current density for the transmission line by the used of Kelvin’s law, Given ƍ = 1.78 Ω-m
Ω-m
Ans:
Capital cost (Variable) of transmission line:
= Rs. 2500a per conductor per Km length
Annual charges on account of interest and depreciation on the variable cost of the transmission line:
 = Rs.2800a

The resistance of each conductor of the cross – Sectional area ‘a’cm2
R =  =
=  Ω per km length
If ‘I’is the current in amperes in each conductor, then Power losses in each conductor for a length of 1Km.
W = I2R =  watts
watts
Energy loss per annum per conductor for a length of 1Km
= Win Kw  load factor of losses
  8760Kwh
= 
 =
=  kwh
kwh
The annual cost of energy loss for a length of 1km
 = Rs.
= Rs. 
For the most economical cross-section of the conductor

i.e 280a = 

 =
= = 23.5A/cm2
i.e most economical current density for transmission
ƍ =  = 23.5A/cm2
4) Cost of a 3-phase overhead transmission line is Rs. (35000a+3500) Per Km, where ‘a’ is a cross-section of each conductor in cm2. The line is supplying a load of 6mw at 33kv & 0.8 p.f lagging the average working hours are 20per day in a year, Energy cost is Rs.0.05 and interest &depreciation of 10%per annum. Use kelvin law to find the most economical size of the conductor The specific resistance of the conductor material is  Ω.am.
Ω.am.
Ans:
The resistance of each conductor (R)
R =  =
=  =
=  Ω
Ω
From power supplied, the current in the line is found
 Line current, I =
  =
= 
 I = 131.22A
Energy lost per annum =  Kwh
Kwh
= 


 The energy lost per annum =
  kwh
kwh
Annual cost of energy lost = 0.05 

=  I
I
The capital cost (variable) of the line is given as 35000a per km length of line
 Variable annual charge =
= 3500a (II)
Equating I & II for most economical C.S area ‘a’
 Variable energy charge = Annual cost of energy lost
 3500
3500  =
= 

 =
=  = 0.53857

 = 0.73387
 The most economic c.s area of conductor
a = 0.73387 cm2
Voltage drops in ac distributors:
The load on the distributor at different points /sections is given and therefore it is known to us. The current that the distributor has to carry is annulated. Standard tables are referred and from these tables size of the conductor is found. The second step is to ensure that the voltage drop is in permissible limits. The main part is to calculate the voltage drop in the distributor
i) Power factor referred to the receiving end Voltage:
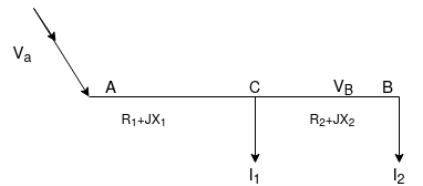
Voltage is fed at one end ‘A’
The impedance of section Ac = 
CB = 
Receiving and voltage is said VB taking this as referral vector suppose P.F at C is cos  , and at B is cos
  2 w
2 w
Load current at point C is
I1 = 
Load current at point B is
 =
=  (cos
(cos )
)
Current in section CB is
IcB = I2 = I2 (cos )
)
Current in section Ac is
I1+I2 = IAC = I1(cos  ) + I2 (cos
 )
)
Voltage drop in section CB is VcB
 VCB = IcB
  = I2 (cos
  ) (R2+jx2)
Voltage drop in AC is VAc
 vac = IAC
  2AC = [I1
 + I2 (cos
 )
)
Sending and voltage ‘VA’ is
VA = VB+VCB+VAC
Sending and current IA is
IA = I1+I2
Sending and P.F.= cos  s
s
Ii) Power factor referred to respective load voltage:
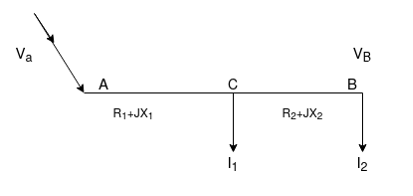
Respective branch impedance is shown
 = Phase angle between vc&I1
 = Phase angle between VB & I2
Reference vector for and voltage VB
I2 lags VB by 
I1 lags VC by  1
1
Voltage drop-in section CB = I2
= 

Voltage At point C= VB +Voltage drop-in section as
IAC = 
Voltage drop in section AC = IAC  2AC
2AC
= (I1+I2) (R1+jx1)
Voltage drop-in section AC = IAC  2A C
2A C
= ( (
( )
)
Voltage at point A = VB +Drop in CB + Drop-in AC
Numericals:
1) A single-phase distributor has a resistance of 0.2 Ω and reactance of 0.3 At mid-point ‘a’ the current is 100A at 0.6 lagging p.F W.R.T voltage ‘Va’ at ‘a’ at for end voltage ‘vb’ is240V & the current is 1000mp at p.f. Of 0.8 lagging. Find the supply voltage (vs) and phase angle between vs & vb

Vh= 240
Va = Vb + drop in ‘ah’
= 240 [ 100(0.8-j0.6) (0.1+j0.15)]
= (240+17) + j (12-6)
= 257+j6 = 25707
Current at ‘a’ is lagging by cos 0.6 by 53.13 w.r.t va
 phase angle of this current w.r.t vb is = 53.13-1.34 by
Current in section ‘sa’
= 100(Cos 51.790-sin 51.790) +100(0.8-j 0.6)
= 141.85-j138.57A
 Vs =Va + drop in ‘sa’
= (257+j6) +[(141.85-j138.57)  (0.1+j0.15)]
= 257+j6+j13.43
= 292.27
Hence voltage at sending end (v5) = 29.27 v and phase angle between vs &vb is = 2.630
2) A 300m long distributor is fed at point ‘A’ and is loaded as 60A at 0.85 lag p.f. & 85A at 0.9 lag p.f paints b&C respectively. The point ‘B’ is the mid-point of the feeder. The P.F. At both load points is referred to as the voltage at point ‘c’. The impedance of each section is (0.2+j0.3Ω)
Calculate the sending end voltage p.f. If the voltage at point ‘c’ is maintained at 230V
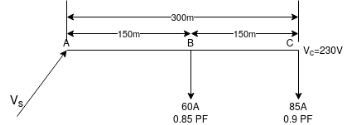
Vc = 230 referance
Impedance of section ab & Ac are given the same
 ZAB = ZBC = 2
 = (0.2+j0.3)
VB = 230 + 85 (0.9-j0.4358) (0.2+j0.3)
= 251.77+ j3.356V
IAB = 85 (0.9-j 0.4358) +60(0.85-j0.5267)
= 127.5- j68.6 = 144.78 -28.280
VA = VB +(IAB )
)
= (251.77+j3.956) + [(127.5 – j 68.6) (0.2+j0.3)]
= (251.77+j3.956) + [(144.76 - 28.280)
  (0.36
(0.36 )]
)]
= (251.77+j3.956) + 46+j24.46
= 297.77 +j28.416
299.122 5.450 volts
Sending end voltage VA = 299.122 
Sending end current IAB = 144.78 -28.280
Sending end p.f. = cos (5.45+28.26) = cos33.730 =0.83166 logging
3) The load ‘R’ phase distributor is as under:
i) l00 A, 0.707 log PF. Load at loom ii) 120 A, unity P.F load at 250m
Iii) 80A 0.8 lagging p.f at 400m from feeding point, the resistance and inductive reductive reactance per km length are 0.25  &0.125Ω respectively neglecting the voltage drop in neutral wire, final in voltage across the load for the end. If voltage at feeding point is 240V
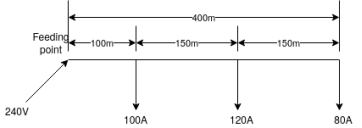
Respective P.F
Cos  = 0.707
  sin
sin  = 0.707
Cos  = 1
= 1  sin
sin  = 0
= 0
Cos = 0.8
= 0.8  sin
sin  = 0.6
= 0.6
I1 = 100A, I2 = 120A and I3 = 80A
Resistance and inductive reactance per meter are
 = 0.25/1000
 x = 0.125/1000
We can find total voltage drop in one step by adding respective voltage drop
 Total voltage drop = 100
 100
100
+120  250
250
+80
= 18.96 votts
 voltage at for end = 240-18.96 = 221.05V
The planning engineer has always more than one alternative available. The choice of proper scheme is the most difficult & complex task because a number of factors have to be taken into account and the same of these factors cannot be expressed in economic terms. Economy reliability Voltage level, regulation & feasibility of expansion are some of the important consideration
i) Economy: The planning engineer must evaluate the economy of different plans. The costs which have to be taken into account include the annual fixed costs (i.e interest, depreciation, etc.) which can be taken as a certain percentage of total investment, operating expenses (i.e labor, material, and maintenance costs) overhead expenses & the cost of electrical losses. The different steps in the economic study are:
a) Determination of total investment for each plan
b) Determination of annual fixed costs, operating costs & overhead expenses
c) Determination of cost of electrical losses.
d) Evaluation of present worth of each plan, to make the necessary funds available as & when required.
e) Selection of most economic plan
Ii) Reliability: It is expressed in a number of ways from the consumer’s point of view of interruptions, total interruption time& average integration time
a) No. Of service interruption
Per consumer per year = 
b) Total interruption time = 
Per consumer(hr./year)
Iii) voltage level & Regulation: Electrical equipment operate satisfactorily only if operated at or near the rated voltage excessively very high or low voltage may lead to equipment failure or unstated factory service The electrical supply regulation required that the voltage .at the consumer premises should remain within  6% of declared voltage.
The voltage drop accrues in primary distribution & distribution the secondary distribution & service connections. Generally, the distribution system designed for about 3% Voltage drop in the primary distribution & about 6% Voltage drop in Secondary distribution. In addition, the following voltage control methods are used singly or in combination
a) t/f tap changing under load b) should capacitor to improve P.F thereby reducing voltage drop c) series capacitors to compensate the line reactance
Iv) Feasibility of Expansion: Distribution system needs almost continuous expansion. The expansion is carried out usually in small increments. One of the key concepts in the system design is, therefore, provision for expansion The design must provide plane and equipment which can accommodate expected & unexpected further developments the design should be adaptable to change in different conditions some specific changed conditions and improvements which must be taken into account area
a) Public improvement & area development
b) Growth of load
c) Voltage conversions (Switch over to a higher voltage)
d) Capacity additions (enclosure & supports etc. should be readily expandable & economical at different times)
The primary distribution system includes feeders coming out from the substation and supplying power to several secondary distribution systems. Such feeders are generally three phase circuits. Feeders are usually radial from substation to loads. In densely populated cities, particularly commercial and business areas, where reliability is indispensable, feeders may be mashed in topology. The prices to pay for such a reliable system are as follows:
1. The cost incurred is huge because in case of a fault the system requires at least two protective devices operating simultaneously. Further, in order to guarantee the reliability, multiple switching devices should operate along the feeder.
2. The fault currents tend to be lower, closes to normal load currents, and hence there is less margin between breaker trip current and normal load current.
3. Voltage control is very difficult since there are two control points.
The standard primary distribution voltage levels include 4.16kV, 7.2kV, 12.47kV, 13.2kV, 14.4kV, 23.9kV and 34.5kV. However, equipment is specified in terms of voltage class. Equipment of one voltage class may be utilized in any operating voltage assigned to that class. For example, an insulator of voltage class 15kV may be utilized in a 12.47kV, 13.2kV and 13.8kV system. There are four major distribution level voltage classes; 5kV, 15kV, 25kV and 35kV. The 15kV voltage class is the most prevalent.
Energy losses in distribution systems are generally estimated rather than measured, because of inadequate metering in these systems and also due to the high cost of data collection. These estimations are generally based on some rules of thumb. Based on data collected from feeders specially instrumented for this purpose, true losses in some primary and secondary feeders are obtained. These losses are compared with the estimated losses obtained by the methods presently in use.
The present practice of loss estimation is very inaccurate. Only 30% of the total energy consumed is metered. Metering is generally limited to urban areas. Loads in rural areas are rarely metered. The consumption of the un-metered categories of consumer is guessed based on some rules of thumb. The difference between the known generation and the estimated consumption is considered to be loss. Even though it is well known that there are many unauthorized consumers, no mechanism is available to separate out the technical ( R loss) and the commercial losses (various forms of theft).
Actual Loss Computation:
The total HV feeder power loss during any interval is obtained as the difference between the recorded power at the feeder input and the sum of the power output of all distribution transformers. Since, individual output measurements are carried out on the secondary side of the distribution transformers, this net energy loss corresponds to the sum of the HV line losses and the transformer losses.
One main difficulty is that of installing, maintaining and collecting the readings from meters that are placed at remote locations and hostile terrains. It is easy to see that loss of measured data even from one of the meters would make the loss estimation process error prone.
The Loss Estimation Method in Use:
The present practice adopted by the electricity utility for computing line losses is to use what is generally known as the km-kVA method. The annual feeder losses are computed using the following formula given as:

Where
P- {kVA of all distribution transformers};
N- number of segments of feeder;
Ri – resistance/unit length of the ith feeder segment;
Li – length of the ith feeder segment;
Pi - {kVA of DTs supplied through segment i};
L – ;
;
RT -  ;
;
DF- (diversity factor) P/Peak Load in Kva;
LF- (load factor) energy sent out/peak Load 8760;
LLF- (loss load factor) 0.2LF + 0.8 LF2;
(km kVA)  ;
;
LDF (load distribution factor) (PL)/(km kVA)
References:
- P.S. Pabla –Electric Power Distribution, 5th edition, Tata McGraw Hill.
- S. L. Uppal, Electrical Wiring and Costing Estimation, Khanna Publishers, New Delhi.
- Surjit Singh, Electrical wiring, Estimation and Costing, Dhanpat Rai and company, New Delhi.
- Raina K.B. And Bhattacharya S.K., Electrical Design, Estimating and Costing, Tata McGraw Hill, New Delhi
- B.D. Arora-Electrical Wiring, Estimation and Costing- New Heights, New Delhi.
- M.V. Deshpande, Elements of Power Station design and practice, Wheelers Publication.
- S. Sivanagaraju and S. Satyanarayana, Electric Power Transmission and Distribution, Pearson Publication.