MICRO
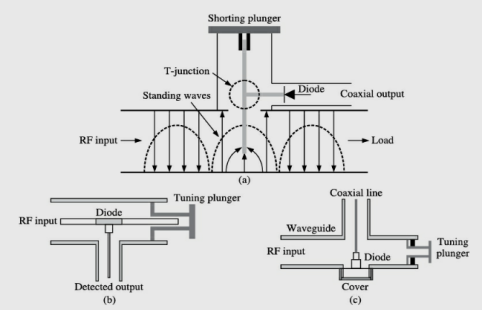
Unit - 6Microwave Measurements Microwave measurements can be done by either direct measurement or by indirect measurement. Indirect measurements are carried out by modulating the microwave signal by 1 kHz square wave signal. These measurements are low cost but labour and time intensive and require a lot of care while taking measurements to avoid errors. Direct measurements require expensive instruments like network analyser, spectrum analyser, power meter and noise figure analyser. These instruments are highly accurate and less time consuming as they directly measure the parameters like return loss, VSWR, power, frequency and noise figure. 6.1 SLOTTED LINESlotted lines are widely used for low cost microwave measurements especially in academic laboratories. Slotted line consists of a longitudinal slot (cut along the length) transmission line over which a movable E-field probe is used to sample electric field inside the transmission line. This depth and position of the E-field probe can be varied with the help of tuning adjustments available with slotted lines. The slot is kept as small as possible in order to avoid field distortion inside the transmission line. The widely used transmission lines are waveguides and coaxial lines. In case of coaxial line, a longitudinal slot is provided on the outer conductor and the probe is inserted. The probe doesn’t touch the centre conductor but remains close to it. In waveguides, the slot is provided along the length on the wider face of the waveguide. To achieve coupling without field distortion, the probe should be very thin as compared to the guide wavelength. The diagram of a slotted waveguide is shown in the figure. The slotted waveguide is used for the determination of the positions of voltage standing wave maxima and minima. A detector is also used to pick up the propagating field. The slotted line with tunable probe detector is used to measure guide wavelength, impedance, reflection co-efficient, return loss and VSWR.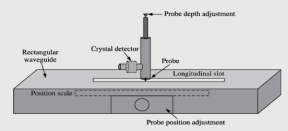 6.2 TUNABLE DETECTORSThe tunable detector is used to detect the low frequency square wave modulating signal. It consists of a non-reciprocal detector diode and a tunable stub. The diodes used for detection are metal-semiconductor Schottky barrier diodes (SBD) or point contact diodes. The detector diode is mounted in the transmission line (coaxial or waveguide). The tunable stub is used to match detector with the transmission line impedance. It helps in detecting the microwave signal over large bandwidth by providing proper impedance matching. The important tunable detectors are: (a) Tunable detector probe: used to pick up propagating fields in slotted lines [Figure(a)]. (b) Tunable coaxial detector: used to detect output by using a diode inserted up to certain depth [Figure(b)]. (c) Tunable waveguide detector: used in waveguides and consists of a diode to detect output [Figure(c)].
 6.3 VSWR METERIt is a low noise voltage amplifier having high gain, high sensitivity and high quality factor. The amplifier is tuned to 1 kHz at which the microwave signal is modulated. The high quality factor helps in selecting a particular frequency with accuracy. The output detected by a detector is fed to the input of VSWR meter which is amplified and detected by square law calibrated voltmeter. First the detector is varied along the slotted line to find Vmax. Then the VSWR meter is adjusted to unity. Now, the VSWR meter can directly read Vmax /Vmin when Vmin is fed to the VSWR meter by detector. There are three scales available on the VSWR meter. The VSWR upto 10 can be read through the VSWR meter. The scale is subdivided into many scales for measurement of VSWR from 1 to 1.3 (expanded scale 3), 3.2 to 10 (normal scale 2) and 1 to 4 (normal scale 1). The dB scale is given in the bottom of the scale. The commercially available VSWR meter is shown in the figure,
 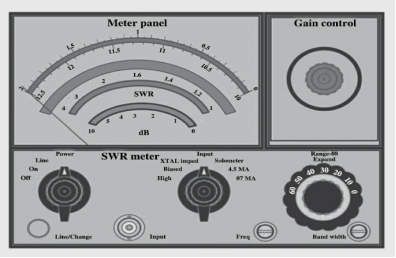 VSWR meter. 6.4 POWER METERThe power meter is used to measure the amount of power in the microwave signals. It consists of a group of sensors such as a Schottky barrier diode, a bolometer, and the thermocouple that cover a range of frequencies. These sensors will convert microwave power into heat energy. This variation in temperature provides an output current in the low-frequency circuit, which indicates power. The power meter can be set to display power in mW or dBm. The power meter is shown in Figure
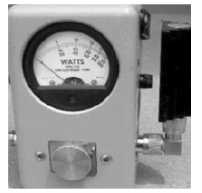 Power meter with matched load 6.5 S – PARAMETER MEASUREMENTScattering parameters are ratios of different outgoing waves to incident waves. S-parameter, Smn is ratio of bn to am. Therefore, measurement of bn and am is required. The circuit arrangement is shown in the figure below,
 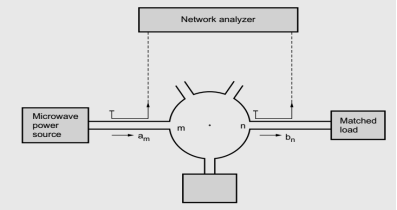 Steps for Measuring Smn1. Connect microwave power source to port m and a matched load to port n. The port m and n are connected to network analyzer via two directional couplers as shown in the figure above. 2. Terminate all other ports in matched load, so that no incident waves are set up. 3. The network analyzer indicates the complex value of Smn in terms of amplitude and phase. 6.6 FREQUENCY MEASUREMENTSMicrowave frequency can be measured by two methods: (i) slotted-line method; (ii) electronic technique. Slotted-line Method (Mechanical Technique)In this method, the measurement of wavelength in a waveguide will be made first and from that, frequency will be determined. A tunable resonator is required for this method, which has a known relation between a physical dimension and frequency, for example an absorption wave meter. The standing wave pattern appears only when the slotted line is terminated by a short circuit. The positions of two adjacent nulls are accurately positioned in two steps (i) moving the probe along a slotted line (ii) read the position of nulls in the vernier scale. The two positions are separated by half a guide wavelength lg/2.The free space wavelength is given by λ0 = c/f, c = fλ0, f = c/λ0 . The guided wavelength in the air-filled rectangular waveguide, is given by,
  and
and  The distance between two successive voltage minima as shown in the figure, is given by,
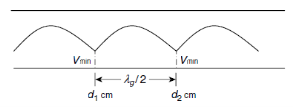 The cutoff wavelength, λc = 2a (for the dominant TE10 mode), where “a” is the broad dimension of the waveguide. Therefore,
  where c - speed of light in free space (3 × l08 m/s)f – frequency, (Hz)λ0 – wavelength in free space, (m)λg – wavelength of waveguide, (m)λc – cutoff wavelength of waveguide (m) In this method, the guided wavelength (λg) in a waveguide is measured by creating standing waves in a slotted-line section. The distance between a maxima and minima of the standing wave (d2 – d1) corresponds to (λg /2); hence, frequency can be determined from the measurement of (λg). Electronic TechniqueThis method uses frequency heterodyne system. This system compares the unknown microwave frequency with a harmonic of the known standard frequency as shown in the figure. The unknown frequency f can be calculated as below from the output frequency f0 and frequency nfc .
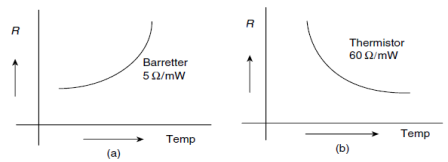
 Electronic technique for measuring frequency 6.7 POWER MEASUREMENTPower at low frequencies is similar to the Microwave power; in the way that is, it is the product of rms voltage, rms current, and power factor. Pav = Irms Vrms cosφ The power flow is the same at any point in the waveguide; that is, the microwave power inside a waveguide is invariant with the position of measurement, and the power measured is the average power.Depending on the power level, there are three different measuring techniques:(a) Measurement of low power (0.10 mW–10 mW) –Bolometer technique(b) Measurement of medium power (10 mW–1 W) – Calorimetric technique(c) Measurement of high power (1 W–10 W) – Calorimetric watt meter(a) Measurement of low power (Bolometer technique)Devices that are capable of measuring low microwave powers are bolometers and thermocouples whose resistance changes with the applied power. Among these, bolometers are the most widely used. A bolometer is a device that converts RF power into heat, and this changes its resistance, from which power can be measured. There are two types of devices, namely barretters and thermistors, which are useful in the absolute measurement of power.A barretter consists of a short length of very fine platinum wire that is suitably capsulated.These are positive temperature coefficient (PTC) components, and their resistance increases with an increase in temperature as shown in the figure (a). Thermistors are semiconductor materials.These are negative temperature coefficient (NTC) components, and their resistance decreases with an increase in temperature as shown in the figure (b).
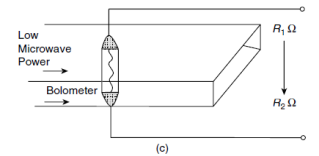
 A bolometer is a square-law device, similar to a crystal diode. It produces a current that is proportional to the applied power, that is, the square of the applied voltage, rather than the applied voltage.A bolometer is placed inside the waveguide as shown in Figure (c), where the bolometeritself acts as a load with R1 Ω as operation resistance. Now, low microwave power is applied that is to be measured. Bolometer load absorbs some of the power applied and dissipates it as heat, and its resistance changes to R2 Ω. This change in resistance (R1~R2) is proportional to the microwave power that can be measured using a bridge. Due to non-linear characteristics of the bolometer inaccuracy is introduced.The bolometer itself becomes one of the arms of the bridge, in the balanced bolometer bridge technique and is as shown in the figure. At first, R5 is adjusted so that the bridge is balanced.This changes the dc power applied to the bridge, and the bolometer element is brought to pre-determined operating resistance before the microwave is applied. Let the battery voltage at balance be denoted by E1.
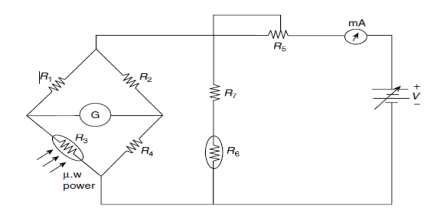 Bolometer bridge The microwave power applied is dissipated in the bolometer. The bridge becomes unbalanced due to the change in resistance which is due to the heating of bolometer. To balance the bridge again, the applied dc power is changed to E2. This change in dc battery voltage (E1~E2) is proportional to the microwave power. Alternately, the detector “G ” can read the microwave power directly, by balancing the bridge. This balancing of the bridge can be achieved by calibrating the detector in terms of microwave power.However, some errors can occur which can be avoided by temperature compensation, since the bolometer is a temperature sensitive device. This can be achieved by using R6 and R7 resistors.Limitations: Power-handling capability of barretters and thermistors are limited to about 10 mW. So, higher powers (> 10 mW) cannot be measured with them directly. (b) Measurement of medium microwave powerThe range of medium microwave power is from 10 mW to 1 W. The power in this range canbe measured by calorimetric techniques. The principle of calorimetric technique is that a special load which is monitored, is proportional to the power responsible for the rise as shown in the figure.
  Principle of medium power measurement The special load should have high specific heat. Generally, water is a good load. The power can be measured by knowing mass, specific heat, and temperature rise at a fixed and known rate of fluid flow (c) Measurement of high microwave powerPower between 1 W and 10 W can be considered high microwave power. These are usually measured by calorimetric watt meters. In this method also, the temperature rise of a special load is monitored to measure the microwave power as shown in the figure.A microwave calorimeter watt meter consists of two identical temperature-sensitive gauges, one in each arm, and an amplifier with high gain. The bridge is imbalanced as the input sensing resistor heats up. This heating up of the input sensing resistor is due the microwave power that is incident on the calorimeter. The circulating stream of either oil or ammonia gas is the dissipative load. By amplifying and applying the imbalance signal of the bridge to the comparison resistor and using the power delivered to it the bridge can be rebalanced. The watt meter keeps the record of the microwave power.
 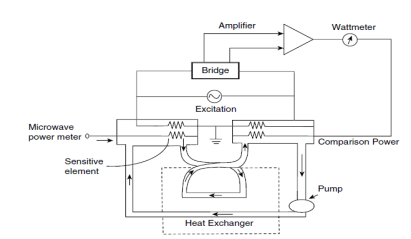 Microwave calorimeter wattmeter 6.8 ATTENUATION MEASUREMENT Attenuators are used to adjust the power level of the microwave signal. If the network is perfectly matched, the reflected power is zero and the insertion loss is similar to the attenuation provided by the microwave device or component. Attenuation is defined as the ratio of input power to the output power in dB. Attenuation in(dB) log = 10log(P1/P2)where, P1 = power detected by the load without the attenuator in the lineP2 = power detected by the load with the attenuator in the lineMeasurement of attenuation is done in two ways: (i) power ratio method; (ii) RF substitution method Power Ratio MethodPower ratio method is a process of measuring the input and output power with the device (set up 1) as shown in Figure (a) and without the device (or attenuator) in the circuit as shown in Figure (b).The P1 and P2 are the powers measured in setup 1 and 2. The attenuation is the ratio of power (P1/P2) which is expressed in decibels.
 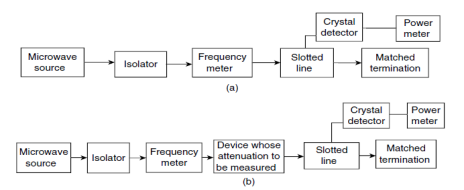 (a) Setup 1 power ratio method without the device or attenuator; (b) Setup 2 power ratio method with the device or attenuator Disadvantage of the power ratio method:The attenuation calculated will not be accurate, particularly if it is large. Because the two powers measured (P1 & P2) is non-linear. It is also true for the networks with low input power. With this method, we can measure the attenuation up to 20 dB only. RF Substitution MethodThe attenuation through the device under test is compared with a standard microwave attenuator operating at the same frequency in this method. As shown in Figure (a) the network whose attenuation is to be measured is included in the setup 1. Thus the output power “P ” is measured by this method.The drawbacks of the power ratio method can be overcome by this method as the attenuation is measured at a single power position.A precision calibrated variable attenuator replaces the network in setup 2 as shown in Figure (b).This attenuator is adjusted to get same output power “P,” as in setup 1. Under this condition, attenuation of the device is to be measured in the precision attenuator.
 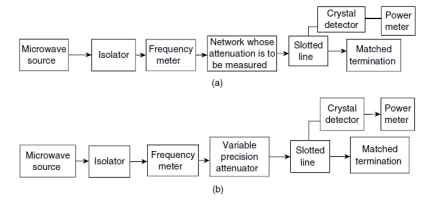 6.9 VSWR MEASUREMENT VSWR stands for voltage standing wave ratio. In a perfectly matched system, there is no variation in the field strength along the waveguide. A mismatch leads to reflected waves, thereby leading to standing waves along the length of the guide. Standing waves are the indication of the quality of the transmission.VSWR = 1 for a perfectly matched system. The ratio of the maximum to the minimum voltage gives the VSWR.
 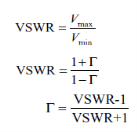 where Γ is the reflection coefficient.A typical setup for VSWR measurement is shown in the figure below.
  Block diagram for measurement of VSWR Measurement of Low VSWR (S < 10)VSWR values below 10 are very easily measured by this method. The VSWR meter directly displays these values. The setup is shown in the figure above. The attenuator is adjusted to give a maximum reading on the meter. The attenuation has to be adjusted to get a full-scale reading. Then, the minimum reading on the meter is obtained by adjusting the probe on the slotted line. Thus the VSWR is defined by the ratio of the first reading to the second reading. The meter can be calibrated in terms of VSWR.Here, attenuator is adjusted so that the traveling probe gives a maximum deflection on the VSWR meter. The VSWR of 1 corresponds to full-scale deflection (i.e. 10 mV in the meter). By adjusting the travelling probe the minimum reading can be obtained on the meter. Measurement of High VSWR(S > 10)VSWR greater than 10 can be measured by double minimum method. In this method, the probe is inserted to a depth where the minimum value can be read easily. Then the probe should be moved to a point where the power is twice the minimum (Pmin = 2V2min/RL, i.e. Pmin = 2P). Let d1 be this position. Then again, the probe is moved to twice the power point on the other side of the minimum (say d2) as shown in the figure below.
 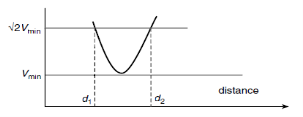 For the dominant TE10 mode rectangular waveguide, λ0, λg, and λc are related as below.
  where λ0 is free space wave lengthλg is guide wave lengthλc is cutoff wave lengthFor the TE10 mode, λc = 2a where “a” is the broad dimension of the waveguide.
  The VSWR can be calculated using the empirical relation
  6.10 IMPEDANCE MEASUREMENT Impedance (Z) is defined as the ability to oppose the flow of an alternating current (AC ) at a given frequency. It is represented as a complex quantity and is graphically shown on a vector plane. An impedance vector consists of a real part (resistance, R) and an imaginary part (reactance, X ) as shown in the figure below. Z = R + jX = Z
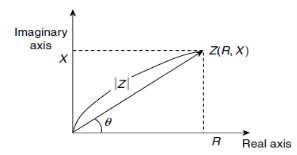 There are many methods for measuring impedance, each of which has advantages and disadvantages.The most commonly used method is the measurement of impedance using the slotted line. Measurement of Impedance Using a Slotted LineThe end of the slotted line is connected to the unknown impedance as shown in the figure below. From the other end of the coaxial line microwave power is fed. A part of the power is reflected by the unknown impedance. By evaluating the standing wave fields in the slotted line this reflection coefficient is measured.The reflection coefficient Γ, is given by,
  Where, the unknown impedance terminating a line of characteristic impedance Z0 is ZL. Thus, ZL can be determined, if Γ is measured and Z0 is known. As ZL is complex, from the VSWR measurement both the magnitude and phase of Γ can be determined.
 Impedance measurement using slotted line 6.11 MEASUREMENT OF Q OF A CAVITY RESONATOR A volume that is completely surrounded by a metallic surface is defined as a cavity. The important parameter of a cavity is quality factor. It is a measure of selectivity of the frequency resonant or anti resonant circuit and is defined by the following equation:
  The Q of a cavity resonator can be measured in three ways:1. Transmission method2. Impedance measurement3. Transient delay or decrement methodIn general, the transmission method is used among these three methods. The setup for the transmission method for measuring Q is shown in the figure below,
  The cavity resonator is used as a transmission device, in this method, and the output power is measured as a function of the frequency resulting in the resonance curve as shown in the figure below,
 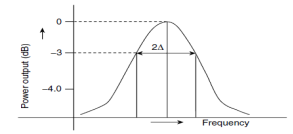 The output power is to be measured by two methods(i) Changing the frequency of the source of the microwave and by keeping the signal level constant.(ii) Tuning the cavity and by keeping both signal level and frequency constant, the output power is measured. The half-power bandwidth can be calculated (2Δ) from the resonance curve in the Figure .
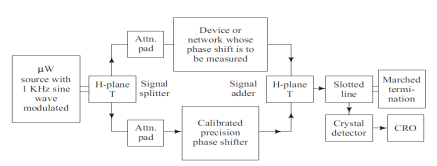
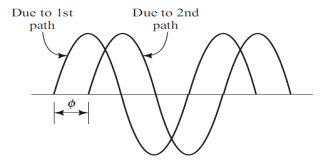
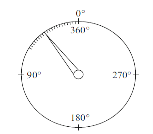
  where QL = loaded valueQ0 = unloaded QQL = Q0 if the coupling between microwave source and cavity and that between detector and cavity are neglected. 6.12 MEASUREMENT OF PHASE SHIFT The phase shift introduced by a microwave network can be measured by using the set-up shown in the figure below. As it is not possible to distinguish between one-quarter wavelength and say, seven quarter wavelengths, we must have an approximate idea of the networks electrical length.Also, we know that each wavelength (λg), corresponds to a phase shift of 2 radians, knowingthe approximate electrical lengths of the network, phase shift can be determined to a fairly accurate value as follows. (i) The source with a 1 kHz sine wave amplitude modulation is split up into two equal parts using the H-plane Tee junction, one going to the unknown network whose accurate phase shift is to be measured and the other to the comparison adjustable precision phase shifter.(ii) Standard precision phase shifter is now adjusted until the two demodulated 1 kHz sinewave on the CRO are in phase, as shown by the figure, and the relative phase shift of the twonetworks are now equal. (iii) Dial reading on the precision phase shifter now gives the phase shift offered by the device as shown in the figure, to which the multiplies of 360° is to be added.If from the preliminary measurement we get the phase shift of the unknown network to be inthe vicinity of 4kg − 1440° and the reading on the calibrated precision phase shifter is 15°, then the total phase shift must be 1440° + 15°= 1455. If the reading is 310°, i.e. more than 180°, then the total phase shift must be [1080° (360 − 310)] = [1080° − 50°] = 1030°.
Reference Books1. M. Kulkarni, “Microwave and Radar engineering”, 3rd edition, Umesh Publications2. ML Sisodia& GS Raghuvamshi, “Microwave Circuits and Passive Devices”Wiley, 19873. M L Sisodia& G S Raghuvanshi, “Basic Microwave Techniques and LaboratoryManual”, New Age International (P) Limited, Publishers.
 6.2 TUNABLE DETECTORSThe tunable detector is used to detect the low frequency square wave modulating signal. It consists of a non-reciprocal detector diode and a tunable stub. The diodes used for detection are metal-semiconductor Schottky barrier diodes (SBD) or point contact diodes. The detector diode is mounted in the transmission line (coaxial or waveguide). The tunable stub is used to match detector with the transmission line impedance. It helps in detecting the microwave signal over large bandwidth by providing proper impedance matching. The important tunable detectors are: (a) Tunable detector probe: used to pick up propagating fields in slotted lines [Figure(a)]. (b) Tunable coaxial detector: used to detect output by using a diode inserted up to certain depth [Figure(b)]. (c) Tunable waveguide detector: used in waveguides and consists of a diode to detect output [Figure(c)].
 6.3 VSWR METERIt is a low noise voltage amplifier having high gain, high sensitivity and high quality factor. The amplifier is tuned to 1 kHz at which the microwave signal is modulated. The high quality factor helps in selecting a particular frequency with accuracy. The output detected by a detector is fed to the input of VSWR meter which is amplified and detected by square law calibrated voltmeter. First the detector is varied along the slotted line to find Vmax. Then the VSWR meter is adjusted to unity. Now, the VSWR meter can directly read Vmax /Vmin when Vmin is fed to the VSWR meter by detector. There are three scales available on the VSWR meter. The VSWR upto 10 can be read through the VSWR meter. The scale is subdivided into many scales for measurement of VSWR from 1 to 1.3 (expanded scale 3), 3.2 to 10 (normal scale 2) and 1 to 4 (normal scale 1). The dB scale is given in the bottom of the scale. The commercially available VSWR meter is shown in the figure,
  VSWR meter. 6.4 POWER METERThe power meter is used to measure the amount of power in the microwave signals. It consists of a group of sensors such as a Schottky barrier diode, a bolometer, and the thermocouple that cover a range of frequencies. These sensors will convert microwave power into heat energy. This variation in temperature provides an output current in the low-frequency circuit, which indicates power. The power meter can be set to display power in mW or dBm. The power meter is shown in Figure
 Power meter with matched load 6.5 S – PARAMETER MEASUREMENTScattering parameters are ratios of different outgoing waves to incident waves. S-parameter, Smn is ratio of bn to am. Therefore, measurement of bn and am is required. The circuit arrangement is shown in the figure below,
  Steps for Measuring Smn1. Connect microwave power source to port m and a matched load to port n. The port m and n are connected to network analyzer via two directional couplers as shown in the figure above. 2. Terminate all other ports in matched load, so that no incident waves are set up. 3. The network analyzer indicates the complex value of Smn in terms of amplitude and phase. 6.6 FREQUENCY MEASUREMENTSMicrowave frequency can be measured by two methods: (i) slotted-line method; (ii) electronic technique. Slotted-line Method (Mechanical Technique)In this method, the measurement of wavelength in a waveguide will be made first and from that, frequency will be determined. A tunable resonator is required for this method, which has a known relation between a physical dimension and frequency, for example an absorption wave meter. The standing wave pattern appears only when the slotted line is terminated by a short circuit. The positions of two adjacent nulls are accurately positioned in two steps (i) moving the probe along a slotted line (ii) read the position of nulls in the vernier scale. The two positions are separated by half a guide wavelength lg/2.The free space wavelength is given by λ0 = c/f, c = fλ0, f = c/λ0 . The guided wavelength in the air-filled rectangular waveguide, is given by,
  The distance between two successive voltage minima as shown in the figure, is given by,
  The cutoff wavelength, λc = 2a (for the dominant TE10 mode), where “a” is the broad dimension of the waveguide. Therefore,
  where c - speed of light in free space (3 × l08 m/s)f – frequency, (Hz)λ0 – wavelength in free space, (m)λg – wavelength of waveguide, (m)λc – cutoff wavelength of waveguide (m) In this method, the guided wavelength (λg) in a waveguide is measured by creating standing waves in a slotted-line section. The distance between a maxima and minima of the standing wave (d2 – d1) corresponds to (λg /2); hence, frequency can be determined from the measurement of (λg). Electronic TechniqueThis method uses frequency heterodyne system. This system compares the unknown microwave frequency with a harmonic of the known standard frequency as shown in the figure. The unknown frequency f can be calculated as below from the output frequency f0 and frequency nfc .
  Electronic technique for measuring frequency 6.7 POWER MEASUREMENTPower at low frequencies is similar to the Microwave power; in the way that is, it is the product of rms voltage, rms current, and power factor. Pav = Irms Vrms cosφ The power flow is the same at any point in the waveguide; that is, the microwave power inside a waveguide is invariant with the position of measurement, and the power measured is the average power.Depending on the power level, there are three different measuring techniques:(a) Measurement of low power (0.10 mW–10 mW) –Bolometer technique(b) Measurement of medium power (10 mW–1 W) – Calorimetric technique(c) Measurement of high power (1 W–10 W) – Calorimetric watt meter(a) Measurement of low power (Bolometer technique)Devices that are capable of measuring low microwave powers are bolometers and thermocouples whose resistance changes with the applied power. Among these, bolometers are the most widely used. A bolometer is a device that converts RF power into heat, and this changes its resistance, from which power can be measured. There are two types of devices, namely barretters and thermistors, which are useful in the absolute measurement of power.A barretter consists of a short length of very fine platinum wire that is suitably capsulated.These are positive temperature coefficient (PTC) components, and their resistance increases with an increase in temperature as shown in the figure (a). Thermistors are semiconductor materials.These are negative temperature coefficient (NTC) components, and their resistance decreases with an increase in temperature as shown in the figure (b).
 A bolometer is a square-law device, similar to a crystal diode. It produces a current that is proportional to the applied power, that is, the square of the applied voltage, rather than the applied voltage.A bolometer is placed inside the waveguide as shown in Figure (c), where the bolometeritself acts as a load with R1 Ω as operation resistance. Now, low microwave power is applied that is to be measured. Bolometer load absorbs some of the power applied and dissipates it as heat, and its resistance changes to R2 Ω. This change in resistance (R1~R2) is proportional to the microwave power that can be measured using a bridge. Due to non-linear characteristics of the bolometer inaccuracy is introduced.The bolometer itself becomes one of the arms of the bridge, in the balanced bolometer bridge technique and is as shown in the figure. At first, R5 is adjusted so that the bridge is balanced.This changes the dc power applied to the bridge, and the bolometer element is brought to pre-determined operating resistance before the microwave is applied. Let the battery voltage at balance be denoted by E1.
 Bolometer bridge The microwave power applied is dissipated in the bolometer. The bridge becomes unbalanced due to the change in resistance which is due to the heating of bolometer. To balance the bridge again, the applied dc power is changed to E2. This change in dc battery voltage (E1~E2) is proportional to the microwave power. Alternately, the detector “G ” can read the microwave power directly, by balancing the bridge. This balancing of the bridge can be achieved by calibrating the detector in terms of microwave power.However, some errors can occur which can be avoided by temperature compensation, since the bolometer is a temperature sensitive device. This can be achieved by using R6 and R7 resistors.Limitations: Power-handling capability of barretters and thermistors are limited to about 10 mW. So, higher powers (> 10 mW) cannot be measured with them directly. (b) Measurement of medium microwave powerThe range of medium microwave power is from 10 mW to 1 W. The power in this range canbe measured by calorimetric techniques. The principle of calorimetric technique is that a special load which is monitored, is proportional to the power responsible for the rise as shown in the figure.
  Principle of medium power measurement The special load should have high specific heat. Generally, water is a good load. The power can be measured by knowing mass, specific heat, and temperature rise at a fixed and known rate of fluid flow (c) Measurement of high microwave powerPower between 1 W and 10 W can be considered high microwave power. These are usually measured by calorimetric watt meters. In this method also, the temperature rise of a special load is monitored to measure the microwave power as shown in the figure.A microwave calorimeter watt meter consists of two identical temperature-sensitive gauges, one in each arm, and an amplifier with high gain. The bridge is imbalanced as the input sensing resistor heats up. This heating up of the input sensing resistor is due the microwave power that is incident on the calorimeter. The circulating stream of either oil or ammonia gas is the dissipative load. By amplifying and applying the imbalance signal of the bridge to the comparison resistor and using the power delivered to it the bridge can be rebalanced. The watt meter keeps the record of the microwave power.
  Microwave calorimeter wattmeter 6.8 ATTENUATION MEASUREMENT Attenuators are used to adjust the power level of the microwave signal. If the network is perfectly matched, the reflected power is zero and the insertion loss is similar to the attenuation provided by the microwave device or component. Attenuation is defined as the ratio of input power to the output power in dB. Attenuation in(dB) log = 10log(P1/P2)where, P1 = power detected by the load without the attenuator in the lineP2 = power detected by the load with the attenuator in the lineMeasurement of attenuation is done in two ways: (i) power ratio method; (ii) RF substitution method Power Ratio MethodPower ratio method is a process of measuring the input and output power with the device (set up 1) as shown in Figure (a) and without the device (or attenuator) in the circuit as shown in Figure (b).The P1 and P2 are the powers measured in setup 1 and 2. The attenuation is the ratio of power (P1/P2) which is expressed in decibels.
  (a) Setup 1 power ratio method without the device or attenuator; (b) Setup 2 power ratio method with the device or attenuator Disadvantage of the power ratio method:The attenuation calculated will not be accurate, particularly if it is large. Because the two powers measured (P1 & P2) is non-linear. It is also true for the networks with low input power. With this method, we can measure the attenuation up to 20 dB only. RF Substitution MethodThe attenuation through the device under test is compared with a standard microwave attenuator operating at the same frequency in this method. As shown in Figure (a) the network whose attenuation is to be measured is included in the setup 1. Thus the output power “P ” is measured by this method.The drawbacks of the power ratio method can be overcome by this method as the attenuation is measured at a single power position.A precision calibrated variable attenuator replaces the network in setup 2 as shown in Figure (b).This attenuator is adjusted to get same output power “P,” as in setup 1. Under this condition, attenuation of the device is to be measured in the precision attenuator.
  6.9 VSWR MEASUREMENT VSWR stands for voltage standing wave ratio. In a perfectly matched system, there is no variation in the field strength along the waveguide. A mismatch leads to reflected waves, thereby leading to standing waves along the length of the guide. Standing waves are the indication of the quality of the transmission.VSWR = 1 for a perfectly matched system. The ratio of the maximum to the minimum voltage gives the VSWR.
  where Γ is the reflection coefficient.A typical setup for VSWR measurement is shown in the figure below.
  Block diagram for measurement of VSWR Measurement of Low VSWR (S < 10)VSWR values below 10 are very easily measured by this method. The VSWR meter directly displays these values. The setup is shown in the figure above. The attenuator is adjusted to give a maximum reading on the meter. The attenuation has to be adjusted to get a full-scale reading. Then, the minimum reading on the meter is obtained by adjusting the probe on the slotted line. Thus the VSWR is defined by the ratio of the first reading to the second reading. The meter can be calibrated in terms of VSWR.Here, attenuator is adjusted so that the traveling probe gives a maximum deflection on the VSWR meter. The VSWR of 1 corresponds to full-scale deflection (i.e. 10 mV in the meter). By adjusting the travelling probe the minimum reading can be obtained on the meter. Measurement of High VSWR(S > 10)VSWR greater than 10 can be measured by double minimum method. In this method, the probe is inserted to a depth where the minimum value can be read easily. Then the probe should be moved to a point where the power is twice the minimum (Pmin = 2V2min/RL, i.e. Pmin = 2P). Let d1 be this position. Then again, the probe is moved to twice the power point on the other side of the minimum (say d2) as shown in the figure below.
  For the dominant TE10 mode rectangular waveguide, λ0, λg, and λc are related as below.
  The VSWR can be calculated using the empirical relation
  6.10 IMPEDANCE MEASUREMENT Impedance (Z) is defined as the ability to oppose the flow of an alternating current (AC ) at a given frequency. It is represented as a complex quantity and is graphically shown on a vector plane. An impedance vector consists of a real part (resistance, R) and an imaginary part (reactance, X ) as shown in the figure below. Z = R + jX = Z
  There are many methods for measuring impedance, each of which has advantages and disadvantages.The most commonly used method is the measurement of impedance using the slotted line. Measurement of Impedance Using a Slotted LineThe end of the slotted line is connected to the unknown impedance as shown in the figure below. From the other end of the coaxial line microwave power is fed. A part of the power is reflected by the unknown impedance. By evaluating the standing wave fields in the slotted line this reflection coefficient is measured.The reflection coefficient Γ, is given by,
  Impedance measurement using slotted line 6.11 MEASUREMENT OF Q OF A CAVITY RESONATOR A volume that is completely surrounded by a metallic surface is defined as a cavity. The important parameter of a cavity is quality factor. It is a measure of selectivity of the frequency resonant or anti resonant circuit and is defined by the following equation:
  The cavity resonator is used as a transmission device, in this method, and the output power is measured as a function of the frequency resulting in the resonance curve as shown in the figure below,
  The output power is to be measured by two methods(i) Changing the frequency of the source of the microwave and by keeping the signal level constant.(ii) Tuning the cavity and by keeping both signal level and frequency constant, the output power is measured. The half-power bandwidth can be calculated (2Δ) from the resonance curve in the Figure .
  where QL = loaded valueQ0 = unloaded QQL = Q0 if the coupling between microwave source and cavity and that between detector and cavity are neglected. 6.12 MEASUREMENT OF PHASE SHIFT The phase shift introduced by a microwave network can be measured by using the set-up shown in the figure below. As it is not possible to distinguish between one-quarter wavelength and say, seven quarter wavelengths, we must have an approximate idea of the networks electrical length.Also, we know that each wavelength (λg), corresponds to a phase shift of 2 radians, knowingthe approximate electrical lengths of the network, phase shift can be determined to a fairly accurate value as follows. (i) The source with a 1 kHz sine wave amplitude modulation is split up into two equal parts using the H-plane Tee junction, one going to the unknown network whose accurate phase shift is to be measured and the other to the comparison adjustable precision phase shifter.(ii) Standard precision phase shifter is now adjusted until the two demodulated 1 kHz sinewave on the CRO are in phase, as shown by the figure, and the relative phase shift of the twonetworks are now equal. (iii) Dial reading on the precision phase shifter now gives the phase shift offered by the device as shown in the figure, to which the multiplies of 360° is to be added.If from the preliminary measurement we get the phase shift of the unknown network to be inthe vicinity of 4kg − 1440° and the reading on the calibrated precision phase shifter is 15°, then the total phase shift must be 1440° + 15°= 1455. If the reading is 310°, i.e. more than 180°, then the total phase shift must be [1080° (360 − 310)] = [1080° − 50°] = 1030°.


Reference Books1. M. Kulkarni, “Microwave and Radar engineering”, 3rd edition, Umesh Publications2. ML Sisodia& GS Raghuvamshi, “Microwave Circuits and Passive Devices”Wiley, 19873. M L Sisodia& G S Raghuvanshi, “Basic Microwave Techniques and LaboratoryManual”, New Age International (P) Limited, Publishers.
0 matching results found
Browse by Topics