Unit - 6
Transmission Line Theory
A transmission line is a means of transfer of information from one point to another. Usually, it consists of two conductors. It is used to connect a source to a load. The source may be a transmitter and the load may be a receiver.
The performance of transmission line depends on the parameters of the line. The transmission line has mainly four parameters, resistance, inductance, capacitance and shunt conductance. These parameters are uniformly distributed along the line. Hence, it is also called the distributed parameter of the transmission line.
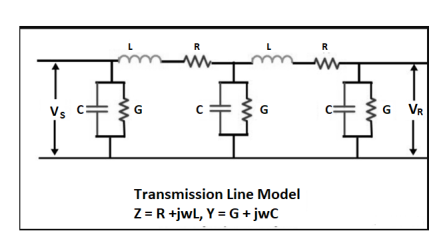
Figure. Transmission Line
The inductance and resistance form series impedance whereas the capacitance and conductance form the shunt admittance.
Line inductance – The current flow in the transmission line induces the magnetic flux. When the current in the transmission line changes, the magnetic flux also varies due to which emf induces in the circuit. The magnitude of inducing emf depends on the rate of change of flux. Emf produces in the transmission line resist the flow of current in the conductor, and this parameter is known as the inductance of the line.
Line capacitance – In the transmission lines, air acts as a dielectric medium. This dielectric medium constitutes the capacitor between the conductors, which store the electrical energy, or increase the capacitance of the line. The capacitance of the conductor is defined as the present of charge per unit of potential difference.
Capacitance is negligible in short transmission lines whereas in long transmission; it is the most important parameter. It affects the efficiency, voltage regulation, power factor and stability of the system.
Shunt conductance – Air act as a dielectric medium between the conductors. When the alternating voltage applies in a conductor, some current flow in the dielectric medium because of dielectric imperfections. Such current is called leakage current. Leakage current depends on the atmospheric condition and pollution like moisture and surface deposits.
Shunt conductance is defined as the flow of leakage current between the conductors. It is distributed uniformly along the whole length of the line. The symbol Y represented it, and it is measured in Siemens.
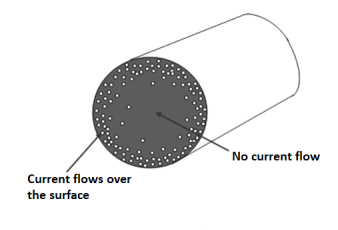
When an alternating current pass through a conductor it does not flow uniformly all over the conductor. The concentration of current is higher on the surface of the conductor than at the centre, thus increasing the effective resistance. This effect is called the skin effect which is prominent at the higher frequency. The skin effect increases with the increase of cross section and permeability of conductor and reduced in stranded conductors.
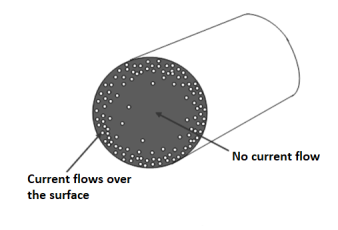
The solid conductor considered can be thought of having a number of strands one over the other, each carrying some portion of the current, so the inductance of each stand will be vary and will increase towards the center. The high reactance of the strands near the center will increase the tendency of the current to flow with greater density near the outer stands. This result in a more power loss for a given r.m.s value of current, or the effective resistance is increased, also skin effect decreases the effective internal reactance. According to Maxwell and Rayleigh, the ratios of skin-effect resistance to direct current resistance and the skin-effect reactance to direct current reactance are given as:


Where 
Hence the skin effect resistance and reactance depend upon frequency. For high-frequency currents, the skin effect predominates. The above formulae are not much used practically. For practical purpose the value of m is given as.

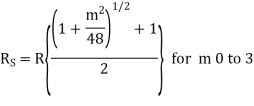
The empirical formula for Rs are:
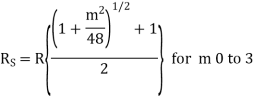
And  for m above 3.
The Skin effect depends upon the following factors:
- Nature of material.
- It is directly proportional to diameter of conductor.
- It is proportional to frequency of supply. Skin effect increases with the increase in frequency.
- It Depends on the shape of the conductor. Skin effect less for standard conductor than the solid conductor.
The general solution of a transmission line includes the expressions for current and voltage at any point along the line of any length having uniformly distributed constants.
The various notations used in this derivation are,
 Series resistance ohms per unit length, including both the wires
L = series inductance, henry per unit length
C= Capacitance between the conductors, farads per unit length
G= Shunt leakage conductance between the conductors, mhos per unit length
L= Series reactance per unit length
Z=R+jL=Series impedance in ohms per unit length
Y=G+jC=Shunt admittance in mhos per unit length
 Distance upto point of consideration, measured from receiving end
I=current in the line at any point
E=Voltage between the conductors at any point
I=Length of the line
The transmission line of length l can be considered to be made up of infinitesimal T sections. One such section of length ds is shown in figure. It carries current I.

The point under consideration is at a distance s from the receiving end. The length of section is ds hence its series impedance is Zds and shunt admittance is Yds. The current is I and voltage E.
The elemental voltage drop in the length ds is


The leakage current flowing through shunt admittance from one conductor to other is given by


Differentiating equation (1) and (2) with respect to s we get


This is because both E and I are functions of s.


The equations (3) and (4) are the second order differential equations describing the transmission line having distributed constants all along its length. It is necessary to solve these equations to obtain expressions of E and I.
Replace the operator d/ds by m we get
 but E
but E

So there exists two solutions for positive sign of m and negative side ofm. The general solution for E and I are


Where A, B, C and D are arbitrary constants of integration.
To obtain A, B, C, D
As distance is measured from the receiving end, s=0 indicates the receiving end.
 and
and 
Substituting in the solution
 8(a)
8(a)
 8(b)
8(b)
Same condition can be used in the equations obtained by differentiating the equations (6) and (7) with respect to s.


 and
and 

And 


Now use s=0, E= and
and 


The equation 8a, 8b, 13a and 13b are to be solved simultaneously to obtain the values of the constants A, B, C and D.
Now while solving these equations use the results,
 and
and 
Hence the various constants obtained, after solving the equations simultaneously are,
 (14)
(14)
 (15)
(15)
 (16)
(16)
 (17)
(17)
Hence the general solution of the differential equations is
 (18)
(18)
 (19)
(19)
Taking LCM as  and taking
  out from equation (18)
 (20)
(20)
Taking LCM as  and taking
  out from equation (18)
 (21)
(21)
The negativ sign is used to convert  to
to 
The equations (20) and (21) is the general solution of a transmission line.
Another way of representing the equation is,


 hence
hence 


But  and
and 

 cosh
cosh 
The equation (24) and (25) give the values of E and I at any point along the length of the line.
If x is the distance measured down the line from the sending end
And the equations (24) and (25) get transferred interms of  ,
,


And  as derived earlier and hence equations can be written interms of propagation constant y.
Summarizing,
If receiving end parameters are kknown and s is distance measured from the receiving end then,


From the equations, the sending end current can be obtained by substituting s=l measured from the end.


 (1)
(1)
Now if the line is terminated in its characteristic impedance  then
then
 as
as 

This is the equation which is already derived for the line terminated in  using
using
This is the equation which is already derived for the line terminated in  . Using
 in equation (1)

 (1)
(1)
Dividing (2) by (1)


When the line is terminated in  then
then  . So, substituting in equation (6) we get

This shows that for a line terminated in its characteristic impedance its input impedance is also its characteristic impedance.
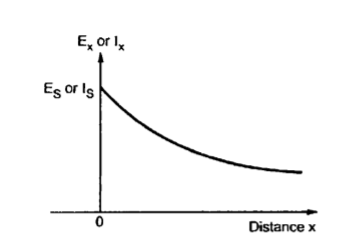
Now consider an infinite line with  . Using this in equation (6) we get,

And tanh (l) as
as 

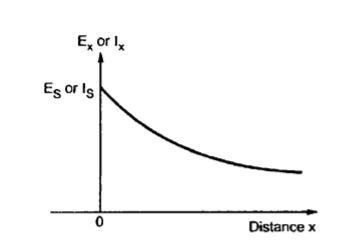
This shows that finite line terminated in its characteristic impedance behaves as an infinite line, to the sending end generator.
Thus the equation for  and
and  are applicable for the finite line terminated in
  The equations are reproduced here for the convenience of the reader


Where
 Wavelength
 Velocity of propagation
f=frequency of signal
Velocity of propagation is a measure of how fast a signal travel over time, or the speed of the transmitted signal as compared to the speed of light.
In computer technology, the velocity of propagation of an electrical or electromagnetic signal is the speed of transmission through a physical medium such as a coaxial cable or optical fiber.
A theoretical loss less coaxial cable working at high frequencies has a velocity of propagation that can be calculated as
Vp = 1/  ------------------(1)
Where vp is the velocity of propagation in m/s
C is the distributed capacitance per unit length in pF
L is the distributed inductance per unit length in µH
The phase velocity vp (propagation velocity) of a wave in a transmission line is:
Vp = ω / β ------------------(1)
Where
β = Im {γ} = Im {  (G + jwC)}
Thus, for a lossy line, the phase velocity vp is a function of frequency ω which means vp(w) is bad. In other words, the signal energy is spread across many frequencies.
If different frequencies that comprise a signal travel at different velocities that signal will arrive at the end of a transmission line as distorted. This phenomenon is called signal dispersion.
For lossless line the phase velocity is independent of frequency which means no dispersion will occur.
Vp = 1/  [R=0, G=0].
It is not possible to obtain perfect lossless line but the phase velocity is approximate constant if the line is low-loss.
Heaviside found that transmission line is distortion less if the line parameters exhibit the following ratio:

The complex propagation constant γ is expressed as
γ = 
=  LC(R/L = jw) (G/C + jw)
If R/L = G/C we find that
 LC(R/L +jw) (R/L + jw) = (R/L +jw)
  LC
LC
= R  + jw
+ jw
Thus α = Re{γ} = R 
β = Im {γ} = w 
The propagation velocity of the wave is :
Vp = w / β = 1/ 
The propagation velocity is independent of frequency.
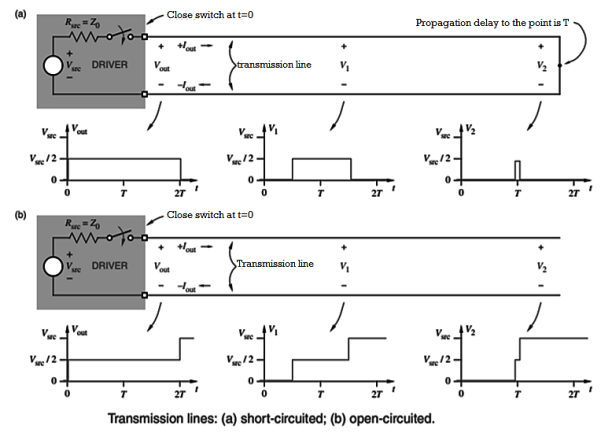
Consider a pair of conductors with infinite length, as shown in Figure Zo-1(a). If we instantaneously put a voltage source across the pair, certain current flows to create a voltage wave that travels along the pair.
The ratio of voltage to current, Vout /Iout, depends on the physical characteristics of the conductors and is called the characteristic impedance Z0 of the conductor pair.
The magnitude of Vout is determined by viewing the series combination of Rsrc and Z0 as a voltage divider, so that
Vout = Vsrc Z0 / Rsrc + Z0
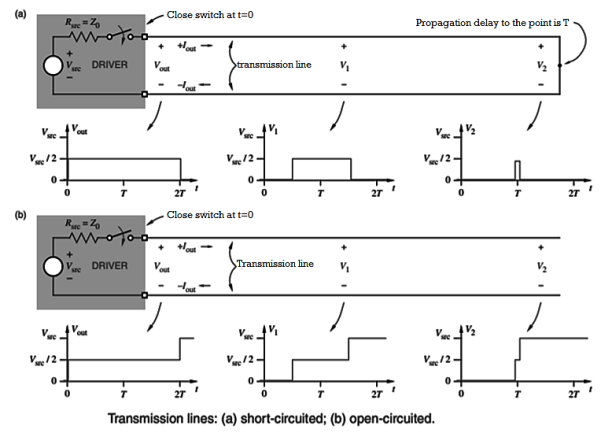
The situation is different for a transmission line of finite length that is not terminated in its characteristic impedance. The far end is short-circuited, as shown in Figure Zo-2(a). Assume that Rsrc = Z0 in this example. Initially, all the driver sees is the line’s characteristic impedance, and a voltage wave with amplitude Vsrc/2 propagates down the line.
However, when the wave hits the far end at time T, it sees the short circuit. In order to satisfy Kirchhoff’s laws, a voltage wave of the opposite polarity propagates back down the line, cancelling the original wave. The far end has reflected the original wave, and the driver sees the short-circuit at time 2T.
The case, in which the far end is open-circuited, is shown in (b). Everything starts out as before. However, when the initial voltage wave hits the far end, the current has nowhere to go, and so a voltage wave of the same polarity propagates back up the line, adding to the original voltage. When the reflected wave reaches the driver at time 2T, the voltage everywhere is Vsrc, and nothing more happens.
In the general case, the amplitude of the wave reflected at the end of a transmission line is determined by the reflection coefficient, ρ (rho). The value of ρ depends on Z0 and Zterm or ZL, the termination impedance at the end of the line:
The voltage reflection coefficient at any point on the line is the ratio of the reflected voltage wave to that of the incident wave.


The current reflection coefficient at any point on the line is the negative of the voltage reflection coefficient at that point.
Zterm = Z0 When a transmission line is terminated in its characteristic impedance, the reflection coefficient is 0.
Zterm = 0 The reflection coefficient of a short-circuited line is −1, producing a reflection of equal magnitude and opposite polarity.
Zterm = ∞ The reflection coefficient of an open-circuited line is +1, producing a reflection of equal magnitude and the same polarity.
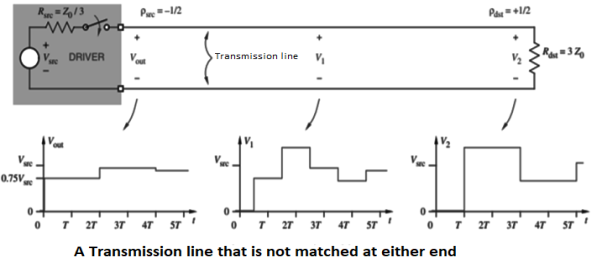
Figure shows the behaviour of a transmission line that is not matched at either end. (Note that the driver’s ideal voltage source Vsrc is considered to have a resistance of 0 Ω for this analysis.) Reflections occur at both ends of the line, with smaller and smaller waves reflecting back and forth.
The voltage everywhere on the line asymptotically approaches 0.9Vsrc, the value that would be predicted by a “DC” analysis of the circuit using Ohm’s law.
Reflection Loss: It is defined as the number of nepers or decibels by which the current in the load under image matched conditions would exceed the current actually flowing in the load.
Reflection loss, nepers
Reflection loss, db
Reflection Factor: The term K denotes the reflection factor. This ratio indicates the change in current in the load due to reflection at the mismatched junction and is called the reflection factor.

Standing waves represent power that is not accepted by the load and reflected along the transmission line or feeder.
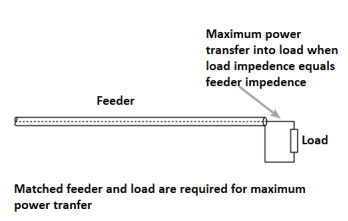
In order to obtain the maximum power transfer from the source to the transmission line, or the transmission line to the load, be it a resistor, an input to another system, or an antenna, the impedance levels must match.
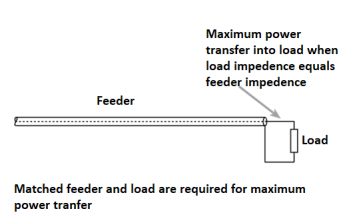
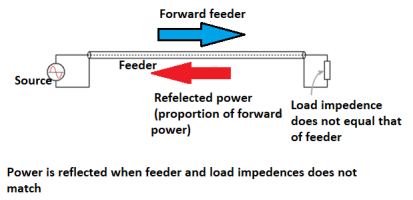
Issues arise when power is transferred into the transmission line or feeder and it travels towards the load. If there is a mismatch, i.e. the load impedance does not match that of the transmission line, then it is not possible for all the power to be transferred.
As power cannot disappear, the power that is not transferred into the load has to travel somewhere and there it travels back along the transmission line back towards the source.
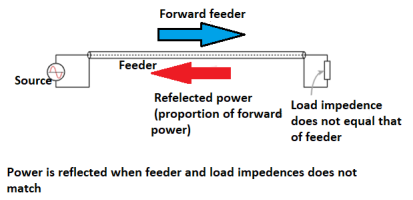
When this happens the voltages and currents of the forward and reflected waves in the feeder add or subtract at different points along the feeder according to the phases. In this way standing waves are set up.
If one end is fixed a standing wave motion is set up, and points of minimum and maximum vibration can be seen.
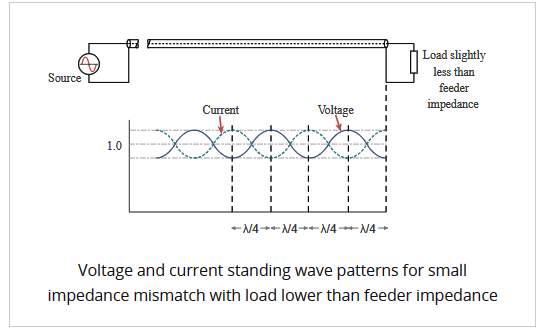
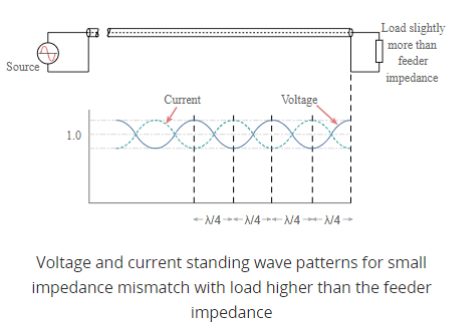
The values of current and voltage along the feeder vary along the feeder. For small values of reflected power, the waveform is almost sinusoidal, but for larger values it becomes more like a full wave rectified sine wave. This waveform consists of voltage and current from the forward power plus voltage and current from the reflected power.
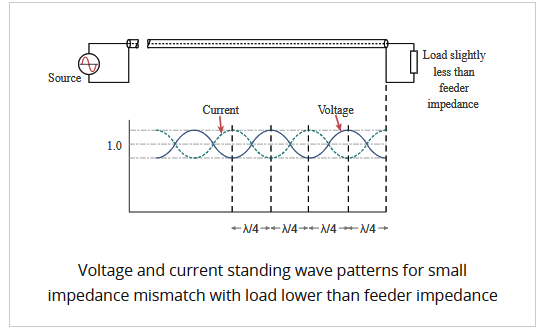
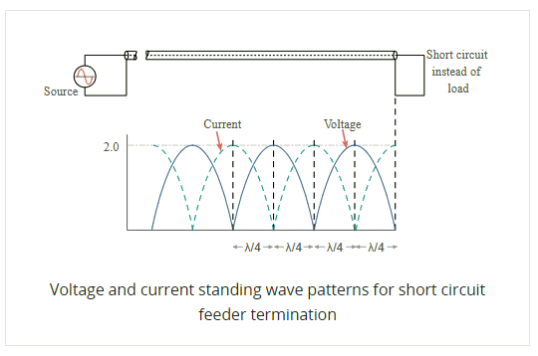
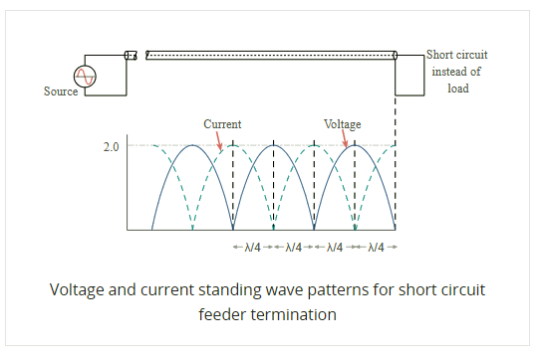
At a distance a quarter of a wavelength from the load the combined voltages reach a maximum value whilst the current is at a minimum. At a distance half a wavelength from the load the voltage and current are the same as at the load.
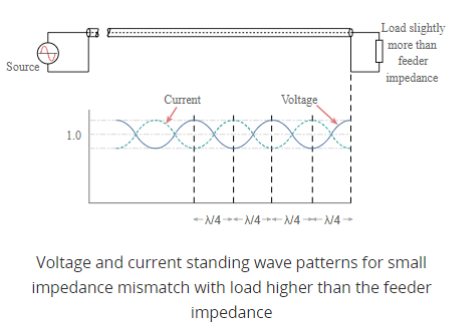
A similar situation occurs when the load resistance is greater than the feeder impedance however this time the total voltage at the load is higher than the value of the perfectly matched line. The voltage reaches a minimum at a distance a quarter of a wavelength from the load and the current is at a maximum. However at a distance of a half wavelength from the load the voltage and current are the same as at the load.
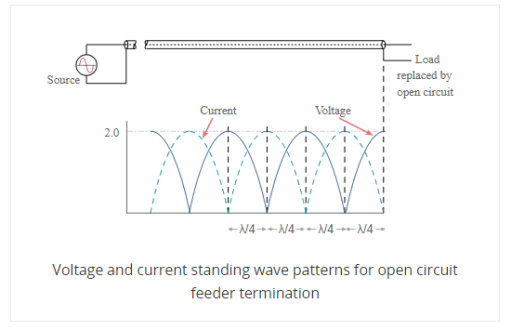
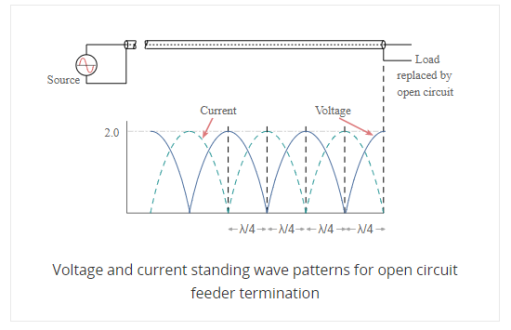
Then when there is an open circuit placed at the end of the line, the standing wave pattern for the feeder is similar to that of the short circuit, but with the voltage and current patterns reversed.
SWR stands for standing wave ratio. It describes the voltage and current standing waves that appear on the line. It is a generic description for both current and voltage standing waves. It is often used in association with meters used to detect the standing wave ratio. Both current and voltage rise and fall by the same proportion for a given mismatch.
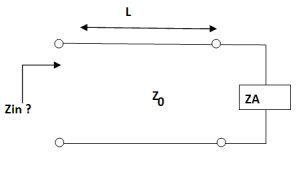
Consider the following circuit:
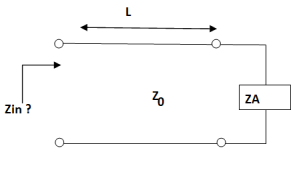
In low frequency circuit theory, the input impedance would simply be ZA. However, for high-frequency (or long) transmission lines, we know that the voltage and the current are given by:


Assume the transmission line is lossless, so that the propagation constant is purely imaginary. If we define z=0 to be at the terminals of the load or antenna, then we are interested in the ratio of the voltage to the current at location z=-L:


The above equation can be manipulated algebraically, and when evaluated at z=-L, we obtain:

This last equation is fundamental to understanding transmission lines. The input impedance of a load ZA is transformed by a transmission line as in the above equation. This equation can cause ZA to be transformed radically.
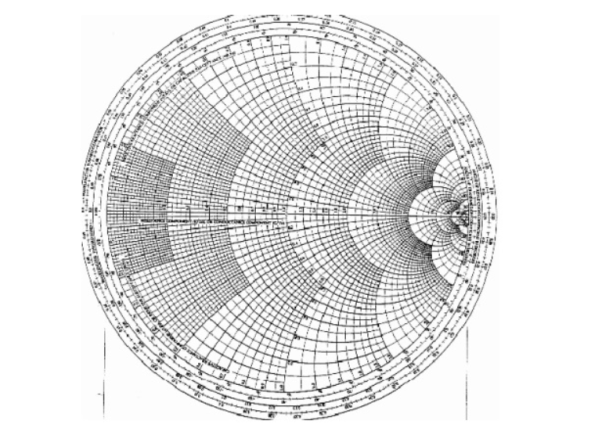
The Smith Chart is a tool for visualizing the impedance of a transmission line and antenna system as a function of frequency. Smith Charts can be used to increase understanding of transmission lines and how they behave from an impedance viewpoint.
Smith Charts are also extremely helpful for impedance matching. The Smith Chart is used to display a real antenna's impedance when measured on a Vector Network Analyzer (VNA).
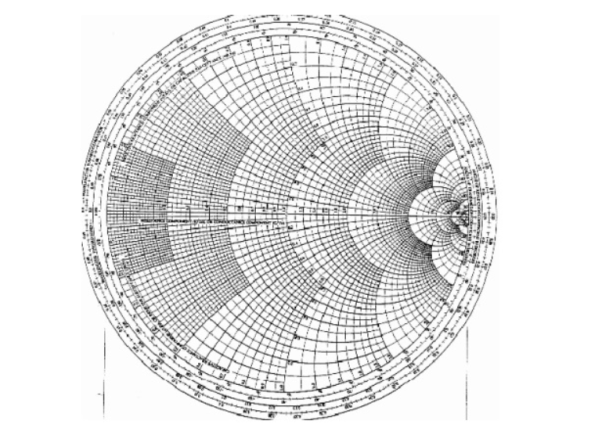
Basic smith chart
The Smith Chart displays the complex reflection coefficient, in polar form, for an arbitrary impedance
The complex reflection coefficient () for an impedance ZL attached to a transmission line with characteristic impedance Z0 is given by

Let us assume Z0 is 50 Ohms, which is often. The complex reflection coefficient, or, must have a magnitude between 0 and 1.
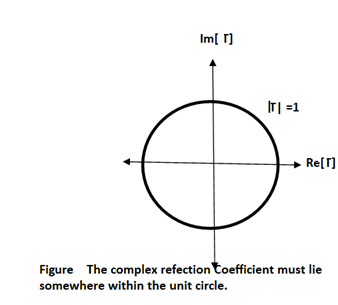
As such, the set of all possible values for must lie within the unit circle:
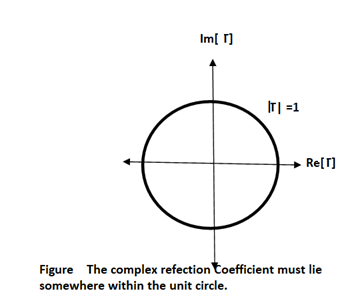
In Figure, plotting the set of all values for the complex reflection coefficient, along the real and imaginary axis. The center of the Smith Chart is the point where the reflection coefficient is zero. That is, this is the only point on the smith chart where no power is reflected by the load impedance.
The outer ring of the Smith Chart is where the magnitude of is equal to 1. This is the black circle in Figure 1. Along this curve, all of the power is reflected by the load impedance.
Normalized Load Impedance
To make the Smith Chart more general and independent of the characteristic impedance Z0 of the transmission line, we will normalize the load impedance ZL by Z0 for all future plots:
 ………….[1]
Equation [1] doesn't affect the reflection coefficient tow. It is just a convention that is used everywhere.
Constant Resistance Circles
For a given normalized load impedance zL, we can determine and plot it on the Smith Chart. Now, suppose we have the normalized load impedance given by:

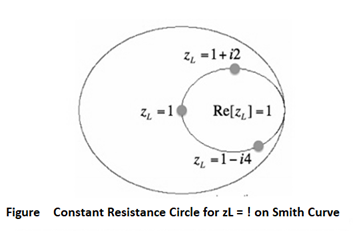
In equation [2], Y is any real number. What would the curve corresponding to equation [2] look like if we plotted it on the Smith Chart for all values of Y? That is, if we plotted z1 = 1 + 0*i, and z1 = 1 + 10*i, z1 = 1 - 5*i, z1 = 1 - .333*i, .... And any possible value for Y that you could think of, what is the resulting curve? The answer is shown in Figure below:
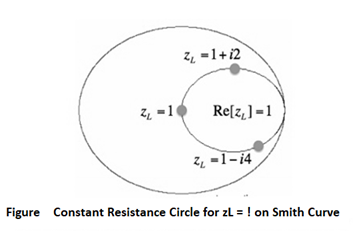
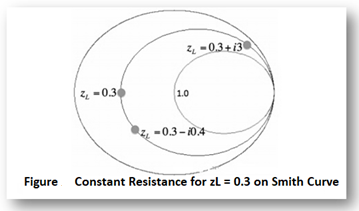
In this Figure, the outer blue ring represents the boundary of the smith chart. The black curve is a constant resistance circle: this is where all values of z1 = 1 + i*Y will lie on. Several points are plotted along this curve, z1 = 1, z1 = 1 + i*2, and zL = 1 - i*4. Suppose we want to know what the curve z2 = 0.3 + i*Y looks like on the Smith Chart. The result is shown in Figure below:
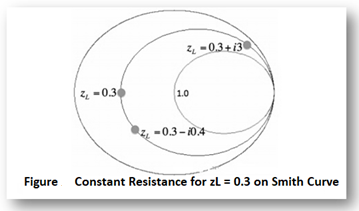
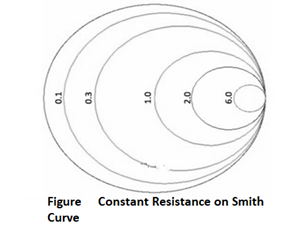
In this Figure, the black ring represents the set of all impedances where the real part of z2 equals 0.3. A few points along the circle are plotted. We've left the resistance circle of 1.0 in red on the Smith Chart. These circles are called constant resistance curves. The real part of the load impedance is constant along each of these curves. Now add several values for the constant resistance, as shown in Figure below:
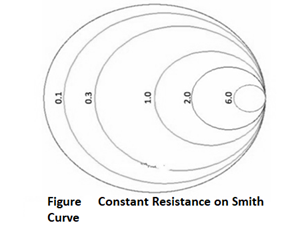
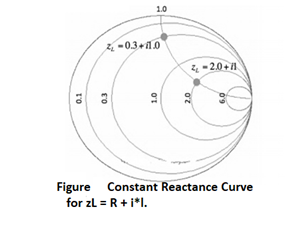
In above Figure, the zL=0.1 resistance circle has been added in purple. The zL=6 resistance circle has been added in green, and zL=2 resistance circle is in black. Look at the set of curves defined by zL = R + iY, where Y is held constant and R varies from 0 to infinity. Since R cannot be negative for antennas or passive devices, we will restrict R to be greater than or equal to zero. As a first example, let zL = R + i. The curve defined by this set of impedances is shown in Figure below:
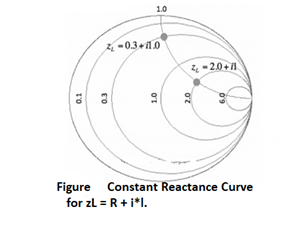
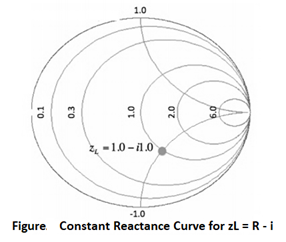
The resulting curve zL = R + i is plotted in green in Figure above. A few points along the curve are illustrated as well. Observe that zL = 0.3 + i is at the intersection of the Re[zL] = 0.3 circle and the Im[zL]=1 curve. Similarly, observe that the zL = 2 + i point is at the intersection of the Re[zL]=2 circle and the Im[zL]=1 curve. (For a quick reminder of real and imaginary parts of complex numbers, see complex math primer.) The constant reactance curve, defined by Im[zL]=-1 is shown in Figure below:
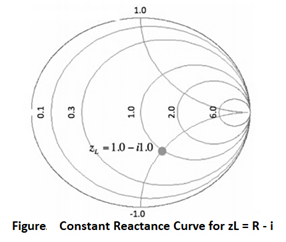
The resulting curve for Im[zL]=-1 is plotted in green in Figure above. The point zL=1-i is placed on the Smith Chart, which is at the intersection of the Re[zL]=1 circle and the Im[zL]=-1 curve.
An important curve is given by Im[zL]=0. That is, the set of all impedances given by zL = R, where the imaginary part is zero and the real part (the resistance) is greater than or equal to zero. The result is shown in Figure below:
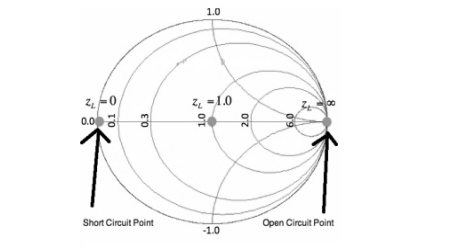
Figure. Constant Reactance Curve for zL=R. The reactance curve given by Im[zL]=0 is a straight line across the Smith Chart.
There are 3 special points along this curve.
On the far left, where zL = 0 + i0, this is the point where the load is a short circuit, and thus the magnitude of is 1, so all power is reflected. In the center of the Smith Chart, we have the point given by zL = 1. At this location, is 0, so the load is exactly matched to the transmission line. No power is reflected at this point.
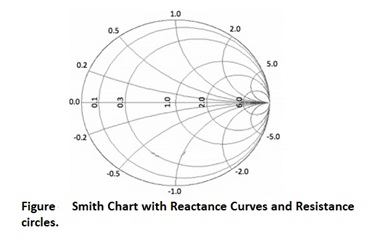
The point on the far right in Figure aboce is given by zL = infinity. This is the open circuit location. Again, the magnitude of is 1, so all power is reflected at this point, as expected. Finally, we'll add a bunch of constant reactance curves on the Smith Chart, as shown in Figure below.
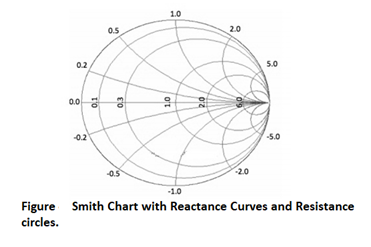
In Figure, we added constant reactance curves for Im[zL]=2, Im[zL]=5, Im[zL]=0.2, Im[zL]=0.5, Im[zL]=-2, Im[zL]=-5, Im[zL]=-0.2, and Im[zL] = -0.5. Figure above shows the fundamental curves of the Smith Chart.
PROBLEMS:
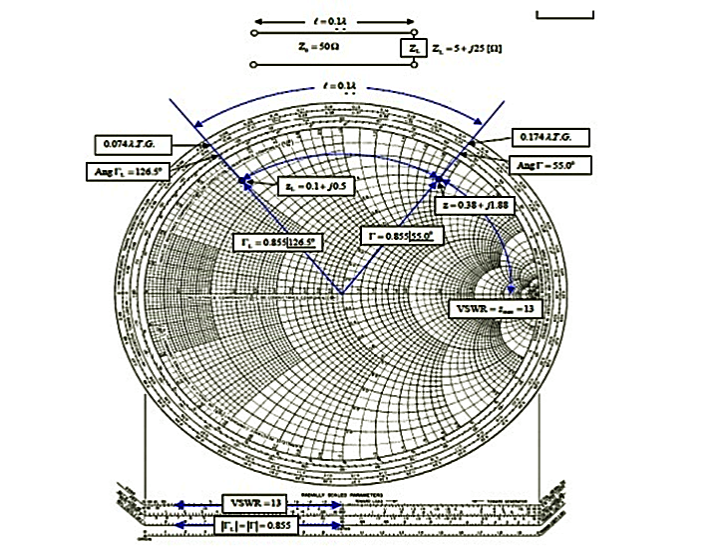
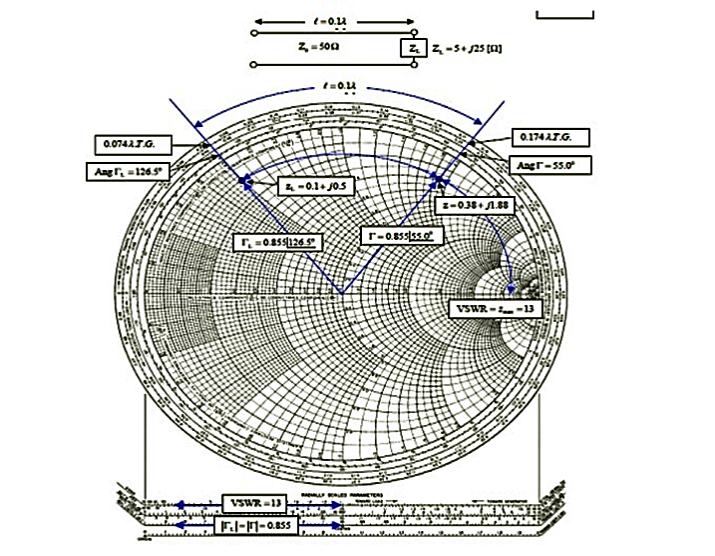
(i). The 0.1λ length line shown has a characteristic impedance of 50 and is terminated with a load impedance of ZL = 5+j25.
(a) Locate zL = ZL/Z0 = 0.1 + j0.5 on the Smith chart.
(b)What is the impedance at l = 0:1λ?
Since we want to move away from the load (i.e., toward the generator), read 0.074 λ on the wavelengths toward generator scale and add l = 0.1 λ to obtain 0.174 λ on the wavelengths toward generator scale.
A radial line from the center of the chart intersects the constant reflection Co-efficient magnitude circle at z = 0.38 + j1.88. Hence Z = zZ0 = 50(0.38 + j1.88) = 19 + 94Ω.
(c) What is the VSWR on the line?
Find VSWR = Zmax = 13 on the horizontal line to the right of the chart's center. Or use the SWR scale on the chart.
(d) What is ΓL?
From the reflection coefficient scale below the chart,
Find |ΓL| = 0.855. From the angle of reflection coefficient scale on the perimeter of the chart, Find the angle of ΓL=126.5₀. HenceΓL=0.855e j126.5₀.
(e) What is Γ at l = 0.1λ from the load?
Note that |Γ| =|ΓL|=0.855. Read the angle of the reflection coefficient from the angle of reflection coefficient scale as 55.0₀. Hence ΓL=0.855e j126.5₀.
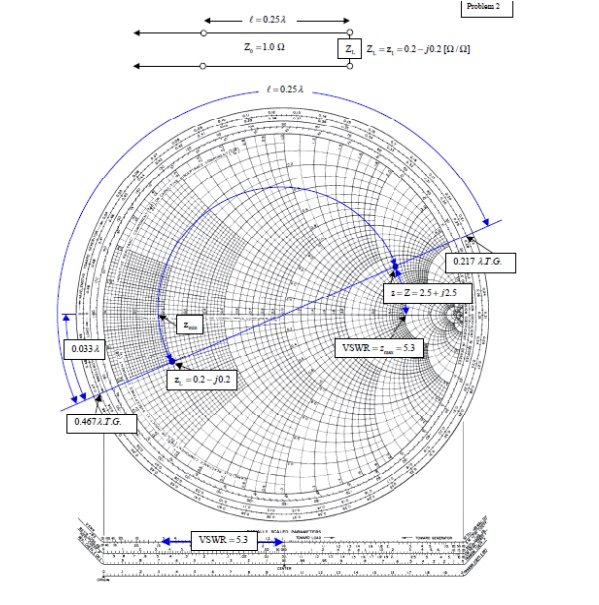
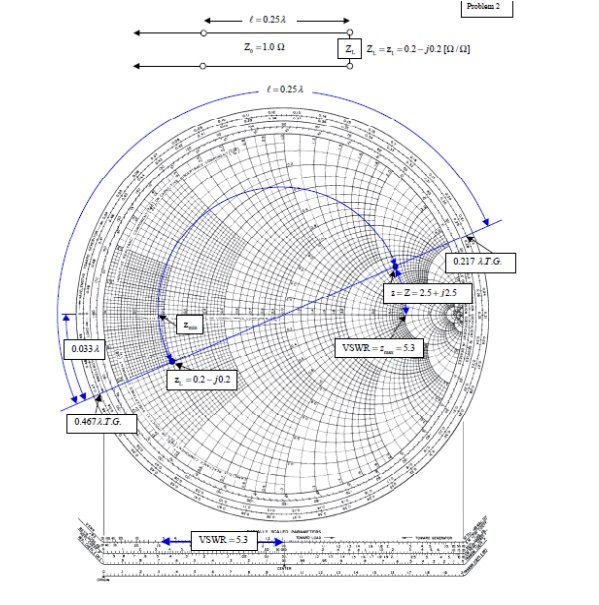
(ii). A transmission line has Z0 = 1.0, ZL = zL = 0.2- j0.2Ω.
(a) What is z at l =λ/4=0.25 λ?
From the chart, read 0:467λfrom the wavelengths to-ward generator scale. Add 0.25λ to obtain 0.717 λ on the wavelengths toward generator scale. This is not on the chart, but since it repeats every half wavelength, it is the same as 0.717 λ– 0.500 λ = 0.217 λ. Drawing a radial line from the center of the chart, we find an intersection with the constant reflection coefficient magnitude circle at z = Z = 2.5 + j2.5.
(b) What is the VSWR on the line?
From the intersection of the constant reflection coefficient circle with the right hand side of the horizontal axis, read VSWR= zmax = 5.3.
(c) How far from the load is the first voltage minimum?
The voltage minimum occurs at zmin which is at a distance of 0.500λ-0.467λ = 0:033λ from the load. Or read this distance directly on the wavelengths toward load scale. The current minimum occurs at zmax which is a quarter of a wavelength farther down the line or at 0.033λ+0.25λ = 0.283λ from the load.
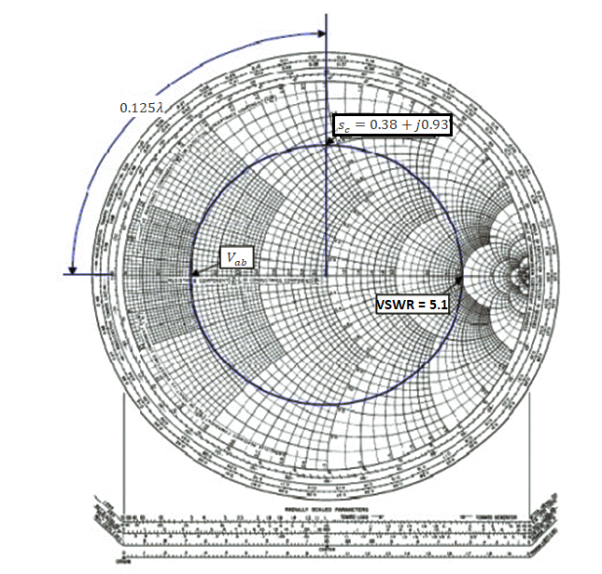
(iii) A slotted line measurement yields the following parameter values:
(a) Voltage minima at 9.2 cm and 12.4 cm measured away from the load with the line terminated in a short.
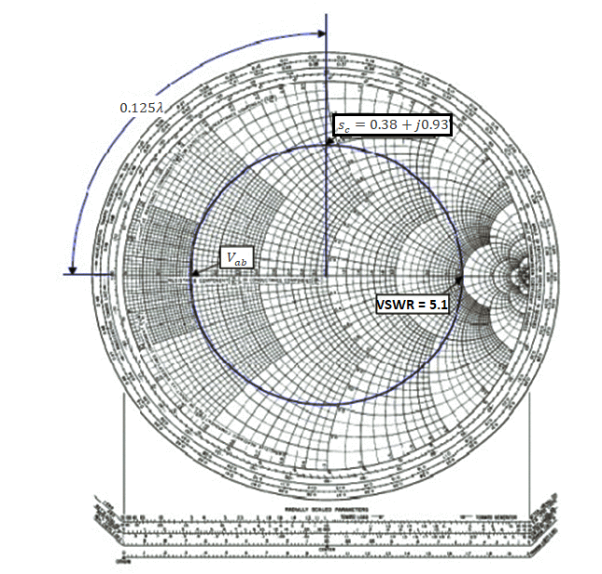
(b) VSWR = 5.1 with the line terminated in the unknown load; a voltage minimum is located 11.6 cm measured away from the load.
What is the normalized line impedance?
Note that this data could have come from either a waveguide or a TEM line measurement. If the transmission system is a waveguide, then the wavelength used is actually the guide wavelength. From the voltage minima on the shorted line, the (guide) wavelength may be determined:
λg/2=12.4cm-9.2 cm=3.2 cm or λg=6.4 λg
Hence the shift in the voltage minimum when the load is replaced by a short is
12.4cm-11.6cm/6.4cm/ λg=0.125 λg
Toward the generator. Locate the reflection coefficient magnitude circle by its intersection with zmax = VSWR = 5:1 on the horizontal axis. Then from the voltage minimum opposite zmax, move 0.125 λg toward the generator to find a position an integral number of half-wavelengths from the load. The impedance there is the same as that of the load, zL = 0.38 +j0.93. Alternatively, move 0.5 λg– 0.125 λg = 0.375 λg toward the load to locate the same value.
General solution, physical significance of the equations, wavelength, velocity of propagation, the distortion less line, Reflection on a line not terminated in Z0, reflection coefficient, open and short circuited lines, reflection factor and reflection loss, standing waves; nodes; standing wave ratio, Input impedance of dissipation less line, Input impedance of open- and short-circuited lines, Power and impedance measurement on lines, Reflection losses on the unmatched Load, Problems solving using Smith chart.
- Short-Circuit Lines:
Consider a transmission line of length L, but suppose the end of line is short-circuited together so that ZA =0. Then the impedance equation is:

We can determine input impedance for short circuit line:(input admittance 1/Z)
 (short-circuited Line)
 (short-circuited admittance)
Example:
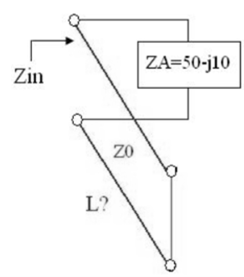
Suppose an antenna has an impedance ZA = 50 – j * 10. Using short-circuit transmission line with Z0 = 50 and u=c in parallel with antenna. Transform the input impedance to be entire real.
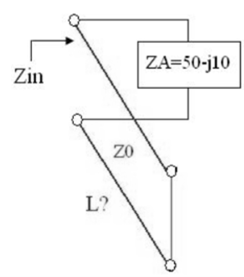
The admittance of the load is:
YA = 1/ZA = 1/ (50 – j * 10) = YA = 0.0192 + j * 0.0038
If reactance is added in parallel with a value of YA = - j * 0.0038 the admittance will be entirely real so the impedance will real.
Smith Chart applications in solving the transmission line parameters
In any domain of RF engineering, the Smith chart has various applications. Few of the foremost applications of the smith chart are
- It is used in the transmission line is used to calculate impedance provided at any load
- The chart is even employed to calculate admittance values provided at any load.
- Used in the measurement of the length of the short-circuited section of the Transmission line in order to offer the required amount of inductive reactance of capacitance.
- Used for the purposes of impedance matching.
- Employed to know the value of VSWR amongst others.
Let us consider an example of how to use a smith chart for impedance matching in the case of transmission lines and antennas.
Here the application of the chart is to find out the components (capacitor or inductor) value which makes sure that the lines are properly matched thus states that the reflection coefficient is ‘0’.
For instance, when the impedance value is considered as Z = 0.5 – 0.6j. Here, initially, we need to know the resistance circle that has a value 0.5 on the chart. As the impedance value is negative, which implies that we mean a capacitive impedance, we need to move it in the anti-clockwise direction across the 0.5 valued resistance circle to know the point where it touches the negative 0.6 reactance arc. This provides a thought of the component’s value that helps in matching the line to the load.
Standardized scaling let the smith chart to be implemented in the applications, which have any distinctive, or system impedance that represents the chart’s focal point. In the case of impedance charts, the generally used value of normalization impedance is 50 ohms where is used for simply tracing the impedance.
When the result is found through this, we can directly transform in between normalized impedance and the relevant unnormalized value by multiplying with the admittance value. With this reflection, coefficients are easily known. Additionally, these are also employed to solve the complication those arise with a change in frequency values for impedance and admittances.
It is easy to solve the problems which have one frequency value at a time, whereas in the case of bandwidth applications, it seems to be complicated which works with multiple frequencies. This is solved by smith chart and the outcome is shown as Locus with all the frequency ranges are close to each other. These locus points corresponds that
- How the inductive or capacitive load varies through the determined frequency range
- How complicated matching is probable to be at multiple frequency levels
- How properly a component is matched.
Coaxial Cable
A coaxial cable is essentially a pair of conductors with a dielectric material separating them. These two conductors provide a path for the current from the pulse signal to travel. As seen in Figure, there is an outer conductor and an inner conductor. The reflected wave will appear when the impedance of the cable changes. An impedance change is caused by discontinuity in the signal carrier. This discontinuity is caused by some type of change or interruption in the path of the current, which is brought about either by a geometric change or by a change in topology of one of the conductors or by change of dielectric.
Coaxial cables have various characteristic impedances, with 50, 75, and 93 ohms being the most common. They have the advantage of operating at very high frequencies, which allows them to carry a very large number of analog or digital channels. Since the outer conductor is grounded and provides an effective shield that improves with increasing frequencies, the cross-talk between adjacent coaxial cables decreases with frequency, rather than increasing as is the case with unshielded cable pairs.
In the telephone network, coaxial cable was used primarily on intercity routes for the long-haul network where heavy traffic existed. More recently, coaxial cables were being used for Local Area Networks within or between buildings. Such networks interconnect a large number of workstations and computers using baseband transmission.
Coaxial cables are also used extensively in community antenna television (CATV) or cable TV systems for distribution of television and music programs. However, coaxial cables for voice and data are being rapidly replaced by other media. Specifically, modern local area networks tend to use twisted pairs for intrabuilding cabling and optical fibers for interbuilding cabling. Similarly, coaxial cables carrying voice signals have or are being replaced by optical fibers, since the latter are much more cost effective because of their high bandwidth capability.
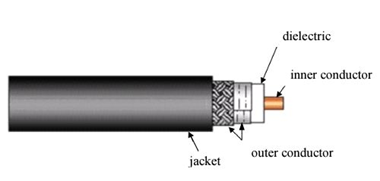
Figure: Typical Coaxial cable
Twisted Pair
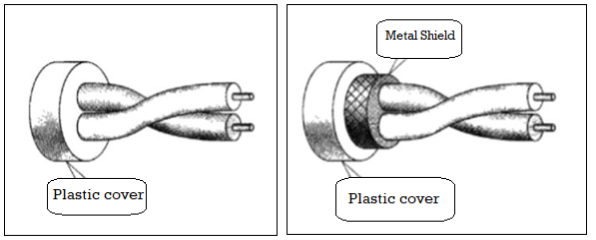
A twisted pair basically consists of the two conductors (normally copper), each with its own plastic insulation, twisted together. One of these wires is further used to carry signals to the receiver, and the other is used only as a ground reference. The receiver uses the difference between the two. Twisted pair cable is a type of wire in which the two conductors of a single circuit are twisted together for the purpose of cancelling out the electromagnetic interference from the external sources.
Types Of Twisted-Pair Cables:
The two commonly used types of twisted pair cables are as follows:
1. Unshielded twisted pair (UTP)
2. Shielded twisted pair (STP)
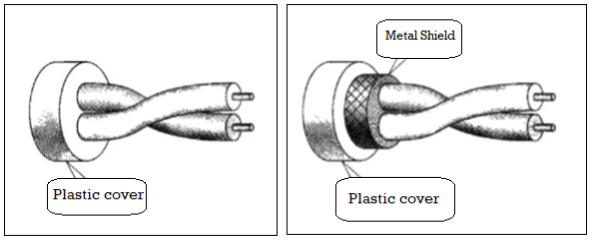
Shielded twisted Pair (STP)
STP cable has a metal foil or braided mesh covering that mainly encases each pair of insulated conductors. Although metal casing improves the quality of the cable by preventing the penetration of noise or the crosstalk , it is bulkier and more expensive.
This is known as the metal shield which is normally connected to ground so as to reduce the interference of the noise. But this makes the cable bulky and expensive. So practically UTP is more used than STP. The STP was developed by IBM and is used primarily for the IBM company only.
Twisted pairs can also be used for either analog or digital transmission. The bandwidth supported by the wire depends on the thickness of the wire and the distance to be travelled by a signal on it.
Twisted pairs support several megabits/sec for a few kilometers and are less costly.
Unshielded Twisted Pair (UTP)
A twisted pair consists of two insulated conductors twisted together in the shape of a spiral as shown in the figure. It can be shielded or unshielded. The unshielded twisted pair cables are generally very cheap and easy to install. But they are badly affected by electromagnetic noise interference.
In a balanced pair operation, the two wires carry equal and opposite signals and the destination detects the differences between the two. This is known as differential mode transmission. Twisting of wires will reduce the effect of noise or external interference. The induced emf into the two wires due to the interference tends to cancel each other due to twisting. The number of twists per unit length will then determine the quality of cable. More twists thus mean better quality.
Characteristics Of Unshielded Twisted Pair (UTP)
1. These cables ensure less crosstalk and a higher quality of signal over longer distances. Therefore these cables are popularly used for high-speed computer communication.
2. The wires are not shielded and can support a data rate of several Mbps.
3. Used in applications like analog and digital telephony i.e. LAN etc.
4. Noise and electromagnetic interference are high.
Microwave Waveguides:
Generally, if the frequency of a signal or a particular band of signals is high, the bandwidth utilization is high as the signal provides more space for other signals to get accumulated. However, high frequency signals can't travel longer distances without getting attenuated. We have studied that transmission lines help the signals to travel longer distances.
Microwaves propagate through microwave circuits, components and devices, which act as a part of Microwave transmission lines, broadly called as Waveguides.
A hollow metallic tube of uniform cross-section for transmitting electromagnetic waves by successive reflections from the inner walls of the tube is called as a Waveguide.
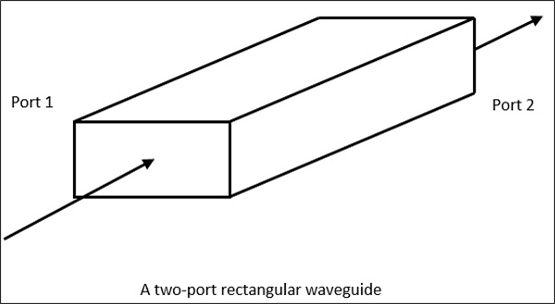
The following figure shows an example of a waveguide.
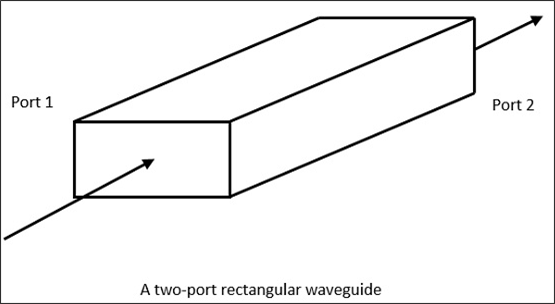
A waveguide is generally preferred in microwave communications. Waveguide is a special form of transmission line, which is a hollow metal tube. Unlike a transmission line, a waveguide has no center conductor.
The main characteristics of a Waveguide are –
- The tube wall provides distributed inductance.
- The empty space between the tube walls provides distributed capacitance.
- These are bulky and expensive.
Advantages of Waveguides:
Following are few advantages of Waveguides:
- Waveguides are easy to manufacture.
- They can handle power in KW.
- Power loss is very negligible in waveguides.
- They offer very low loss, low value of alpha−attenuation.
- When microwave energy travels through waveguide, it experiences lower losses than a coaxial cable.
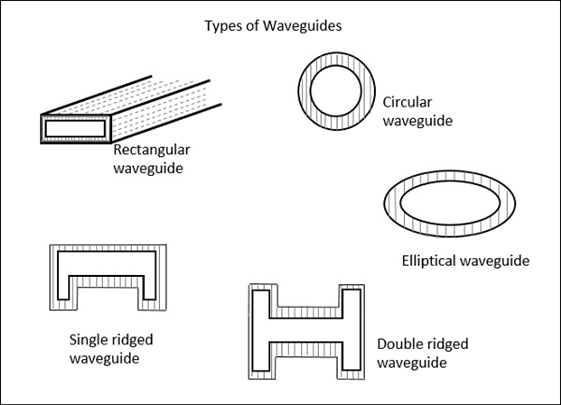
Types of Waveguides:
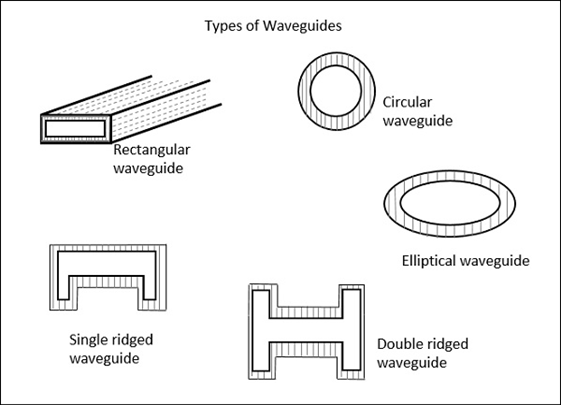
There are five types of waveguides -
- Rectangular waveguide
- Circular waveguide
- Elliptical waveguide
- Single-ridged waveguide
- Double-ridged waveguide
Summary:
A transmission line is commonly described by its distributed parameters R in {Ω/m), L (in H/m), G (in S/m), and C (in F/m).
When an alternating current pass through a conductor it does not flow uniformly all over the conductor. The concentration of current is higher on the surface of the conductor than at the centre, thus increasing the effective resistance this is called as the Skin effect.
The characteristic impedance  (analogous to the intrinsic impedance of plane waves in a medium) of a line is given

And the propagation constant (per meter) is given by

The wavelength and wave velocity are

The general case is that of the lossy transmission line (G  0
0  R) . For a lossless line, R = 0 = G; for a distortion less line, R/L = G/C. It is desirable that power lines be lossless and telephone lines be distortion less.
Reflection coefficient for voltage 
At any point on the line, the ratio of the phasor voltage to phasor current is the impedance at that point looking toward the load and would be the input impedance to the line fi the line was that long. For a lossy line,

Where  is the distance from load to the point. For a lossless line
  tanh
tanh  for a shorted line,
  for an open-circuited line,
  and for a matched line
  .
.
The Smith chart is a graphical means of obtaining line characteristics such as  , s, and Zin· It is constructed within a circle of unit radius and based on the formula for
  . For each rand x, there are two explicit circles (the resistance and reactance circles) and one implicit circle (the constants-circle). The Smith chart is conveniently used in determining the location of a stub tuner and its length. It is also used with the slotted line to determine the value of the unknown load impedance.
A coaxial cable is essentially a pair of conductors with a dielectric material separating them. Coaxial cables have various characteristic impedances, with 50, 75, and 93 ohms being the most common. Coaxial cables are also used extensively in community antenna television (CATV) or cable TV systems for distribution of television and music programs.
A twisted pair basically consists of the two conductors (normally copper), each with its own plastic insulation, twisted together. One of these wires is further used to carry signals to the receiver, and the other is used only as a ground reference.
A hollow metallic tube of uniform cross-section for transmitting electromagnetic waves by successive reflections from the inner walls of the tube is called as a Waveguide. There are five types of waveguides- Rectangular, Circular, Elliptical, Single-ridged, Double-ridged waveguide.
References:
1. Kraus and Fleish, “Electromagnetics with Applications”, McGraw Hill International Editions, 5th Edition.
2. Jordan and Balmain, “Electromagnetic Waves and Radiating Systems”, PHI, 1964.
3. Faraday, Maxwell, and the Electromagnetic Field:by Basil Mahon and Nancy Forbes.
4. Electromagnetism: Theory and Applications Book by Ashutosh Pramanik
5. Field and wave electromagnetics Textbook by David K. Cheng
6.https://www.tutorialspoint.com/microwave_engineering/microwave_engineering_waveguides.htm
Unit - 6
Transmission Line Theory
A transmission line is a means of transfer of information from one point to another. Usually, it consists of two conductors. It is used to connect a source to a load. The source may be a transmitter and the load may be a receiver.
The performance of transmission line depends on the parameters of the line. The transmission line has mainly four parameters, resistance, inductance, capacitance and shunt conductance. These parameters are uniformly distributed along the line. Hence, it is also called the distributed parameter of the transmission line.
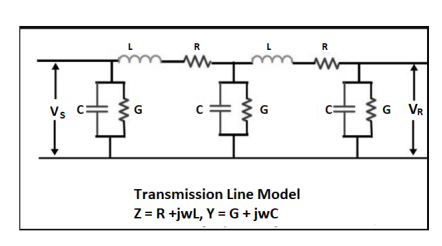
Figure. Transmission Line
The inductance and resistance form series impedance whereas the capacitance and conductance form the shunt admittance.
Line inductance – The current flow in the transmission line induces the magnetic flux. When the current in the transmission line changes, the magnetic flux also varies due to which emf induces in the circuit. The magnitude of inducing emf depends on the rate of change of flux. Emf produces in the transmission line resist the flow of current in the conductor, and this parameter is known as the inductance of the line.
Line capacitance – In the transmission lines, air acts as a dielectric medium. This dielectric medium constitutes the capacitor between the conductors, which store the electrical energy, or increase the capacitance of the line. The capacitance of the conductor is defined as the present of charge per unit of potential difference.
Capacitance is negligible in short transmission lines whereas in long transmission; it is the most important parameter. It affects the efficiency, voltage regulation, power factor and stability of the system.
Shunt conductance – Air act as a dielectric medium between the conductors. When the alternating voltage applies in a conductor, some current flow in the dielectric medium because of dielectric imperfections. Such current is called leakage current. Leakage current depends on the atmospheric condition and pollution like moisture and surface deposits.
Shunt conductance is defined as the flow of leakage current between the conductors. It is distributed uniformly along the whole length of the line. The symbol Y represented it, and it is measured in Siemens.
When an alternating current pass through a conductor it does not flow uniformly all over the conductor. The concentration of current is higher on the surface of the conductor than at the centre, thus increasing the effective resistance. This effect is called the skin effect which is prominent at the higher frequency. The skin effect increases with the increase of cross section and permeability of conductor and reduced in stranded conductors.
The solid conductor considered can be thought of having a number of strands one over the other, each carrying some portion of the current, so the inductance of each stand will be vary and will increase towards the center. The high reactance of the strands near the center will increase the tendency of the current to flow with greater density near the outer stands. This result in a more power loss for a given r.m.s value of current, or the effective resistance is increased, also skin effect decreases the effective internal reactance. According to Maxwell and Rayleigh, the ratios of skin-effect resistance to direct current resistance and the skin-effect reactance to direct current reactance are given as:


Where 
Hence the skin effect resistance and reactance depend upon frequency. For high-frequency currents, the skin effect predominates. The above formulae are not much used practically. For practical purpose the value of m is given as.

The empirical formula for Rs are:
And  for m above 3.
The Skin effect depends upon the following factors:
- Nature of material.
- It is directly proportional to diameter of conductor.
- It is proportional to frequency of supply. Skin effect increases with the increase in frequency.
- It Depends on the shape of the conductor. Skin effect less for standard conductor than the solid conductor.
The general solution of a transmission line includes the expressions for current and voltage at any point along the line of any length having uniformly distributed constants.
The various notations used in this derivation are,
 Series resistance ohms per unit length, including both the wires
L = series inductance, henry per unit length
C= Capacitance between the conductors, farads per unit length
G= Shunt leakage conductance between the conductors, mhos per unit length
L= Series reactance per unit length
Z=R+jL=Series impedance in ohms per unit length
Y=G+jC=Shunt admittance in mhos per unit length
 Distance upto point of consideration, measured from receiving end
I=current in the line at any point
E=Voltage between the conductors at any point
I=Length of the line
The transmission line of length l can be considered to be made up of infinitesimal T sections. One such section of length ds is shown in figure. It carries current I.

The point under consideration is at a distance s from the receiving end. The length of section is ds hence its series impedance is Zds and shunt admittance is Yds. The current is I and voltage E.
The elemental voltage drop in the length ds is


The leakage current flowing through shunt admittance from one conductor to other is given by


Differentiating equation (1) and (2) with respect to s we get


This is because both E and I are functions of s.


The equations (3) and (4) are the second order differential equations describing the transmission line having distributed constants all along its length. It is necessary to solve these equations to obtain expressions of E and I.
Replace the operator d/ds by m we get
 but E
but E

So there exists two solutions for positive sign of m and negative side ofm. The general solution for E and I are


Where A, B, C and D are arbitrary constants of integration.
To obtain A, B, C, D
As distance is measured from the receiving end, s=0 indicates the receiving end.
 and
and 
Substituting in the solution
 8(a)
8(a)
 8(b)
8(b)
Same condition can be used in the equations obtained by differentiating the equations (6) and (7) with respect to s.


 and
and 

And 


Now use s=0, E= and
and 


The equation 8a, 8b, 13a and 13b are to be solved simultaneously to obtain the values of the constants A, B, C and D.
Now while solving these equations use the results,
 and
and 
Hence the various constants obtained, after solving the equations simultaneously are,
 (14)
(14)
 (15)
(15)
 (16)
(16)
 (17)
(17)
Hence the general solution of the differential equations is
 (18)
(18)
 (19)
(19)
Taking LCM as  and taking
  out from equation (18)
 (20)
(20)
Taking LCM as  and taking
  out from equation (18)
 (21)
(21)
The negativ sign is used to convert  to
to 
The equations (20) and (21) is the general solution of a transmission line.
Another way of representing the equation is,


 hence
hence 


But  and
and 

 cosh
cosh 
The equation (24) and (25) give the values of E and I at any point along the length of the line.
If x is the distance measured down the line from the sending end
And the equations (24) and (25) get transferred interms of  ,
,


And  as derived earlier and hence equations can be written interms of propagation constant y.
Summarizing,
If receiving end parameters are kknown and s is distance measured from the receiving end then,


From the equations, the sending end current can be obtained by substituting s=l measured from the end.


 (1)
(1)
Now if the line is terminated in its characteristic impedance  then
then
 as
as 

This is the equation which is already derived for the line terminated in  using
using
This is the equation which is already derived for the line terminated in  . Using
 in equation (1)

 (1)
(1)
Dividing (2) by (1)


When the line is terminated in  then
then  . So, substituting in equation (6) we get

This shows that for a line terminated in its characteristic impedance its input impedance is also its characteristic impedance.
Now consider an infinite line with  . Using this in equation (6) we get,

And tanh (l) as
as 

This shows that finite line terminated in its characteristic impedance behaves as an infinite line, to the sending end generator.
Thus the equation for  and
and  are applicable for the finite line terminated in
  The equations are reproduced here for the convenience of the reader


Where
 Wavelength
 Velocity of propagation
f=frequency of signal
Velocity of propagation is a measure of how fast a signal travel over time, or the speed of the transmitted signal as compared to the speed of light.
In computer technology, the velocity of propagation of an electrical or electromagnetic signal is the speed of transmission through a physical medium such as a coaxial cable or optical fiber.
A theoretical loss less coaxial cable working at high frequencies has a velocity of propagation that can be calculated as
Vp = 1/  ------------------(1)
Where vp is the velocity of propagation in m/s
C is the distributed capacitance per unit length in pF
L is the distributed inductance per unit length in µH
The phase velocity vp (propagation velocity) of a wave in a transmission line is:
Vp = ω / β ------------------(1)
Where
β = Im {γ} = Im {  (G + jwC)}
Thus, for a lossy line, the phase velocity vp is a function of frequency ω which means vp(w) is bad. In other words, the signal energy is spread across many frequencies.
If different frequencies that comprise a signal travel at different velocities that signal will arrive at the end of a transmission line as distorted. This phenomenon is called signal dispersion.
For lossless line the phase velocity is independent of frequency which means no dispersion will occur.
Vp = 1/  [R=0, G=0].
It is not possible to obtain perfect lossless line but the phase velocity is approximate constant if the line is low-loss.
Heaviside found that transmission line is distortion less if the line parameters exhibit the following ratio:

The complex propagation constant γ is expressed as
γ = 
=  LC(R/L = jw) (G/C + jw)
If R/L = G/C we find that
 LC(R/L +jw) (R/L + jw) = (R/L +jw)
  LC
LC
= R  + jw
+ jw
Thus α = Re{γ} = R 
β = Im {γ} = w 
The propagation velocity of the wave is :
Vp = w / β = 1/ 
The propagation velocity is independent of frequency.
Consider a pair of conductors with infinite length, as shown in Figure Zo-1(a). If we instantaneously put a voltage source across the pair, certain current flows to create a voltage wave that travels along the pair.
The ratio of voltage to current, Vout /Iout, depends on the physical characteristics of the conductors and is called the characteristic impedance Z0 of the conductor pair.
The magnitude of Vout is determined by viewing the series combination of Rsrc and Z0 as a voltage divider, so that
Vout = Vsrc Z0 / Rsrc + Z0
The situation is different for a transmission line of finite length that is not terminated in its characteristic impedance. The far end is short-circuited, as shown in Figure Zo-2(a). Assume that Rsrc = Z0 in this example. Initially, all the driver sees is the line’s characteristic impedance, and a voltage wave with amplitude Vsrc/2 propagates down the line.
However, when the wave hits the far end at time T, it sees the short circuit. In order to satisfy Kirchhoff’s laws, a voltage wave of the opposite polarity propagates back down the line, cancelling the original wave. The far end has reflected the original wave, and the driver sees the short-circuit at time 2T.
The case, in which the far end is open-circuited, is shown in (b). Everything starts out as before. However, when the initial voltage wave hits the far end, the current has nowhere to go, and so a voltage wave of the same polarity propagates back up the line, adding to the original voltage. When the reflected wave reaches the driver at time 2T, the voltage everywhere is Vsrc, and nothing more happens.
In the general case, the amplitude of the wave reflected at the end of a transmission line is determined by the reflection coefficient, ρ (rho). The value of ρ depends on Z0 and Zterm or ZL, the termination impedance at the end of the line:
The voltage reflection coefficient at any point on the line is the ratio of the reflected voltage wave to that of the incident wave.


The current reflection coefficient at any point on the line is the negative of the voltage reflection coefficient at that point.
Zterm = Z0 When a transmission line is terminated in its characteristic impedance, the reflection coefficient is 0.
Zterm = 0 The reflection coefficient of a short-circuited line is −1, producing a reflection of equal magnitude and opposite polarity.
Zterm = ∞ The reflection coefficient of an open-circuited line is +1, producing a reflection of equal magnitude and the same polarity.
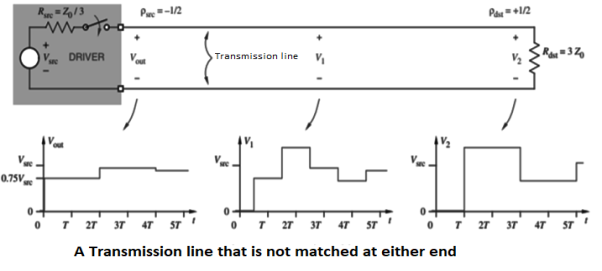
Figure shows the behaviour of a transmission line that is not matched at either end. (Note that the driver’s ideal voltage source Vsrc is considered to have a resistance of 0 Ω for this analysis.) Reflections occur at both ends of the line, with smaller and smaller waves reflecting back and forth.
The voltage everywhere on the line asymptotically approaches 0.9Vsrc, the value that would be predicted by a “DC” analysis of the circuit using Ohm’s law.
Reflection Loss: It is defined as the number of nepers or decibels by which the current in the load under image matched conditions would exceed the current actually flowing in the load.
Reflection loss, nepers
Reflection loss, db
Reflection Factor: The term K denotes the reflection factor. This ratio indicates the change in current in the load due to reflection at the mismatched junction and is called the reflection factor.

Standing waves represent power that is not accepted by the load and reflected along the transmission line or feeder.
In order to obtain the maximum power transfer from the source to the transmission line, or the transmission line to the load, be it a resistor, an input to another system, or an antenna, the impedance levels must match.
Issues arise when power is transferred into the transmission line or feeder and it travels towards the load. If there is a mismatch, i.e. the load impedance does not match that of the transmission line, then it is not possible for all the power to be transferred.
As power cannot disappear, the power that is not transferred into the load has to travel somewhere and there it travels back along the transmission line back towards the source.
When this happens the voltages and currents of the forward and reflected waves in the feeder add or subtract at different points along the feeder according to the phases. In this way standing waves are set up.
If one end is fixed a standing wave motion is set up, and points of minimum and maximum vibration can be seen.
The values of current and voltage along the feeder vary along the feeder. For small values of reflected power, the waveform is almost sinusoidal, but for larger values it becomes more like a full wave rectified sine wave. This waveform consists of voltage and current from the forward power plus voltage and current from the reflected power.
At a distance a quarter of a wavelength from the load the combined voltages reach a maximum value whilst the current is at a minimum. At a distance half a wavelength from the load the voltage and current are the same as at the load.
A similar situation occurs when the load resistance is greater than the feeder impedance however this time the total voltage at the load is higher than the value of the perfectly matched line. The voltage reaches a minimum at a distance a quarter of a wavelength from the load and the current is at a maximum. However at a distance of a half wavelength from the load the voltage and current are the same as at the load.
Then when there is an open circuit placed at the end of the line, the standing wave pattern for the feeder is similar to that of the short circuit, but with the voltage and current patterns reversed.
SWR stands for standing wave ratio. It describes the voltage and current standing waves that appear on the line. It is a generic description for both current and voltage standing waves. It is often used in association with meters used to detect the standing wave ratio. Both current and voltage rise and fall by the same proportion for a given mismatch.
Consider the following circuit:
In low frequency circuit theory, the input impedance would simply be ZA. However, for high-frequency (or long) transmission lines, we know that the voltage and the current are given by:


Assume the transmission line is lossless, so that the propagation constant is purely imaginary. If we define z=0 to be at the terminals of the load or antenna, then we are interested in the ratio of the voltage to the current at location z=-L:


The above equation can be manipulated algebraically, and when evaluated at z=-L, we obtain:

This last equation is fundamental to understanding transmission lines. The input impedance of a load ZA is transformed by a transmission line as in the above equation. This equation can cause ZA to be transformed radically.
The Smith Chart is a tool for visualizing the impedance of a transmission line and antenna system as a function of frequency. Smith Charts can be used to increase understanding of transmission lines and how they behave from an impedance viewpoint.
Smith Charts are also extremely helpful for impedance matching. The Smith Chart is used to display a real antenna's impedance when measured on a Vector Network Analyzer (VNA).
Basic smith chart
The Smith Chart displays the complex reflection coefficient, in polar form, for an arbitrary impedance
The complex reflection coefficient () for an impedance ZL attached to a transmission line with characteristic impedance Z0 is given by

Let us assume Z0 is 50 Ohms, which is often. The complex reflection coefficient, or, must have a magnitude between 0 and 1.
As such, the set of all possible values for must lie within the unit circle:
In Figure, plotting the set of all values for the complex reflection coefficient, along the real and imaginary axis. The center of the Smith Chart is the point where the reflection coefficient is zero. That is, this is the only point on the smith chart where no power is reflected by the load impedance.
The outer ring of the Smith Chart is where the magnitude of is equal to 1. This is the black circle in Figure 1. Along this curve, all of the power is reflected by the load impedance.
Normalized Load Impedance
To make the Smith Chart more general and independent of the characteristic impedance Z0 of the transmission line, we will normalize the load impedance ZL by Z0 for all future plots:
 ………….[1]
Equation [1] doesn't affect the reflection coefficient tow. It is just a convention that is used everywhere.
Constant Resistance Circles
For a given normalized load impedance zL, we can determine and plot it on the Smith Chart. Now, suppose we have the normalized load impedance given by:

In equation [2], Y is any real number. What would the curve corresponding to equation [2] look like if we plotted it on the Smith Chart for all values of Y? That is, if we plotted z1 = 1 + 0*i, and z1 = 1 + 10*i, z1 = 1 - 5*i, z1 = 1 - .333*i, .... And any possible value for Y that you could think of, what is the resulting curve? The answer is shown in Figure below:
In this Figure, the outer blue ring represents the boundary of the smith chart. The black curve is a constant resistance circle: this is where all values of z1 = 1 + i*Y will lie on. Several points are plotted along this curve, z1 = 1, z1 = 1 + i*2, and zL = 1 - i*4. Suppose we want to know what the curve z2 = 0.3 + i*Y looks like on the Smith Chart. The result is shown in Figure below:
In this Figure, the black ring represents the set of all impedances where the real part of z2 equals 0.3. A few points along the circle are plotted. We've left the resistance circle of 1.0 in red on the Smith Chart. These circles are called constant resistance curves. The real part of the load impedance is constant along each of these curves. Now add several values for the constant resistance, as shown in Figure below:
In above Figure, the zL=0.1 resistance circle has been added in purple. The zL=6 resistance circle has been added in green, and zL=2 resistance circle is in black. Look at the set of curves defined by zL = R + iY, where Y is held constant and R varies from 0 to infinity. Since R cannot be negative for antennas or passive devices, we will restrict R to be greater than or equal to zero. As a first example, let zL = R + i. The curve defined by this set of impedances is shown in Figure below:
The resulting curve zL = R + i is plotted in green in Figure above. A few points along the curve are illustrated as well. Observe that zL = 0.3 + i is at the intersection of the Re[zL] = 0.3 circle and the Im[zL]=1 curve. Similarly, observe that the zL = 2 + i point is at the intersection of the Re[zL]=2 circle and the Im[zL]=1 curve. (For a quick reminder of real and imaginary parts of complex numbers, see complex math primer.) The constant reactance curve, defined by Im[zL]=-1 is shown in Figure below:
The resulting curve for Im[zL]=-1 is plotted in green in Figure above. The point zL=1-i is placed on the Smith Chart, which is at the intersection of the Re[zL]=1 circle and the Im[zL]=-1 curve.
An important curve is given by Im[zL]=0. That is, the set of all impedances given by zL = R, where the imaginary part is zero and the real part (the resistance) is greater than or equal to zero. The result is shown in Figure below:
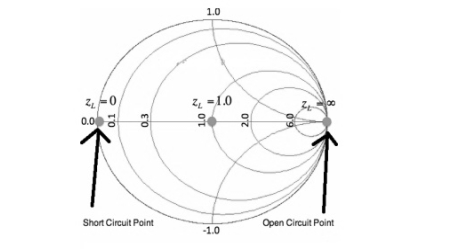
Figure. Constant Reactance Curve for zL=R. The reactance curve given by Im[zL]=0 is a straight line across the Smith Chart.
There are 3 special points along this curve.
On the far left, where zL = 0 + i0, this is the point where the load is a short circuit, and thus the magnitude of is 1, so all power is reflected. In the center of the Smith Chart, we have the point given by zL = 1. At this location, is 0, so the load is exactly matched to the transmission line. No power is reflected at this point.
The point on the far right in Figure aboce is given by zL = infinity. This is the open circuit location. Again, the magnitude of is 1, so all power is reflected at this point, as expected. Finally, we'll add a bunch of constant reactance curves on the Smith Chart, as shown in Figure below.
In Figure, we added constant reactance curves for Im[zL]=2, Im[zL]=5, Im[zL]=0.2, Im[zL]=0.5, Im[zL]=-2, Im[zL]=-5, Im[zL]=-0.2, and Im[zL] = -0.5. Figure above shows the fundamental curves of the Smith Chart.
PROBLEMS:
(i). The 0.1λ length line shown has a characteristic impedance of 50 and is terminated with a load impedance of ZL = 5+j25.
(a) Locate zL = ZL/Z0 = 0.1 + j0.5 on the Smith chart.
(b)What is the impedance at l = 0:1λ?
Since we want to move away from the load (i.e., toward the generator), read 0.074 λ on the wavelengths toward generator scale and add l = 0.1 λ to obtain 0.174 λ on the wavelengths toward generator scale.
A radial line from the center of the chart intersects the constant reflection Co-efficient magnitude circle at z = 0.38 + j1.88. Hence Z = zZ0 = 50(0.38 + j1.88) = 19 + 94Ω.
(c) What is the VSWR on the line?
Find VSWR = Zmax = 13 on the horizontal line to the right of the chart's center. Or use the SWR scale on the chart.
(d) What is ΓL?
From the reflection coefficient scale below the chart,
Find |ΓL| = 0.855. From the angle of reflection coefficient scale on the perimeter of the chart, Find the angle of ΓL=126.5₀. HenceΓL=0.855e j126.5₀.
(e) What is Γ at l = 0.1λ from the load?
Note that |Γ| =|ΓL|=0.855. Read the angle of the reflection coefficient from the angle of reflection coefficient scale as 55.0₀. Hence ΓL=0.855e j126.5₀.
(ii). A transmission line has Z0 = 1.0, ZL = zL = 0.2- j0.2Ω.
(a) What is z at l =λ/4=0.25 λ?
From the chart, read 0:467λfrom the wavelengths to-ward generator scale. Add 0.25λ to obtain 0.717 λ on the wavelengths toward generator scale. This is not on the chart, but since it repeats every half wavelength, it is the same as 0.717 λ– 0.500 λ = 0.217 λ. Drawing a radial line from the center of the chart, we find an intersection with the constant reflection coefficient magnitude circle at z = Z = 2.5 + j2.5.
(b) What is the VSWR on the line?
From the intersection of the constant reflection coefficient circle with the right hand side of the horizontal axis, read VSWR= zmax = 5.3.
(c) How far from the load is the first voltage minimum?
The voltage minimum occurs at zmin which is at a distance of 0.500λ-0.467λ = 0:033λ from the load. Or read this distance directly on the wavelengths toward load scale. The current minimum occurs at zmax which is a quarter of a wavelength farther down the line or at 0.033λ+0.25λ = 0.283λ from the load.
(iii) A slotted line measurement yields the following parameter values:
(a) Voltage minima at 9.2 cm and 12.4 cm measured away from the load with the line terminated in a short.
(b) VSWR = 5.1 with the line terminated in the unknown load; a voltage minimum is located 11.6 cm measured away from the load.
What is the normalized line impedance?
Note that this data could have come from either a waveguide or a TEM line measurement. If the transmission system is a waveguide, then the wavelength used is actually the guide wavelength. From the voltage minima on the shorted line, the (guide) wavelength may be determined:
λg/2=12.4cm-9.2 cm=3.2 cm or λg=6.4 λg
Hence the shift in the voltage minimum when the load is replaced by a short is
12.4cm-11.6cm/6.4cm/ λg=0.125 λg
Toward the generator. Locate the reflection coefficient magnitude circle by its intersection with zmax = VSWR = 5:1 on the horizontal axis. Then from the voltage minimum opposite zmax, move 0.125 λg toward the generator to find a position an integral number of half-wavelengths from the load. The impedance there is the same as that of the load, zL = 0.38 +j0.93. Alternatively, move 0.5 λg– 0.125 λg = 0.375 λg toward the load to locate the same value.
General solution, physical significance of the equations, wavelength, velocity of propagation, the distortion less line, Reflection on a line not terminated in Z0, reflection coefficient, open and short circuited lines, reflection factor and reflection loss, standing waves; nodes; standing wave ratio, Input impedance of dissipation less line, Input impedance of open- and short-circuited lines, Power and impedance measurement on lines, Reflection losses on the unmatched Load, Problems solving using Smith chart.
- Short-Circuit Lines:
Consider a transmission line of length L, but suppose the end of line is short-circuited together so that ZA =0. Then the impedance equation is:

We can determine input impedance for short circuit line:(input admittance 1/Z)
 (short-circuited Line)
 (short-circuited admittance)
Example:
Suppose an antenna has an impedance ZA = 50 – j * 10. Using short-circuit transmission line with Z0 = 50 and u=c in parallel with antenna. Transform the input impedance to be entire real.
The admittance of the load is:
YA = 1/ZA = 1/ (50 – j * 10) = YA = 0.0192 + j * 0.0038
If reactance is added in parallel with a value of YA = - j * 0.0038 the admittance will be entirely real so the impedance will real.
Smith Chart applications in solving the transmission line parameters
In any domain of RF engineering, the Smith chart has various applications. Few of the foremost applications of the smith chart are
- It is used in the transmission line is used to calculate impedance provided at any load
- The chart is even employed to calculate admittance values provided at any load.
- Used in the measurement of the length of the short-circuited section of the Transmission line in order to offer the required amount of inductive reactance of capacitance.
- Used for the purposes of impedance matching.
- Employed to know the value of VSWR amongst others.
Let us consider an example of how to use a smith chart for impedance matching in the case of transmission lines and antennas.
Here the application of the chart is to find out the components (capacitor or inductor) value which makes sure that the lines are properly matched thus states that the reflection coefficient is ‘0’.
For instance, when the impedance value is considered as Z = 0.5 – 0.6j. Here, initially, we need to know the resistance circle that has a value 0.5 on the chart. As the impedance value is negative, which implies that we mean a capacitive impedance, we need to move it in the anti-clockwise direction across the 0.5 valued resistance circle to know the point where it touches the negative 0.6 reactance arc. This provides a thought of the component’s value that helps in matching the line to the load.
Standardized scaling let the smith chart to be implemented in the applications, which have any distinctive, or system impedance that represents the chart’s focal point. In the case of impedance charts, the generally used value of normalization impedance is 50 ohms where is used for simply tracing the impedance.
When the result is found through this, we can directly transform in between normalized impedance and the relevant unnormalized value by multiplying with the admittance value. With this reflection, coefficients are easily known. Additionally, these are also employed to solve the complication those arise with a change in frequency values for impedance and admittances.
It is easy to solve the problems which have one frequency value at a time, whereas in the case of bandwidth applications, it seems to be complicated which works with multiple frequencies. This is solved by smith chart and the outcome is shown as Locus with all the frequency ranges are close to each other. These locus points corresponds that
- How the inductive or capacitive load varies through the determined frequency range
- How complicated matching is probable to be at multiple frequency levels
- How properly a component is matched.
Coaxial Cable
A coaxial cable is essentially a pair of conductors with a dielectric material separating them. These two conductors provide a path for the current from the pulse signal to travel. As seen in Figure, there is an outer conductor and an inner conductor. The reflected wave will appear when the impedance of the cable changes. An impedance change is caused by discontinuity in the signal carrier. This discontinuity is caused by some type of change or interruption in the path of the current, which is brought about either by a geometric change or by a change in topology of one of the conductors or by change of dielectric.
Coaxial cables have various characteristic impedances, with 50, 75, and 93 ohms being the most common. They have the advantage of operating at very high frequencies, which allows them to carry a very large number of analog or digital channels. Since the outer conductor is grounded and provides an effective shield that improves with increasing frequencies, the cross-talk between adjacent coaxial cables decreases with frequency, rather than increasing as is the case with unshielded cable pairs.
In the telephone network, coaxial cable was used primarily on intercity routes for the long-haul network where heavy traffic existed. More recently, coaxial cables were being used for Local Area Networks within or between buildings. Such networks interconnect a large number of workstations and computers using baseband transmission.
Coaxial cables are also used extensively in community antenna television (CATV) or cable TV systems for distribution of television and music programs. However, coaxial cables for voice and data are being rapidly replaced by other media. Specifically, modern local area networks tend to use twisted pairs for intrabuilding cabling and optical fibers for interbuilding cabling. Similarly, coaxial cables carrying voice signals have or are being replaced by optical fibers, since the latter are much more cost effective because of their high bandwidth capability.
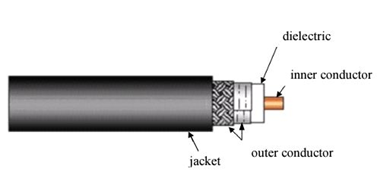
Figure: Typical Coaxial cable
Twisted Pair
A twisted pair basically consists of the two conductors (normally copper), each with its own plastic insulation, twisted together. One of these wires is further used to carry signals to the receiver, and the other is used only as a ground reference. The receiver uses the difference between the two. Twisted pair cable is a type of wire in which the two conductors of a single circuit are twisted together for the purpose of cancelling out the electromagnetic interference from the external sources.
Types Of Twisted-Pair Cables:
The two commonly used types of twisted pair cables are as follows:
1. Unshielded twisted pair (UTP)
2. Shielded twisted pair (STP)
Shielded twisted Pair (STP)
STP cable has a metal foil or braided mesh covering that mainly encases each pair of insulated conductors. Although metal casing improves the quality of the cable by preventing the penetration of noise or the crosstalk , it is bulkier and more expensive.
This is known as the metal shield which is normally connected to ground so as to reduce the interference of the noise. But this makes the cable bulky and expensive. So practically UTP is more used than STP. The STP was developed by IBM and is used primarily for the IBM company only.
Twisted pairs can also be used for either analog or digital transmission. The bandwidth supported by the wire depends on the thickness of the wire and the distance to be travelled by a signal on it.
Twisted pairs support several megabits/sec for a few kilometers and are less costly.
Unshielded Twisted Pair (UTP)
A twisted pair consists of two insulated conductors twisted together in the shape of a spiral as shown in the figure. It can be shielded or unshielded. The unshielded twisted pair cables are generally very cheap and easy to install. But they are badly affected by electromagnetic noise interference.
In a balanced pair operation, the two wires carry equal and opposite signals and the destination detects the differences between the two. This is known as differential mode transmission. Twisting of wires will reduce the effect of noise or external interference. The induced emf into the two wires due to the interference tends to cancel each other due to twisting. The number of twists per unit length will then determine the quality of cable. More twists thus mean better quality.
Characteristics Of Unshielded Twisted Pair (UTP)
1. These cables ensure less crosstalk and a higher quality of signal over longer distances. Therefore these cables are popularly used for high-speed computer communication.
2. The wires are not shielded and can support a data rate of several Mbps.
3. Used in applications like analog and digital telephony i.e. LAN etc.
4. Noise and electromagnetic interference are high.
Microwave Waveguides:
Generally, if the frequency of a signal or a particular band of signals is high, the bandwidth utilization is high as the signal provides more space for other signals to get accumulated. However, high frequency signals can't travel longer distances without getting attenuated. We have studied that transmission lines help the signals to travel longer distances.
Microwaves propagate through microwave circuits, components and devices, which act as a part of Microwave transmission lines, broadly called as Waveguides.
A hollow metallic tube of uniform cross-section for transmitting electromagnetic waves by successive reflections from the inner walls of the tube is called as a Waveguide.
The following figure shows an example of a waveguide.
A waveguide is generally preferred in microwave communications. Waveguide is a special form of transmission line, which is a hollow metal tube. Unlike a transmission line, a waveguide has no center conductor.
The main characteristics of a Waveguide are –
- The tube wall provides distributed inductance.
- The empty space between the tube walls provides distributed capacitance.
- These are bulky and expensive.
Advantages of Waveguides:
Following are few advantages of Waveguides:
- Waveguides are easy to manufacture.
- They can handle power in KW.
- Power loss is very negligible in waveguides.
- They offer very low loss, low value of alpha−attenuation.
- When microwave energy travels through waveguide, it experiences lower losses than a coaxial cable.
Types of Waveguides:
There are five types of waveguides -
- Rectangular waveguide
- Circular waveguide
- Elliptical waveguide
- Single-ridged waveguide
- Double-ridged waveguide
Summary:
A transmission line is commonly described by its distributed parameters R in {Ω/m), L (in H/m), G (in S/m), and C (in F/m).
When an alternating current pass through a conductor it does not flow uniformly all over the conductor. The concentration of current is higher on the surface of the conductor than at the centre, thus increasing the effective resistance this is called as the Skin effect.
The characteristic impedance  (analogous to the intrinsic impedance of plane waves in a medium) of a line is given

And the propagation constant (per meter) is given by

The wavelength and wave velocity are

The general case is that of the lossy transmission line (G  0
0  R) . For a lossless line, R = 0 = G; for a distortion less line, R/L = G/C. It is desirable that power lines be lossless and telephone lines be distortion less.
Reflection coefficient for voltage 
At any point on the line, the ratio of the phasor voltage to phasor current is the impedance at that point looking toward the load and would be the input impedance to the line fi the line was that long. For a lossy line,

Where  is the distance from load to the point. For a lossless line
  tanh
tanh  for a shorted line,
  for an open-circuited line,
  and for a matched line
  .
.
The Smith chart is a graphical means of obtaining line characteristics such as  , s, and Zin· It is constructed within a circle of unit radius and based on the formula for
  . For each rand x, there are two explicit circles (the resistance and reactance circles) and one implicit circle (the constants-circle). The Smith chart is conveniently used in determining the location of a stub tuner and its length. It is also used with the slotted line to determine the value of the unknown load impedance.
A coaxial cable is essentially a pair of conductors with a dielectric material separating them. Coaxial cables have various characteristic impedances, with 50, 75, and 93 ohms being the most common. Coaxial cables are also used extensively in community antenna television (CATV) or cable TV systems for distribution of television and music programs.
A twisted pair basically consists of the two conductors (normally copper), each with its own plastic insulation, twisted together. One of these wires is further used to carry signals to the receiver, and the other is used only as a ground reference.
A hollow metallic tube of uniform cross-section for transmitting electromagnetic waves by successive reflections from the inner walls of the tube is called as a Waveguide. There are five types of waveguides- Rectangular, Circular, Elliptical, Single-ridged, Double-ridged waveguide.
References:
1. Kraus and Fleish, “Electromagnetics with Applications”, McGraw Hill International Editions, 5th Edition.
2. Jordan and Balmain, “Electromagnetic Waves and Radiating Systems”, PHI, 1964.
3. Faraday, Maxwell, and the Electromagnetic Field:by Basil Mahon and Nancy Forbes.
4. Electromagnetism: Theory and Applications Book by Ashutosh Pramanik
5. Field and wave electromagnetics Textbook by David K. Cheng
6.https://www.tutorialspoint.com/microwave_engineering/microwave_engineering_waveguides.htm