Unit 6
Introduction to Noise
Sound
Sound is defined as the pressure variation (wave) that travels through air and is detected by the human ear. It is the propagating disturbance through physical or elastic medium. It is created by vibrating object or body.
Sound wave is a longitudinal wave which consists of compression and rarefaction.
The particles crowded together represents the area of compression in which the pressure is slightly greater than atmospheric pressure.
The spread area represents the rarefaction in which the pressure is slightly less than the atmospheric pressure.
Noise
It is the excessive or unwanted sound which potentially results in annoyance and/or hearing loss (can be from occupational and/or non-occupational sources).
Characteristics of Sound Wave:
The vibration of a source causes pressure changes in air which result in pressure waves. Perceived sound is comprised of numerous pressure waves of varying characteristics.
Pure Tone
It is a sinusoidal pressure wave of a specific frequency and amplitude, propagating at a velocity determined by the temperature and pressure of the medium.
Parameters of sound wave:
Amplitude of the sound wave is the maximum variation of the pressure above the atmospheric pressure.
It is the amount of sound pressure measured in decibels.
2. Frequency (f)
The rate of vibration per unit time measured in cycles per second is called as frequency of sound.
It is measured in Hertz or Hz.
3. Pitch
Pitch is the frequency of simple pure tone of a sound wave.
4. Time period (tp)
Time interval required for one complete cycle is the time period of the sinusoidal wave.
It is the inverse of the frequency.

5. Velocity of sound (c)
It is the velocity of wave propagation.

 = density of medium
 = ambient pressure
 = 1.4 for air
6. Wavelength
It is the distance between two successive peaks in the waveform

Need of decibel level
The range of audible sound pressure to which human ear is likely to be subjected is between 2 x 10⁻⁵ N/m2 to 200 N/m2. Because of wide range of sound pressure, it is convenient to describe the sound level through the use of logarithmic scales known as decibel scale. The use of this logarithmic scale helps in covering the entire sound level range by a small scale of numbers rather than the extremely large scale of numbers.
Decibel Scale
Decibel (dB) scale is a log-based scale developed to quantify sound. It compresses range to 0–140 dB
Scale starts at zero when sound pressure equals the threshold of human hearing
It is ten times the logarithm to the base 10 of the ratio of the quantity of sound measured to an arbitrarily chosen reference quantity.

Reference quantity is the threshold of human hearing.
The various parameters used for measurement of sound by using decibel scale are as follows:
Acoustic energy cannot be readily measured. Acoustic energy is proportional to the square of the sound pressure. Hence to measure the acoustic or sound energy, sound pressure level is most commonly used for measurement. It is measured directly on the sound pressure level.
The sound pressure level is expressed in decibel as,

Which is the same as


Where Prms is root mean square value of the sound pressure, and Pref is the reference which is equal to the threshold of human hearing (i.e., 0.00002 Pa or 20 uPa or 2 x 10⁻⁵ N/m2)
Sound power level describes the acoustical power radiated by a given source with respect to the international reference sound power of 10-12 W.
The sound power level is given by,

Sound Intensity
Sound Intensity at a given point in a sound field, in a given direction is defined as the average sound power passing through a unit area perpendicular to the given direction at that point.
The sound intensity is given by,

Where,
W = Sound Power
S = area perpendicular to sound wave.
Also,

Sound Intensity Level
It is given by,

 = 10-12 W/m2
The sound source is assumed to be a point source and its wave to be propagating from it in the form of spherical waves, as shown in fig.
The intensity of sound is given by,


It shows that the intensity of sound in a free space is inversely proportional to the square of the distance from the source of sound.
Now, we have,

We know,
Power = Intensity x surface area
Therefore,


Substituting the above values


Taking  = 1 m2


Where,

Sound intensity level is given by,

Also we know,

Substituting above value we get,


Taking,
 = 2 x 10⁻⁵ N/m2
 = 10-12 W/m2
 = 1.21 kg/m2
 = 344 m/s2

For all practical purpose, sound intensity level is taken numerically equal to sound pressure level.

Addition:
Let  ,
,  ,…,
,…,  be the sound pressure levels to be added.


And

Therefore


Total sound pressure level is given by,


Similarly, total sound power level is given by

Subtraction:
Let  and
and  be the sound pressure levels to be subtracted.


Resultant sound pressure level is given by,


Similarly, resultant sound power level for subtraction of two individual sound power levels is,

Averaging
Let  ,
,  ,…,
,…,  be the sound pressure levels measured at single locations at several times for which the average sound power level is to be determined.
Average sound pressure level is given by,

Similarly, average sound power level is given by,

White noise is defined as having the same amplitude at all frequencies (radio static, or a jet of compressed air are pretty good approximations). It is often used as a known input to a system, in order to determine the system’s frequency response.
White noise is a type of noise that is produced by combining sounds of all different frequencies together within the range of human hearing.
In general, if all the tones that a human can hear are taken together and combined, then it gives white noise.
The word ‘white’ comes from optics. White noise is analogous to white light. White light is the light that is made of all monochromatic lights of all colors. Similarly, white noise is the combination of all different frequencies of sound noise.
If one, two, three or few people are talking at the same time, then human brain can pick up one of the few voices and is able to understand it. But if many people, say 1000 people, are talking at the same time, then for a normal human brain it is difficult to pick one voice. Thus many people talking together sounds like a white noise.
White noise is defined as having the same amplitude at all frequencies (radio static, or a jet of compressed air are pretty good approximations). It is often used as a known input to a system, in order to determine the system’s frequency response.
The two main characteristics are:
1. The frequency response: that is, the deviation between the measured value and the true value as a function of the frequency. As the ear is capable of hearing sounds between 20 Hz and 20 kHz, the frequency response of the sound level meter should be good, with variations smaller than 1 dB, over that range.
2. The dynamic range: that is, the range in dB over which the measured value is proportional to the true value, at a given frequency (usually 1000 Hz). This range is limited at low levels by the electrical background noise of the instrument and at high levels by the signal distortion caused by overloading the microphone or amplifiers.
Various noise measuring instruments are
Microphone phone is a device which converts acoustical energy into electrical energy.
The microphone is the interface between the acoustic field and the measuring system. It responds to sound pressure and transforms it into an electric signal which can be interpreted by the measuring instrument (e.g. the sound level meter). The best instrument cannot give a result better than the output from the microphone. Therefore, its selection and use must be carefully carried out to avoid errors.
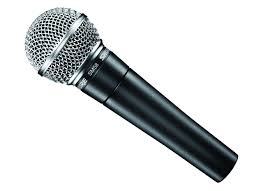
Microphone
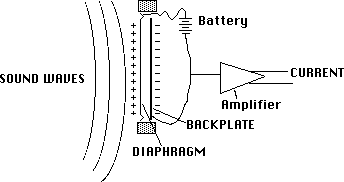
Internal Structure of microphone
The microphone can be of the following types: piezoelectric, condenser, electret or dynamic
In a piezoelectric microphone, the membrane is attached to a piezoelectric crystal which generates an electric current when submitted to mechanical tension. The vibrations in the air, resulting from the sound waves, are picked up by the microphone membrane and the resulting pressure on the piezoelectric crystal transforms the vibration into an electric signal.
In a condenser microphone, the microphone membrane is built parallel to a fixed plate and forms with it a condenser. A potential differential is applied between the two plates using a d.c. voltage supply (the polarization voltage). The movements, which the sound waves provoke in the membrane, give origin to variations in the electrical capacitance and therefore in a small electric current.
The last type is a dynamic microphone where the membrane is connected to a coil, centered in a magnetic field, and whose movements, triggered by the mechanical fluctuations of the membrane, give origin to a potential differential in the poles of the coil. The dynamic microphone is more mechanically resistant but its poor frequency response severely limits its use in the field of acoustics.
2. Sound Level Meter
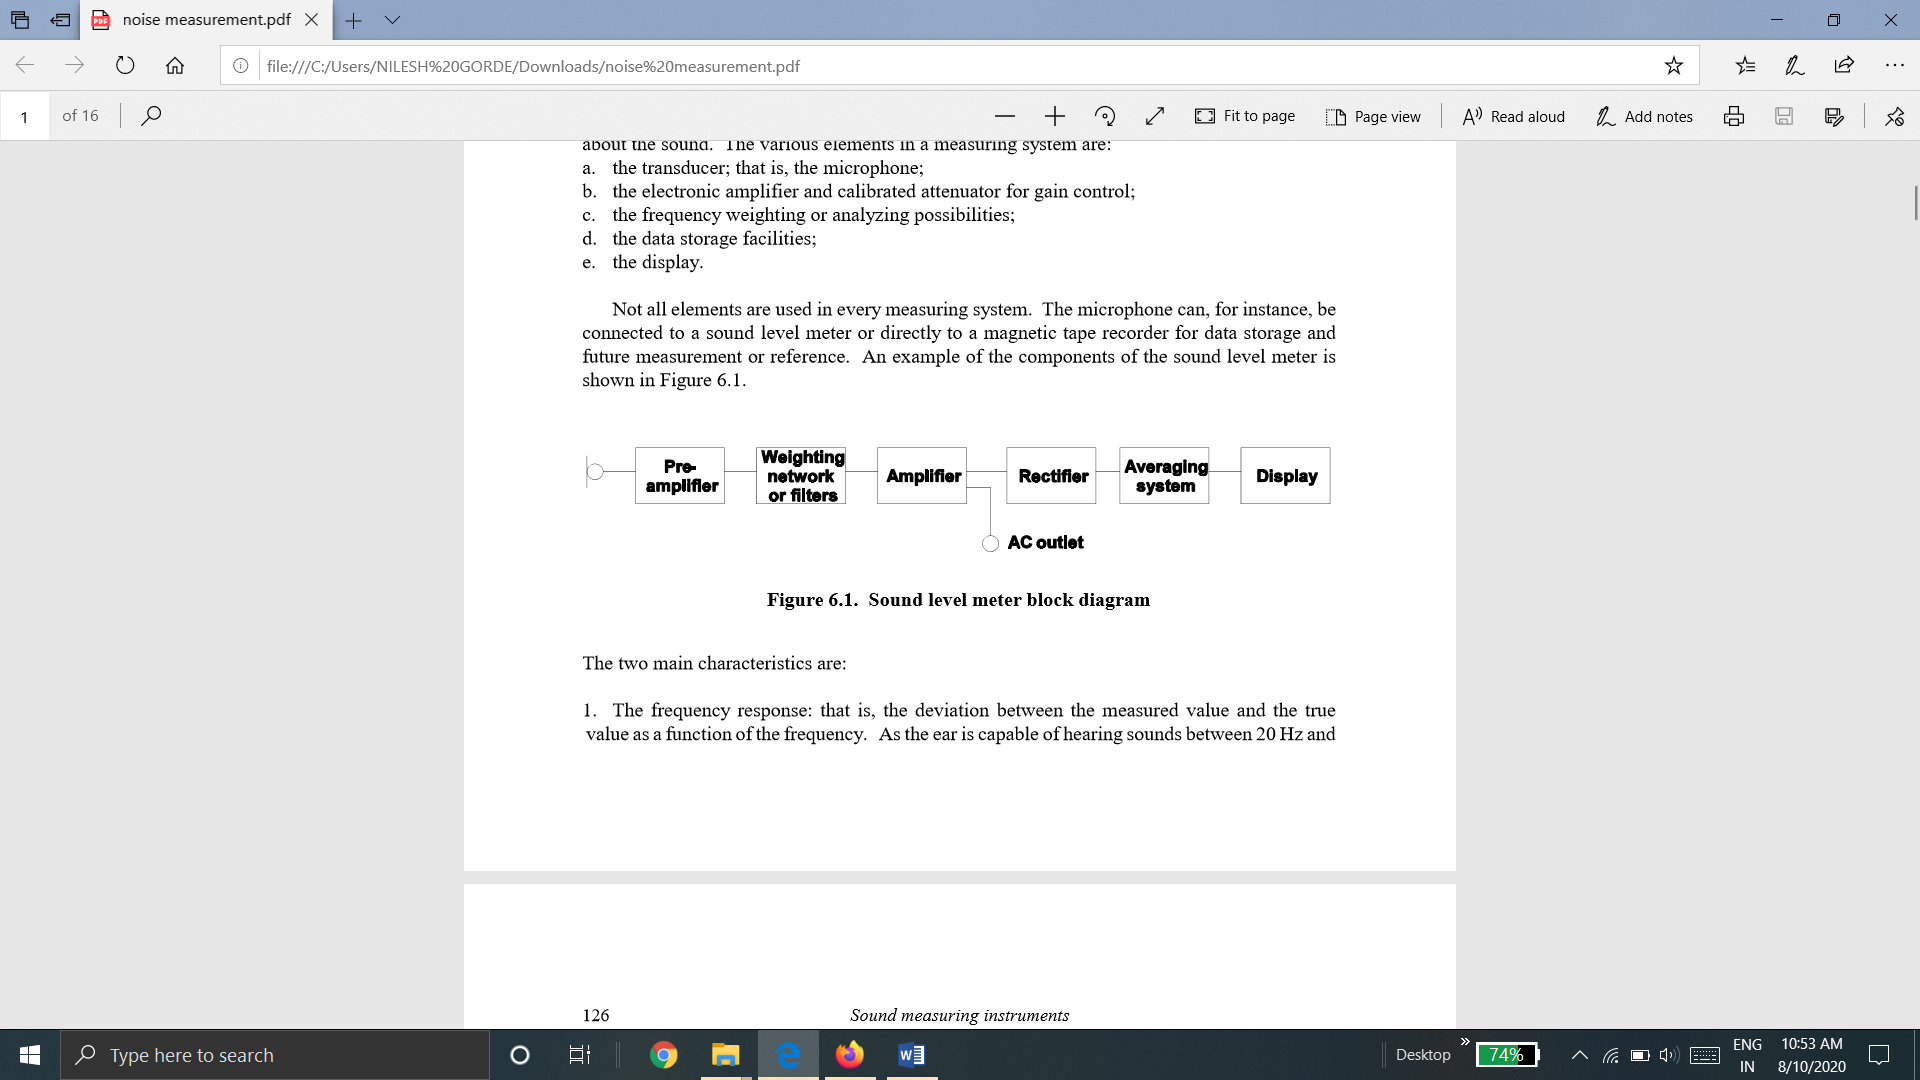
Sound Level meter amplifies the very small output signal from microphone and make it available for processing and for visual display by meter contained within the unit.
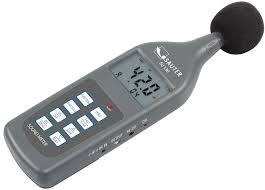
Block diagram of sound level meter is shown below:
![Industrial Power Transformers -- Operation and maintenance [part 3]](https://glossaread-contain.s3.ap-south-1.amazonaws.com/epub/1643172345_3021793.jpeg)
The electrical signal from the transducer is fed to the pre-amplifier of the sound level meter and, if needed, a weighted filter over a specified range of frequencies. Further amplification prepares the signal either for output to other instruments such as a tape recorder or for rectification and direct reading on the meter.
The rectifier gives the RMS value of the signal. The RMS signal is then exponentially averaged using a time constant of 0.1 s ("FAST") or 1 s ("SLOW") and the result is displayed digitally or on an analog meter.
In some cases, the sound level meter does not include a logarithmic converter. The scale on the indicating device is then exponential so that the linear signal may be read in dB. In this case, the dynamic range of the display is usually restricted to 10 to 16 dB and the precision of the reading is rather poor. In the case of intermittent noise, the user must constantly adjust the amplifier to adapt the output signal to the dynamic range of the display.
When a log converter is used, the display scale is linear in dB and its dynamic range is usually much greater. This type of display has the advantage of providing the same precision at any level and permitting a much better appreciation of the range of fluctuations of the noise to be measured. In this regard, digital displays are less useful.
3. Frequency Analyzer
Frequency analyzer is a device that provides the capability for analysis of a noise signal in the frequency domain by electronically separating the signal energy into various frequency band.
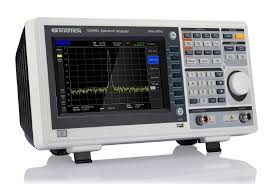
The objective of frequency analysis is to determine how the overall level is distributed over a range of frequencies. The most usual analysis for occupational hygiene noise studies is octave band analysis. For more detailed information, narrower bands can be used such as one-third octave analysis or constant bandwidth analysis.
A number of analyzers are available for use with the sound level meter. The simplest models are sets of passive filters (octave or one third octave) that can be inserted between the two amplifiers of the SLM. Other analyzers are specific instruments making it possible to automatically scan the whole range of frequency bands. These are sequential instruments making measurements in one band at a time.
This strongly restricts their use as the noise must be constant both in amplitude and in frequency during the 5 to 10 minutes of the analysis. More sophisticated analyzers have the possibility to make the frequency analysis in all desired bands at the same time. These are analyzers using a set of parallel filters or using the fast fourier transform of the input signal before recombining the data into the desired bands.
4. Noise Dosimeters
The need to ascertain the noise exposure of workers during their normal working day, has led to the development of the noise dosimeter. This is a small, light and compact instrument to be worn by the worker. It measures the total A-weighted sound energy received and expresses it as a proportion of the maximum A-weighted energy that can be received per day. This instrument is particularly useful whenever the exposure varies appreciably during the working day.
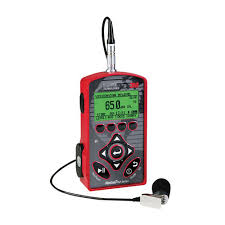
Dosimeters are actually sound level meters having a DC output signal converted into a series of impulses which are counted to provide the dose.
The noise dosimeter is clipped to the workers' clothes with the microphone close to the ear, and can be worn without hampering work. The dose provided by the instrument is of course dependent on the duration during which the instrument is used.
5. Recorders
Recorders are the device which provide a permanent record of the noise data, which is then available for the subsequent processing in a laboratory.
There are two types of recorders
If the sound level meter has a logarithmic DC output facility, common graphic recorders can be used to obtain a permanent record of the evolution of the sound level, providing that their writing speed is compatible with the SLOW or FAST characteristics of the SLM. If there is no DC output or if this output is not proportional to the dB level but only to the RMS pressure, then a special recorder must be used. Many different types are available and it is not intended to review them.
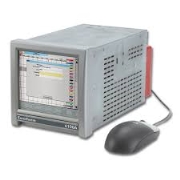
Paperless Graphic Level Recorder
b. Magnetic tape recorder
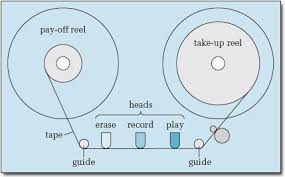
Magnetic tape recorders are used to make a permanent recording of the noise for future analysis or reference. Some HIFI audio recorders can be used, providing their frequency response and dynamic range are suitable. For general surveys, small recorders with a frequency response of + 3 dB in the range 30 Hz to 16 kHz and a dynamic range of 40 dB may be sufficient. For precise measurements and frequency analyses, higher quality instrumentation is needed. The real objectives of the instrument have to be assessed since the relative price of these instruments may vary in the range of 1 to 20.
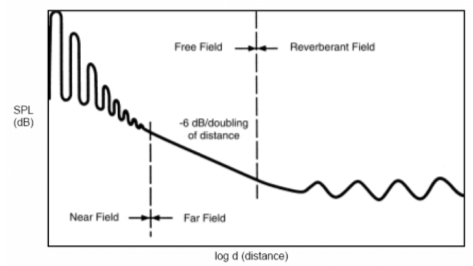
Sound field is the region in a medium in which sound waves are being propagated from the source of sounds.
The various types of sound fields are
The near field is the region close to a sound source usually defined as ¼ of the longest wave-length of the source. Near field noise levels are characterized by drastic fluctuations in levels as much as 10 dBA for small changes in distance from the source. Near field references can pertain to both indoor and outdoor environments.
2. Far Field
The far field describes a sound field beyond the near field limits described above where the sound pressure level (SPL) drops off at the theoretical rate of 6 dB fore very doubling of distance from the source. This rule of thumb is called the Inverse Square Law. Please note that if the far field does not meet the criteria for a free field as described below, then less than the theoretical drop rate will pertain. In such case doubling the distance from the source may yield a drop rate of 3-4 dB.
There are two types of far field, viz
To be considered free field there can be no obstructing surfaces in the sound path of spherical wave propagation. Free field conditions are characterized by SPL loss rates following the Inverse Square Law. Free field references pertain to large open outdoor spaces or in rooms where walls and other surfaces are almost completely absorptive. Anechoic (without echoes) acoustical test chambers simulate free field conditions where omnidirectional sound wave propagation exists
b. Reverberant or diffused field
In a diffuse field there are so many reflections contributing to the total sound field that sound levels measured virtually anywhere in the sound field are the same. Diffuse fields usually pertain to indoor environments. Rooms that are categorized as “live” have larger diffuse fields than free fields. “Dead” rooms have much larger free fields than diffuse field
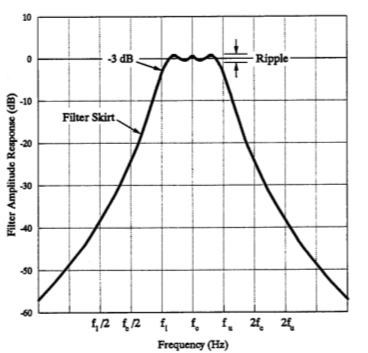
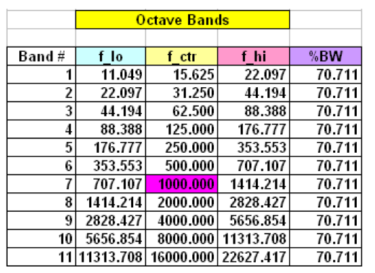
Octave Band - Measures the total acoustical energy within the passband of a band pass filter. The term “octave” denotes a doubling in frequency. Hence, each octave band covers a frequency range of one octave. We refer to the octave band by its center frequency. The center frequencies of successive filters are separated by one octave. The preferred octave band center frequencies (by international standard) are: 31.5, 63, 125, 250, 500, 1000, 2000, 4000, 8000 and 16000 Hz. The shape of a typical octave filter is shown in Figure 7.4 below. The bandwidth of a filter is the width in frequency between the –3 dB points. This is an example of a constant percentage bandwidth filter. The width of octave filters progressively increases with frequency. When plotted on a log scale, the shape of the band response is independent of frequency. The output of a percentage bandwidth filter is: dB/Bandwidth
Characteristic of Octave Band
In general, octave band is defined as the range of frequencies in which the highest frequency is twice the lowest frequency.
If fh is the highest frequency and fl is the lowest frequency, then
fh = 2 fl
and central frequency is given by,
fc =  fl = fh /
If fh and fl is separated by n octave band then,
fh = 2n fl
When a sound wave strikes one of the surfaces of a room, some of the sound energy is reflected back into the room and some penetrates the surface. Parts of the sound wave energy are absorbed by conversion to heat energy in the material, while the rest is transmitted through.
Similar to a light wave, when a sound wave encounters an object, one of three things can happen:
Usually a combination of all three processes occurs, with the proportion of each depending on the composition of the object and the frequency of the sound wave.
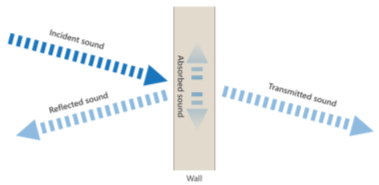
Reflection, Absorption and Transmission can be measured by certain coefficients as below
Reflection Coefficient is defined as the ratio of the sound intensity that is reflected from the boundary material to the intensity of sound incident on it.
It is given as

2. Absorption Coefficient
Absorption Coefficient is defined as the ratio of the sound intensity that is absorbed from the boundary material to the intensity of sound incident on it.
It is given as

3. Transmission Coefficient
Transmission Coefficient is defined as the ratio of the sound intensity that is transmitted from the boundary material to the intensity of sound incident on it.
It is given as

Acoustic Materials or sound absorbing materials are the materials which absorb and transmit the maximum sound waves and reflect the minimum sound waves.
A material which absorbs and transmits more sound waves then it reflects are considered as good acoustic materials.
Acoustic materials are classified as:
Characteristics of Acoustic materials
Increase in thickness provides better absorption od the wave and reflect less energy. As the thickness of the samples increases, sound absorption coefficient increases. The low frequency waves has higher wavelength, which means the thicker the material, better is absorption. Hence, material thickness has direct relation at low frequency range (100-2000 Hz) and is insignificant at high frequency (more than 2000 Hz)
The density of material is another factor that influences sound absorption by a material.
A high density material increases the sound absorption
The presence of pores of voids plays a crucial part as they act as the medium of sound wave dissipation.
Open pores with continuous channels provides better sound absorption because of the multiple reactions between the sound wave and the walls of the pores.
Source of noise may be a machine or mechanical devices, vibrating surface, mechanical shock, mechanical friction, fluid flow, frame burst or an explosion.
It is more economical and efficient to control the noise at the source. Modification at the source of sound are usually considered as the best solution for an industrial noise control problem.
Steps in noise control at source are:
Balancing of unbalanced equipment; Lubrication of moving parts; Tensioning driven belt; Replacement of worn out parts.
Hot working rather than cold working; Using welding rather than stoppers; Using cutting fluid in machining processes.
Use of electric equipment instead of pneumatic equipment; Using stepped dies instead of single-operation dies; Using rotating shears instead of square shears; using press instead of hammers.
Replacing gear drives with belt drives; Using centrifugal instead of propeller fans; Use of proper dampers for vibrating machines; Using properly shaped and sharpen cutting tools.
Replacing metal gears with plastic gears; Replacing solid wheels with pneumatic tyres; replacement of steel sprockets with polyamide plastic sprockets.
By changing manufacturing methods, such as moulding holes in concrete rather than cutting after production of concrete component or keeping noisy operations in same area and separated from non-noisy operations.
An effective noise control procedure is to enclose the sound source in an acoustic enclosure.
2. Noise control along path
The path implies course or direction taken by noise to reach the listener. The path may be direct or indirect.
Modifying the path through which the noise is propagated is often used when modification of the noise source is not possible, not practical or not economically feasible.
Steps in noise control along path are:
3. Noise control at receiver
Receiver is generally human.
In some cases when first two methods fail, it becomes necessary to apply noise control to the receiver.
Steps in noise control at the receiver are:
A pass-by-noise measurement is defined as the method of measuring the noise emission of a road vehicle under acceleration conditions, with various gear positions in a certain measurement range.
The pass-by noise measurement is mandatory for automotive manufacturers in terms of product certification. The ISO has norms for measurement, analysis and reporting format of pass-by noise measurement test.
The pass-by noise measurement should be performed in a large open space for type approval of commercial vehicles or measured during the official test stations. It is very important that the certification of emission noise measurement is performed before the mass production starts.

There are two techniques for pass-by-noise measurement:
Field pass-by-noise measurement
In field pass-by-noise measurement, the test vehicle is made to pass by two stationary microphones. The sound is then measured by two stationary microphones.

Indoor pass-by-noise measurement
In some cases, pass-by-noise measurement cannot be taken in field because of bad weather or bad test-trac conditions. In such cases, the indoor simulated pass-by-noise measurement is done. The indoor pass-by-noise measurement is considered as the conformance test, together with the field pass-by-noise.
![PDF] Determination of the near-field-acoustics of primary vehicle ...](https://glossaread-contain.s3.ap-south-1.amazonaws.com/epub/1643172346_4846377.jpeg)
Anechoic chamber is the special chamber or the room in which all the walls, floor and ceiling are covered by sound absorbing materials for maximum absorption of sound.
The ideal anechoic chamber will have no reflecting surfaces and 100 % sound waves will be absorbed by the acoustic materials.
The anechoic chamber is used to obtain the information like sound radiation pattern and narrow band frequency data.
2. Semi-Anechoic Chamber
Semi-Anechoic chamber is similar to that of anechoic chamber with sound absorbing materials covers all side walls and ceiling of the room. The only difference is that in semi-anechoic chamber, floor is having reflecting material.
The microphone response varies with the angle of incidence of the sound wave on the microphone it is called as directivity.
Due to reflection of floor some directivity is caused in semi-anechoic chamber.
3. Reverberant Chamber
All the walls, floor and ceiling of the room are covered with hard reflected surfaces in reverberant chamber. There is reflection and re-reflection of sound waves in the room which results in diffuse pressure field.
The ideal reverberant chamber has no absorptivity, means no sound wave is absorbed by any material. All the covered materials are pure reflective.
Reverberant chambers are used to average of energy radiated from different machines. In reverberant chamber, the effort of sound sources is averaged out and hence no information is obtained of phase relationship, directionality and location of sound sources.
To increase the diffusion of sound, the reverberant rooms are usually made of irregular shapes.
For sound power measurement, the reverberant chamber volume should be 200 m3 minimum.
Hearing is the process by which the ear transforms sound vibrations in the external environment into nerve impulses that are conveyed to the brain, where they are interpreted as sounds. In order for a sound to be transmitted to the central nervous system, the energy of the sound undergoes three transformations. First, the air vibrations are converted to vibrations of the tympanic membrane and ossicles of the middle ear. These in turn become vibrations in the fluid within the cochlea. Finally, the fluid vibrations set up traveling waves along the basilar membrane that stimulate the hair cells of the organ of Corti. These cells convert the sound vibrations to nerve impulses in the fibres of the cochlear nerve, which transmits them to the brainstem, from which they are relayed, after extensive processing, to the primary auditory area of the cerebral cortex, the ultimate centre of the brain for hearing. Only when the nerve impulses reach this area does the listener become aware of the sound.
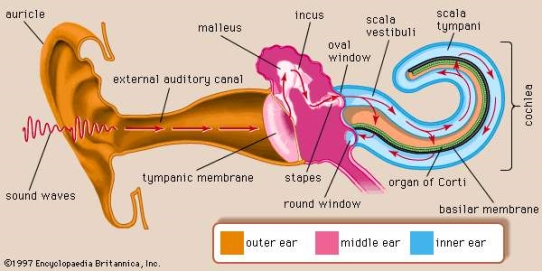
Human Ear is commonly divided into three parts:
It mainly consists of pinna, ear canal and ear drum.
Pinna projects from the side of the head skin, collects sounds and channels it into the ear canal.
Ear Canal is a tubular passage of about 25 mm long and 5-7 mm in diameter through sound wave passes to ear drum.
Ear drum is a shallow cone of about 7 mm diameter and separates middle ear from outer ear. It vibrates according to the frequency and amplitude of the sound that strikes on it.
2. Middle ear
Middle drum transmits and amplifies sound from ear drum to oval window.
It is an air-filled space and connected to a long thin tube called eustachian tube which transmits sound from ear drum to inner ear.
It amplifies sound over 13 times to that of oval window
3. Inner Ear
In inner drum, the actual sound reception takes place at the cochlea. Cochlea is located in extremely hard temporal bone and is divided in its length by basilar membrane. At the end of cochlea, two canals are connected by helicontrema which allows the flow of lymphatic fluid between two sections.
This Indian Standard was adopted by the Indian Standards Institution on 12 December 1968, after the draft finalized by the Functional Requirements in Building Sectional Committee had been approved by the Civil Engineering Division Council.
To prevent human life from the harmful effects of noise which continues to increase day by day, man shall continue his efforts to find ways and means for the abatement of noises which may be a cause of nuisance to an individual in particular or public in general.
According to Bureau of Indian Standards, noise levels of some noisy sources are given below

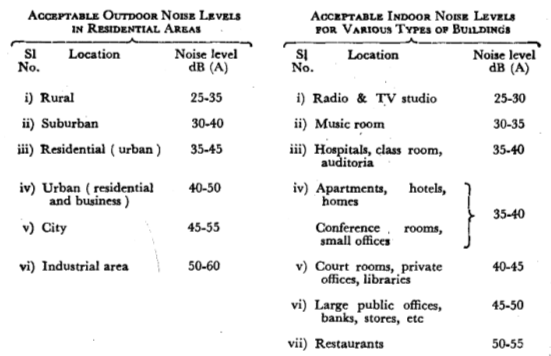
Usually, the town planning architect is primarily interested in the best utilization of land. But in this process, there are a number of factors (smoke, odour, noise, etc.), which he may consider. All these factors collectively help him to determine the zones which should be earmarked for residential, commercial and industrial purposes. Most important of all these factors is the extent of annoyance and disturbance caused to the community from various sources of noise. in order to ensure the requisite degree of quietness in certain specific buildings, suitable areas/locations need to be allocated for the purpose.
These aspects need careful consideration in the initial stages of planning a town. Following are the acceptable noise levels.
