Unit 3
Hydroelectric and Nuclear Power Plant
Hydroelectric power, electricity produced from generators driven by turbines that convert the potential energy of falling or fast-flowing water into mechanical energy.
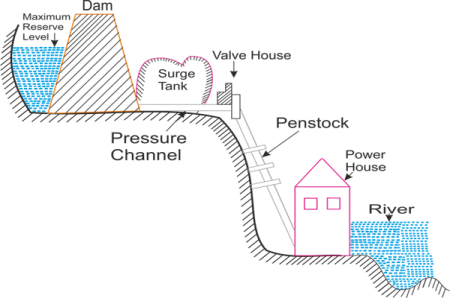
Hydroelectric power plants are usually located in dams that impound rivers, thereby raising the level of the water behind the dam and creating as high a head as is feasible. The potential power that can be derived from a volume of water is directly proportional to the working head, so that a high-head installation requires a smaller volume of water than a low-head installation to produce an equal amount of power.
The power P is developed-

Here,
W = Specific weight of water in kg/m3
Q = Rate of flow of water in m3/s
H = Height of fall or head in meters
η = Overall efficiency of operation
1. Water Availability:
Main fuel of this plant is water.So, such plant should be located nearer to river,canal etc. where sufficient water is available all the time.
2. Water Storage:
Storage of water in a suitable reservoir or dam has to be placed by a careful geological study of the area to get the maximum advantage of that water.Dam should be located across the river to get continuous water supply throughout the year specially in a dry season.The storage capacity of dam can be determined by hydrograph or mass curve or using analytical method.Adequate facilities of erection a dam and storage of water are two important matters for site selection of hydro electric power plant.
3. Water Head:
It is an important point for site selection of hydroelectric power plant.Water head is directly related to the cost of generation of electric power.If effective head is increased,water storage has to be reduced as well as capital cost of the plant is reduced.
4. Distance from the load center:
Since it is located away from the load center, more transmission line is required to supply the power. To avoid the line loss and economical power supply, distance of such plant should need more attention.
5. Transportation Facilities:
Good transportation facilities must be available to any hydro electric power plant, so that necessary equipment should be reached easily.
6. Availability of land:
Hydro electric power plant needs enough space.It should be kept in mind that land cost must be cheap.
1. Water Quantity:
a. Run off river power plants without storage
b. Run off river power plants with pondage
c. Reservoir power plants
2. Based on Head
As per height of water or water head, hydro electric power plant can be divided three categories:
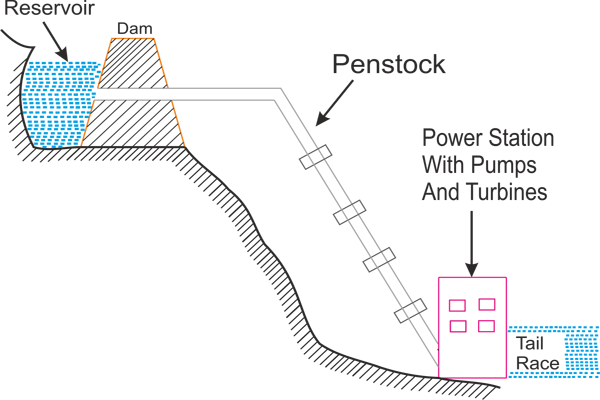
a. Low Head
Though there is no rule regarding water head height but below 30 meters is considered as low head.
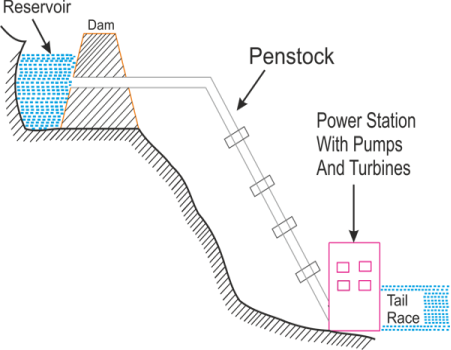
b. Medium head hydro electric power plant
Though there is no rule regarding water head height but above 30 meters to 300 meters is called medium head.
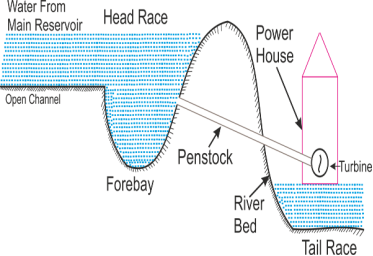
c. High head hydro electric power plant
Though there is no rule regarding water head height but above 300 meters is known as high head hydro electric power plant.
3. Nature of Load
a. Base load hydro electric power plant
This is a large capacity power plant. This plant work as a base portion of load curve of power system, that's why it is called base load plants. Base load plant is suitable for constant load. load factor of this plant is high and it is performed as a block load. Run off river plants without pondage and reservoir plants are used as base load plants.
b. Peak load hydro electric power plant
This plant is suitable for peak load curve of power system when demand is high, this type of plant do their job very well. Run off river plants with pondage can be employed as peak load plants. If water supply is available, it generates large portion of load at a peak load period. It needs huge storage area. Reservoir plants can be used as peak load plants. This type of plant can serve power throughout the year.
c. Pumped storage hydro electric power plant for the peak load
This is unique design of peak load plants. Here two types of water pond is used called upper head water pond and tail water pond. Two water ponds are connected each other by a penstock. Main generating pumping plant is lower end. During the off load period, surplus energy of this plant is utilized to pumping the lower head pond water to upper head pond water. This extra water is used to generate energy at pick load periods. By doing this arrangement, same water is used again and again. Extra water is required only to take care of evaporation and seepage.
Following are the factors affecting selection of hydraulic turbines :
ADVANTAGES: | |
|
|
1. Once a dam is constructed, electricity can be produced at a constant rate. | |
DISADVANATGES: | |
|
|
1. Dams are extremely expensive to build and must be built to a very high standard. | |
Hydrographs are charts that display the change of a hydrologic variable over time. Example: US Geological Survey's gaging station on the Tioga River near Mansfield, Pennsylvania. Although these examples are from a stream, hydrographs can also be made for lakes, water wells, springs and other bodies of water.
The Flow Duration Curve is one of the most fundamental pieces of information that feeds into the design of a hydropower project
The easiest way to understand the Flow Duration Curve is to construct one from scratch. Firstly let’s assume you have suitable equipment to measure the flow in a river for ten days. Each day you go out and record the flow and at the end of the period have a list of flow rates like this:
Date | Flow Rate |
April 1st | 0.25 m3/s |
April 2nd | 0.40 m3/s |
April 3rd | 1.60 m3/s |
April 4th | 1.00 m3/s |
April 5th | 0.60 m3/s |
April 6th | 4.50 m3/s |
April 7th | 3.00 m3/s |
April 8th | 2.40 m3/s |
April 9th | 1.90 m3/s |
April 10th | 1.30 m3/s |
Although useful, this doesn’t really help much, and with any table of data it is often better represented as a graph. If the flow rates are plotted as a bar-chart, the result is called a hydrograph and shows how the flow rate varied over a period of time, as shown below.
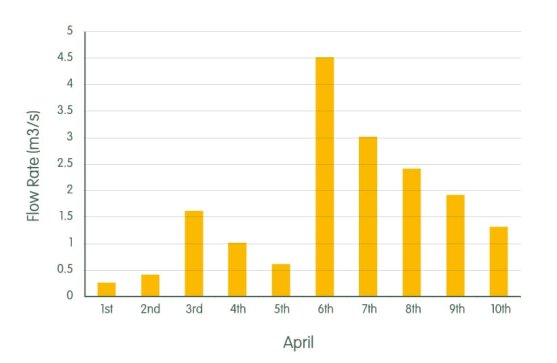
Hydrograph showing how flow rate varies over time
Although the hydrograph makes it easier to see the extremes of high and low flows, it is still quite difficult to see what happened in-between. For this you need a Flow Duration Curve.
To construct a Flow Duration Curve, rather than list the data in date order it is listed in order of the size of the flow rate, from highest to lowest. The data table would now look like this:
Date | Flow Rate |
April 6th | 4.50 m3/s |
April 7th | 3.00 m3/s |
April 8th | 2.40 m3/s |
April 9th | 1.90 m3/s |
April 3rd | 1.60 m3/s |
April 10th | 1.30 m3/s |
April 4th | 1.00 m3/s |
April 5th | 0.60 m3/s |
April 2nd | 0.40 m3/s |
April 1st | 0.25 m3/s |
Next, and one of the trickier concepts to grasp if this is the first time you’ve worked with a Flow Duration Curve, is that rather than plotting the flow rates against a date, they are plotted against a ‘percentage exceedence’ scale. In our example there are ten flow rates, and the percentage exceedence scale will go from 0% to 100%, so each percentage exceedence increment will be 100% divided by the number of data points, so in this case 100% divided by 10 = 10 percentage exceedence points. This can be added to the table above to show at what percentage exceedence each flow rate occurred.
Flow Rate | Percentage Exceed |
4.50 m3/s | 10% |
3.00 m3/s | 20% |
2.40 m3/s | 30% |
1.90 m3/s | 40% |
1.60 m3/s | 50% |
1.30 m3/s | 60% |
1.00 m3/s | 70% |
0.60 m3/s | 80% |
0.40 m3/s | 90% |
0.25 m3/s | 100% |
This data can then be plotted and a smoothed line drawn between each data point to produce the Flow Duration Curve shown below.
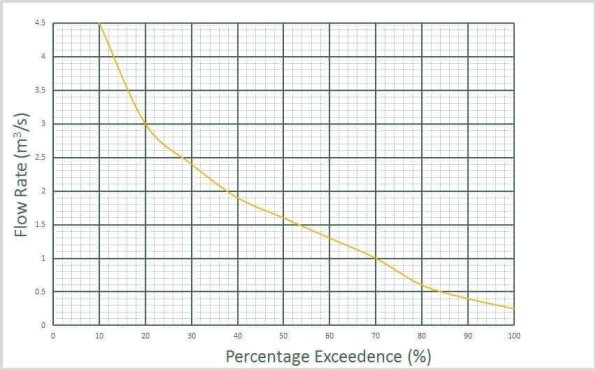
Flow Duration Curve
This is now a Flow Duration Curve.
| A mass diagram is the plot of accumulated inflow (i.e. supply) or outflow (i.e. demand) versus time. The mass curve of supply (i.e. supply line) is, therefore, first drawn and is superimposed by the demand curve. The procedure to construct such diagram is as follows:
|
|
It is well known that the hydro power plants directly influence the habitat and the climate. Still, the hydro power represents a
green renewable energy source, not polluting the environment if proper measures are applied. The main objective of the
researches in this field is represented by the quality of the water discharged from turbines and especially by the low dissolved
oxygen level that may have an unfavorable impact over environment and can endanger the aquatic life. During the summer
months, due to the thermal stratification of the dam reservoirs and to the degasification phenomenon resulted when water passes
through the turbine, the oxygen level can drop under the minimum limit of 5-6 mg/L, needed for aquatic life. The authors propose
the water aeration process optimization, outlining the importance of the aeration “quality” (bubbles dimensions, retention times,
pressure drop, geometry and dimensioning of the aeration systems) on the mass transfer process and not the quantity of air
injected.
It is important to remember that people, and all their actions, are part of the natural world. The materials used for building, energy, clothing, food, and all the familiar parts of our day-to-day world come from natural resources. Our surroundings are composed largely of the A built environment structures and facilities built by humans for comfort, security, and well-being. As our built environment grows, we grow more reliant on its offerings. To meet our needs and support our built environment, we need electricity which can be generated by using the resources of natural fuels.
Most resources are not renewable; there is a limited supply. In obtaining resources, it is often necessary to drill oil wells, tap natural gas supplies, or mine coal and uranium. To put water to work on a large scale, storage dams are needed. We know that any innovation introduced by people has an impact on the natural environment. That impact may be desirable to some, and at the same time, unacceptable to others. Using any source of energy has some environmental cost. It is the degree of impact on the environment that is crucial.
Some human activities have more profound and lasting impacts than others. Techniques to mine resources from below the earth may leave long-lasting scars on the landscape. Oil wells may detract from the beauty of open, grassy fields. Reservoirs behind dams may cover picturesque valleys. Once available, use of energy sources can further impact the air, land, and water in varying degrees. People want clean air and water and a pleasing environment. We also want energy to heat and light our homes and run our machines.
The demand for electrical power must be curbed or more power must be produced in environmentally acceptable ways. The solution, however, is not so simple. Conservation can save electricity, but at the same time our population is growing steadily. Growth is inevitable, and with it the increased demand for electric power. Since natural resources will continue to be used, the wisest solution is a careful, planned approach to their future use. All alternatives must be examined, and the most efficient, acceptable methods must be pursued. Hydroelectric facilities have many characteristics that favour developing new projects and upgrading existing power plants:
-- Hydroelectric power plants do not use up limited non renewable resources to make electricity.
-- They do not cause pollution of air, land, or water.
-- They have low failure rates, low operating costs, and are reliable.
--They can provide start up power in the event of a system wide power failure.
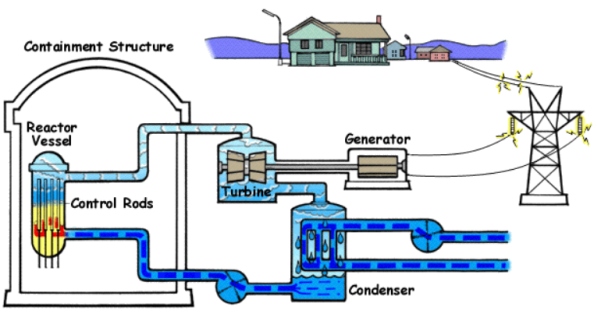
3.14 Elements of NPP
1. Nuclear Reactor
The reactor is a key component of a power plant, as it contains the fuel and its nuclear chain reaction, along with all of the nuclear waste products. The reactor is the heat source for the power plant, just like the boiler is for a coal plant. Uranium is the dominant nuclear fuel used in nuclear reactors, and its fission reactions are what produce the heat within a reactor. This heat is then transferred to the reactor's coolant, which provides heat to other parts of the nuclear power plant.
2. Steam Generator
The production of steam is common among all nuclear power plants, but the way this is done varies immensely. The most common power plants in the world use pressurized water reactors, which use two loops of circling water to produce steam. The first loop carries extremely hot liquid water to a heat exchanger, where water at a lower pressure is circulated. It then heats up and boils to steam, and can then be sent to the turbine section.
3. Turbine and generator
Once steam has been produced, it travels at high pressures and speeds through one or more turbines. These get up to extremely high speeds, causing the steam to loose energy, therefore, condensing back to a cooler liquid water. The rotation of the turbines is used to spin an electric generator, which produces electricity that is sent out the the electrical grid
4. Cooling Towers
They work to reject waste heat to the atmosphere by the transfer of heat from hot water (from the turbine section) to the cooler outside air. Hot water cools in contact with the air and a small portion, around 2%, evaporates and raises up through the top. Moreover, these plants do not release any carbon dioxide—the primary greenhouse gas that contributes to climate change.

3.16 Cladding
References
1. E.I.Wakil, Power Plant Engineering‖, McGraw Hill Publications New Delhi
2. P.K.Nag, Power Plant Engineering‖, McGraw Hill Publications New Delhi.
3. R.Yadav , Steam and Gas Turbines‖ ,Central Publishing House, Allahabad.
4. G.D.Rai, Non-Conventional Energy Sources, Khanna Publishers,Delhi
5. S.P.Sukhatme, Solar Energy‖ Tata McGraw-Hill Publications, New Delhi
6. G R Nagpal Power Plant Engineering , Khanna Publication
