Back to Study material
THERMO

UNIT 4

Properties of Pure substances & Thermodynamics of Vapour Cycle


A substance that has a homogeneously fixed chemical composition is called a pure substance.

In thermodynamics, Steam is considered as a pure substance.

So, in this module, we are going to study about the various processes and properties of steam.

Formation of steam
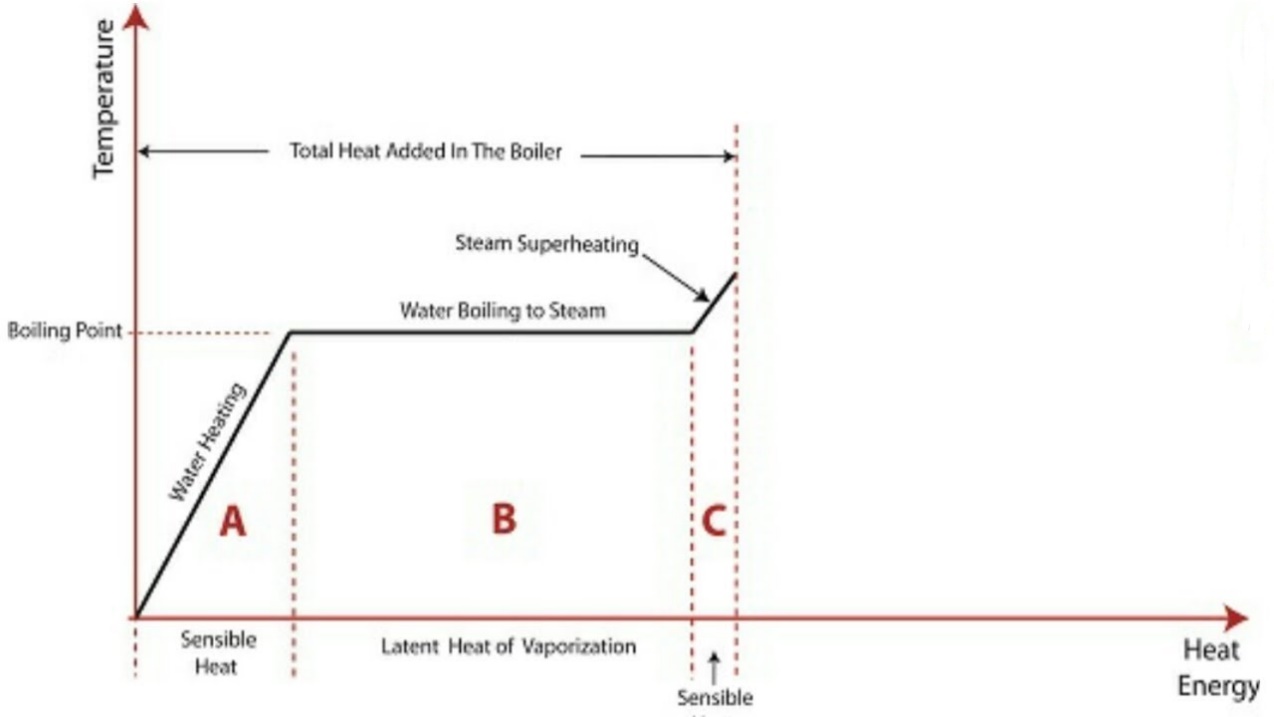
The above diagram shows the phase change occurring when water from and at 0°C is heated till is converted to steam and further to superheat it.

Temperature is plotted as ordinate and Enthalpy as abscissa.

Phase Change

  • During part A, water at 0°C is heated till it is converted into saturated liquid at 100°C, ie, the boiling point of water. During this process, water does not undergo any phase change. Hence, the heat supplied is used only for sensible heating of water. It is denoted by hf and is called as enthalpy of liquid.
  • During part B, water at 100°C is being heated to convert it into steam. Complete conversion of water into steam with no water droplets presence takes time. The heat transfer taking place during this process is utilized to change the phase of water from liquid to gaseous state. This is denoted by hfg and is called as latent heat of vapourisation.
  • During parts A and B, the total heat transferred is denoted by hg and it is given by
  • hg = hf + hfg

  • During part C, the steam is already dry saturated. Any further heating results in superheating of steam. The heat supplied during this process is denoted by hsup and it is given by
  • hsup = hg + Cp (tsup - tsat)

    tsup = temperature of superheated steam

    tsat = temperature of saturation of steam

    Cp = Specific heat of water at constant pressure.


    In order to understand the change in properties of water and steam during the phase change process, we have to study the property diagrams.
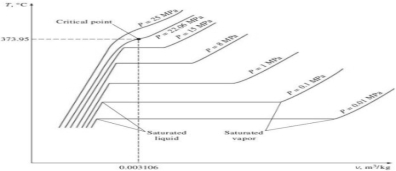
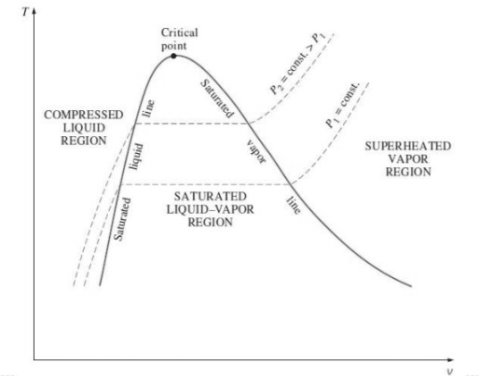
  • T-v diagram for pure substance:
  • Critical Point

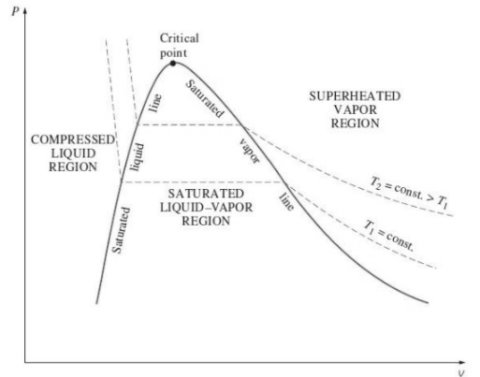
  • As we go on increasing the pressure of the system, the saturation line continues to become smaller and smaller, and it becomes a point when the pressure is 22.06 MPa (220.6 bar) for water.
  • This point is called the critical point, and it is defined as the point where the saturated liquid and saturated vapor states are same or latent heat of vapourisation becomes 0.
  • The temperature, pressure, and specific volume of a substance at the critical point are called, respectively, the critical temperature Tcr, critical pressure Pcr, and critical specific volume vcr.
  • The properties of water at critical-point are Pcr = 22.06 MPa, Tcr = 373.95°C, and vcr = 0.003106 m3/kg.
  • The saturated liquid states can be connected by a line called the saturated liquid line, and saturated vapour states in the same figure can be connected by another line, called the saturated vapour line.
  • These two lines meet at the critical point, forming a dome as shown in Fig.
  • All the compressed liquid states are located in the region to the left of the saturated liquid line, called the compressed liquid region.
  • All the superheated vapor states are located to the right of the saturated vapour line, called the superheated vapour region.
  • In these two regions, the substance exists in a single phase, a liquid or a vapour.
  • All the states that involve both phases in equilibrium are located under the dome, called the saturated liquid–vapour mixture region, or the wet region.
  • 2.     P-v diagram for pure substance:

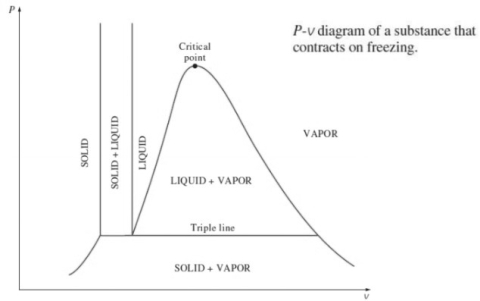
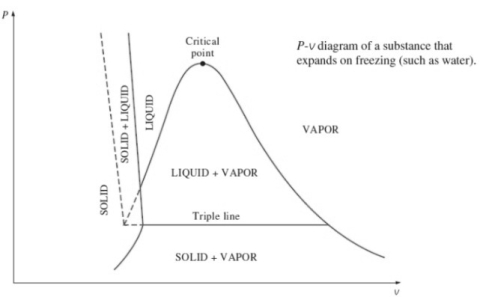
    Triple point

  • Under some special conditions, all 3 phases of a pure substance can co-exist in equilibrium
  • On P-v or T-v diagrams, these triple-phase states form a line called the triple line.
  • The states on the triple line of a substance have the same pressure and temperature but different specific volumes.
  • The triple line appears as a point on the P-T diagrams and, therefore, is often called the triple point.
  • For water, the triple-point temperature and pressure are 0.01°C and 0.6117 kPa, respectively.
  •  

    3.     P-T diagram for pure substance:

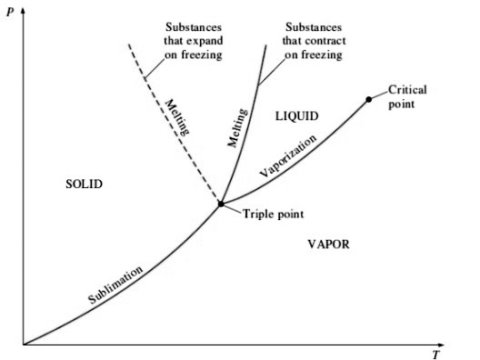
  • The P-T diagram of a pure substance is often called the phase diagram since all three phases are separated from each other by three lines.
  • The sublimation line separates the solid and vapor regions,
  • The vaporization line separates the liquid and vapor regions, and
  • The melting (or fusion) line separates the solid and liquid regions.
  • These three lines meet at the triple point, where all three phase co-exist in equilibrium.
  • The vaporization line ends at the critical point because no distinction can be made between liquid and vapor phases above the critical point.
  • Substances that expand and contract on freezing differ only in the melting line on the P-T diagram.
  •  


    For a wide range, it is very difficult and complex to keep track of various relationships of thermodynamic properties.

    Hence, these are tabulated to make it easier for engineers to find various values.

    For water, these are called as STEAM TABLES.
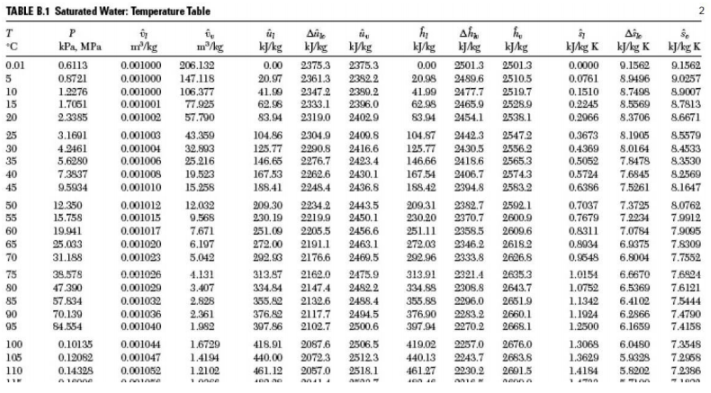
    Figure shows the temperature table for saturated water.

    There are 3 notations used.

  • Subscript ‘f’ means property of liquid.
  • Subscript ‘g’ means property of gas.
  • Subscript ‘fg’ means sum of the property for liquid and gas.

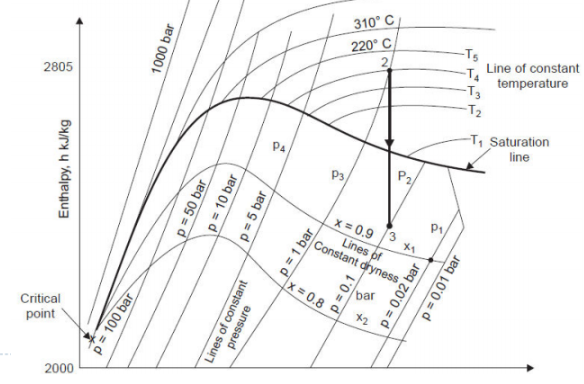
  • It was prepared by Dr. Mollier. It shows relation between enthalpy and entropy or water at various pressures. It is very useful. The steam tables are actually tabulated version of Mollier diagram.


    Dryness fraction is defined ratio of mass of dry steam to total mass of mixture of wet steam.

    It is denoted by ‘x’.

  • For dry saturated, it is 1.
  • For wet steam, it is between 0 and 1.
  • It is very important property of steam and needs to be determined before the steam is fed to the boiler.

    The dryness fraction of steam can be measured by using the following calorimeters:
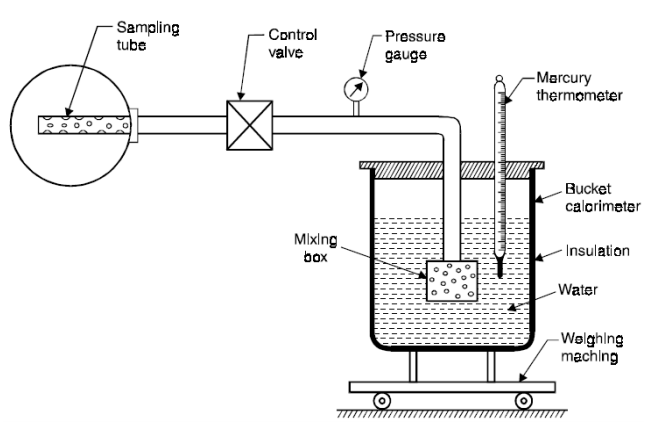
  • Barrel Calorimeter
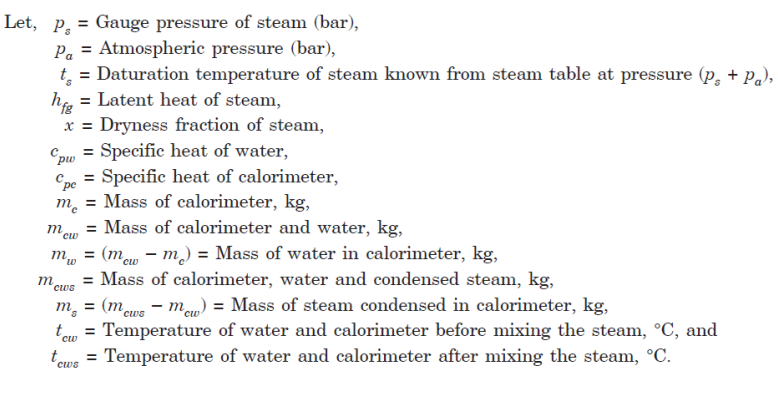
  • Some mass of steam is passed through a some mass of water and steam is completely condensed.
  • The heat lost by steam is heat gained by the water.
  • Neglecting the losses to the surrounding and assuming that the heat lost by steam is gained by either water or calorimeter, we can express this as
  • On solving the above equation, the value of dryness fraction of the steam can be easily calculated.
  • 2.     Throttling Calorimeter

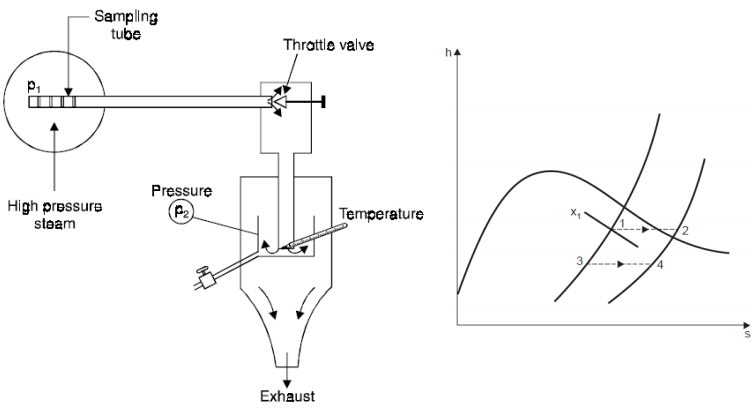
  • The steam to be analyzed, is taken from the pipe by a tube.
  • It passes into an insulated container and is throttled through an orifice to atmospheric pressure.
  • The throttling process is shown on h-s diagram in Fig. by the line 1-2.
  • If steam initially wet is throttled through a sufficiently large pressure drop, then the steam at state 2 will become superheated.
  • State 2 can then be defined by the measured pressure and temperature.
  • The enthalpy, h2 can then be found and hence
  • h2 = h1 = hf1 + x1hfg1

    x1 = (h2 - hf1) / hfg1

    3.     Separating and Throttling Calorimeter
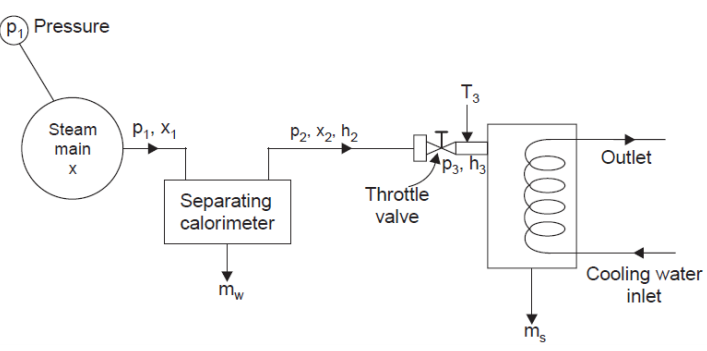
  • If the steam to be analyzed, is very wet, then only throttling to atmospheric pressure may not be sufficient to ensure superheating of steam.
  • In this case, it is necessary remove some moisture content from the steam before throttling.
  • This is done by passing the steam sample from the main through a separating calorimeter. Here, steam is made to change direction suddenly, and water, since it is denser than steam, is separated.
  • Mass of water separated (mw) is measured. Steam remaining, which now has a higher dryness fraction, is passed through the throttling calorimeter.
  • With the combination of separating and throttling calorimeters, it becomes necessary to condense the steam after throttling and measure the amount of condensate (ms).
  • Dryness fraction at state 2 is x2. Therefore, the mass of dry steam leaving the separating calorimeter is equal to (x2.ms) and this must be the mass of dry vapour in the sample drawn from the main at state 1.
  • x1 = (mass of dry vapour) / total mass = (x2.ms) / (mw + ms)

    h3 = h2 = hf2 + x2.hfg2

    x2 = (h3 – hf2) / hfg2  


    In a previous module, we have seen the limitations of Carnot Cycle.

    The actual steam power plants work on Rankine Cycle.

    Simple Rankine Cycle:
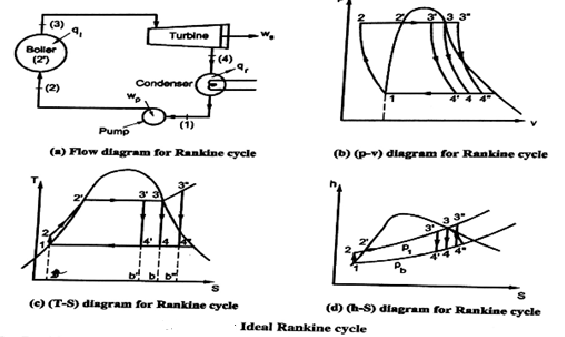
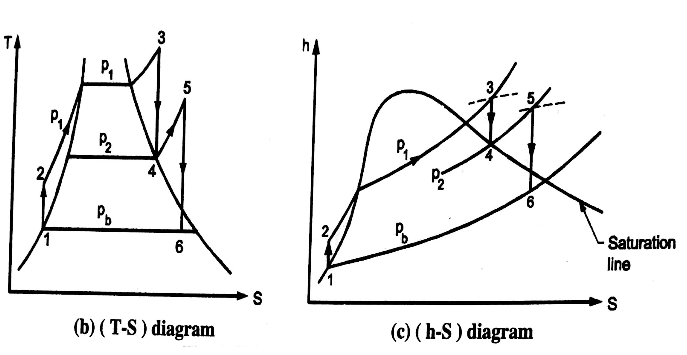
    The above diagrams illustrate the various processes of a simple Rankine Cycle applied to a simple steam powered power plant.

    Let us the various processes.

  • Process 1-2 Water is compressed in Pump till intake pressure of boiler. It is an isentropic compression process.
  • Process 2-3 Water enters boiler at intake pressure, heat (qi) is added to the system to convert water into steam. The entire process takes place at constant pressure. It is an isobaric heat addition process.
  • Process 3-4 Steam from boiler enters the turbine where it expands to produce useful work. The process is isentropic expansion.
  • Process 4-1 Exhaust wet steam from the turbine enters the condenser where it is condensed back to water to be used as feed to boiler. It is an isobaric heat rejection process.
  • Analysis of Rankine Cycle

    Assume 1 kg of steam in the cycle and applying SFEE to various processes, we get,

    for Process 1-2

    Pump work = h2 - h1 = ʃ-V dp

    for Process 2-3

    Heat supplied in boiler (qi) = h3 - h2

    For Process 3-4

    Work done in turbine = WT= h3 - h4

    For Process 4-1

    Heat rejected in condenser (qr) = h4 – h1

    Efficiency of Rankine Cycle (η)

    Efficiency of Rankine Cycle η = (Shaft work) / (Heat supplied)

           = WT – WP / qi

           = {(h3 - h4) - (h2 - h1)} / h3 - h2  

    Methods of improving efficiency of Rankine Cycle
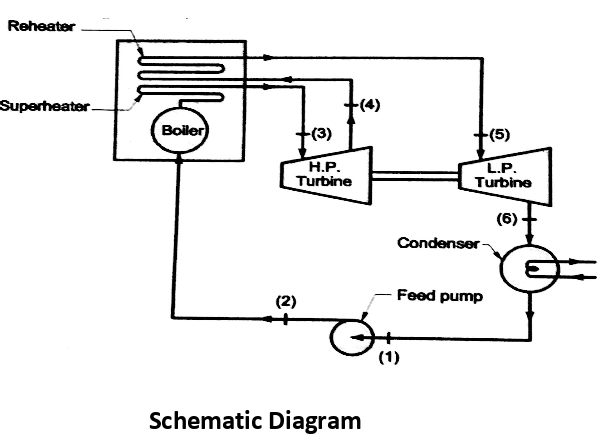
  • Rankine cycle with reheat
  • Regenerative heating feed heating cycle
  •  

  • Modified Rankine Cycle – Rankine Cycle with Reheat
  • Analysis of Rankine cycle with reheat

    Efficiency of reheat cycle for two stage turbines with one reheater in between the stage can be computed as

    WT = WT(HP) + WT(LP)

    = (h3 – h4) + (h5 – h6)

     Wp = (h2 - h1)

     Heat Supplied = Heat supplied in boiler and reheater = (h3 - h2) + (h5 - h4)

    Advantages

  • Improves condition of steam at exhaust of LP turbine, thereby reduces erosion of blade.
  • Improves thermal efficiency of plant as additional heat is supplied at higher mean temperature increases the network output of turbine.
  • Reduces steam rate per kWh.
  • Disadvantages

  • Increases cost and size of plant due to inclusion of reheater and long piping
  • Increases size of condenser based on unit mass flow of steam due to improved quality of steam at exhaust from LP turbine.

  • Index
    Notes
    Highlighted
    Underlined
    :
    Browse by Topics
    :
    Notes
    Highlighted
    Underlined