Unit - 4
Design against Fluctuating loads
Stress concentration is defined as the localization of high stresses caused by component irregularities and abrupt changes in cross section.
A factor known as the stress concentration factor is used to consider the effect of stress concentration and identify localized stresses. It is represented by the letter K and is defined as follows:
K is the ratio of the highest value of actual stress near the discontinuity to the nominal stress calculated using elementary equations for the smallest cross-section.

Causes of Stress Concentration
- Variation in Properties of material – internal cracks, cavities, air holes
- Load application (point load/ surface load)
- Abrupt changes in sections
- Discontinuities in Component
- Machining Scratches
Stress Concentration Factors
The stress concentration factors are determined using two methods: the mathematical method based on elasticity theory and experimental methods such as photo elasticity. Photo elasticity determines the stress concentration factors for simple geometric shapes. RE Peterson created the charts for stress concentration factors for various geometric shapes and loading conditions! FEA packages are currently used to calculate the stress concentration factor for any geometric shape.
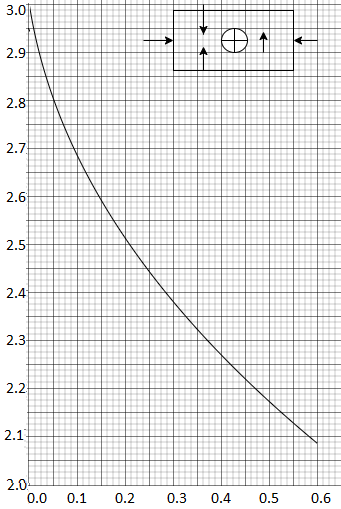
Figure shows a stress concentration factor chart for a rectangular plate with a transverse hole loaded in tension or compression. In this case, the nominal stress is given by,

Where t is the thickness of the plate
However, the Theory of Elasticity can be used to calculate the stress concentration elliptical factor for some simple geometric shapes. Figure below depicts a flat plate with a hole that has been subjected to tensile force. Using the Theory of Elasticity, it is possible to demonstrate that the theoretical stress concentration factor at the hole's edge is given by,

Where a = half the width (or semi-major axis) of the ellipse perpendicular to the load direction b = the ellipse's half width (or semi-minor axis) in the direction of the load The ellipse becomes sharper and sharper as b approaches zero.
A very sharp crack is indicated, and the stress at the crack's edge becomes extremely high. When b=0, it is discovered that 
As a result, as the width of the elliptical hole in the load direction approaches zero, the stress concentration factor approaches infinity. When (a = b), the ellipse becomes a circle.

As a result, the theoretical stress concentration factor caused by a small circular hole in a flat plate subjected to tensile force is 3.
The stress concentration charts are based on either a photo elastic analysis of the epoxy models with a circular polariscope or a theoretical or finite element analysis of the mathematical model. This is why the factor is referred to as the theoretical stress concentration factor. The model is made of a different material than the component itself. The material's ductility or brittleness has a significant impact on its response to stress concentration. Furthermore, the type of load—static or cyclic—influences the severity of stress concentration.
As a result, there is a discrepancy between the theoretical stress concentration factor and the actual stress concentration in the component. The following guidelines should be followed by the designer:
Load and Material Type | Common Practice |
Ductile Material Under Static Load | Ignore theoretical stress concentration factor |
Ductile Material Under Fluctuating load | Update theoretical stress concentration factor with notch sensitivity factor |
Brittle Material (both static and fluctuating load) | Use theoretical stress concentration factor |
Key Takeaway
Stress concentration is defined as the localization of high stresses caused by component irregularities and abrupt changes in cross section.

It causes are Variation in Properties of material – internal cracks, cavities, air holes, Load application (point load/ surface load), Abrupt changes in sections, Discontinuities in Component, Machining Scratches
The stress concentration factors are determined using two methods: the mathematical method based on elasticity theory and experimental methods such as photo elasticity However, the Theory of Elasticity can be used to calculate the stress concentration elliptical factor for some simple geometric shapes.
Although the effect of stress concentration cannot be completely eliminated, there are methods for reducing stress concentrations. This is accomplished by giving the component a specific geometric shape.
Tension Member with Additional Notches and Holes
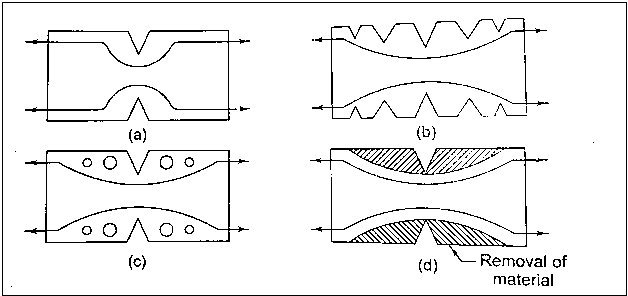
Figure shows a flat plate with a V-notch that has been subjected to tensile force. It has been discovered that a single notch causes a high degree of stress concentration. Three methods are used to reduce the severity of stress concentration: (a) the use of multiple notches; (b) the drilling of additional holes; and (c) the removal of unwanted material. These methods are depicted in Figs. (b), (c), and (d). The principle of material minimization refers to the method of removing unwanted material. The sharp bending of a force flow line is reduced in these three methods, and it follows a smooth curve.
Fillet Radius, Undercutting, and Member Notch in Bending
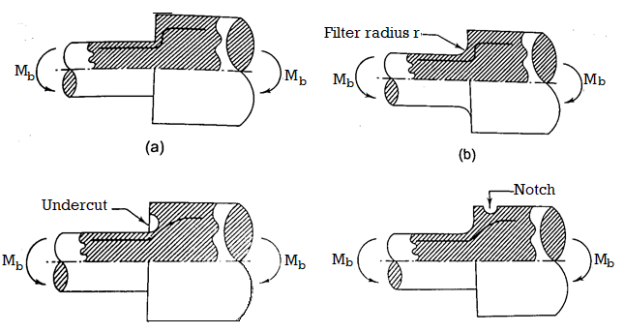
Figure depicts a bar with a circular cross-section and a shoulder that is subjected to a bending moment (a). This shoulder is occupied by ball bearings, gears, or pulleys. The shoulder alters the cross-section of the shaft, resulting in stress concentration. There are three methods for reducing stress at the base of this shoulder. The shoulder with a fillet radius r is depicted in Fig.(b). As a result, the transition from small to large diameter is gradual. To reduce stress concentration, the fillet radius should be as large as possible. The design of mating components limits the fillet radius in practice. The radius of the fillet can be increased by undercutting the shoulder, as shown in Fig (c). Stress is concentrated as a result of a notch. Surprisingly, adding a notch to your belt is an effective way to reduce stress concentration. This is depicted in Fig (d).
Drilling Additional Holes for Shaft
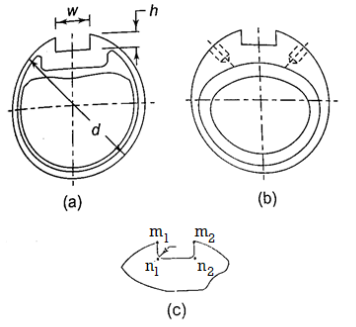
Figure shows a transmission shaft with a keyway (a). Because the keyway has a discontinuity, stress concentrates at the keyway's corners, reducing torsional shear strength. The ratio C of torsional strength of a shaft with a keyway to torsional strength of a similar sized shaft without a keyway is given by an empirical relationship derived by HF Moore.

Figure(c) depicts the keyway's four corners, namely m1, m, n, and n2. Torsional shear stresses at two sites, m1 and m2, have been found to be negligibly small in practice and theoretically equal to zero. The torsional shear stresses at two places, n and n2, on the other hand, are excessive and theoretically infinite, implying that even a little torque will result in a permanent set at these points. The stress concentration can be reduced by using a fillet radius to round corners at two places, n1 and n2. When a shaft with a keyway is subjected to combined bending and torsional moments, a stress concentration factor K1 = 3 should be employed.
Reduction of Stress Concentration in Threaded Members
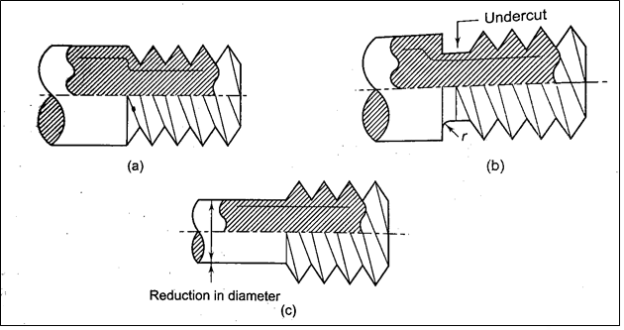
Figure (a) shows a threaded component. The force flow line is curved as it passes from the shank portion of the component to the threaded portion. As a result, stress builds up in the transition plane. A tiny undercut is made between the shank and the threaded portion of the component in Fig.(b), and this undercut is given a fillet radius. As a result, the force flow line bends less, resulting in less stress concentration. The shank diameter is lowered and made equal to the thread core diameter in Fig.(c), which is an effective way for reducing stress concentration. The force flow line is essentially straight in this example, and there is no stress concentration.
Key Takeaway
Although the effect of stress concentration cannot be completely eliminated, there are methods for reducing stress concentrations like Implementing Additional Notches and Holes, Fillet Radius, Undercutting, and Member Notch in Bending Drilling Additional Holes for Shaft
Components in many applications are subjected to forces that are not static but vary in magnitude over time. Fluctuating stresses are the stresses that are created as a result of such pressures. It is estimated that around 80-90% of mechanical component failures are caused by fatigue failures caused by varying loads.
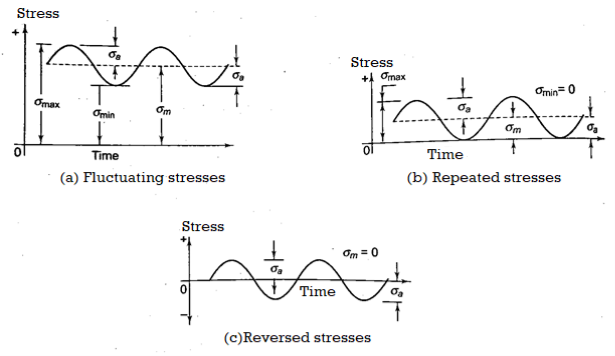
A reversed stress cycle, for example, is described as cycling between equal magnitudes of maximum tensile stress and minimum compressive stress.
With relation to time, the fluctuating or alternating stress fluctuates in a sinusoidal fashion. It has an amplitude value as well as a mean value. It oscillates between two extremes of stress: maximum and minimum. Tensile, compressive, or partly tensile and partly compressive stress can all occur. The repeating stress fluctuates sinusoidally with time, but only from zero to a maximum value. In this example, the minimal stress is 0, hence the amplitude and mean stress are identical. The reversed stress changes in time in a sinusoidal pattern, but it has no mean stress. In this scenario, tensile stress accounts for half of the cycle, while compressive stress accounts for the other half. Between these two parts, there occurs a complete reversal from tension to compression, and so the mean stress is
 Mean stress (fatigue tests)
 Range of stress (fatigue tests)
 Stress amplitude (fatigue tests)
 Stress ratio (fatigue tests)
Key Takeaway
- Components are subjected to forces that are not static but vary in magnitude over time causes fluctuating stresses as a result of such pressures. It is estimated that around 80-90% of mechanical component failures are caused by fatigue failures caused by varying loads
- With relation to time, the fluctuating or alternating stress fluctuates in a sinusoidal fashion. It has an amplitude value as well as a mean value. It oscillates between two extremes of stress: maximum and minimum
- A reversed stress cycle is described as cycling between equal magnitudes of maximum tensile stress and minimum compressive stress
Fatigue is a type of failure that occurs in structures that are subjected to fluctuating and dynamic stresses. Because this form of failure usually occurs after a long period of recurrent stress or strain cycling, the term fatigue is utilized. Fatigue is significant because it is the most common cause of metal failure, accounting for over 80-90% of all failures. Even in ordinarily ductile metals, fatigue failure is brittle in nature, with little to no extensive plastic deformation. The process is initiated and propagated via fractures, and the fracture surface is usually perpendicular to the tensile stress direction.
Under cyclic loading, fatigue failure is characterized as a time-delayed fracture. Transmission shafts, connecting rods, gears, vehicle suspension springs, and ball bearings are all examples of parts that are prone to fatigue failure.
There is a fundamental distinction between failure caused by static stress and failure caused by fatigue. The simple tension test demonstrates failure due to static load. The force is delivered gradually in this situation, allowing sufficient time for fibre elongation. Prior to fracture, there is a lot of plastic flow in ductile materials. The stretching of crystals at the shattered surface results in a silky fibrous structure.
Fatigue failure, on the other hand, begins with a crack in the material at some point. The crack is more likely to appear in the areas below:
- Discontinuity regions, such as grease holes, keyways, screw threads, and so on.
- In machining processes, irregularities such as scratches on the surface, stamp marks, inspection markings, and so on.
- Internal fissures caused by material flaws such as blow holes
Because of the crack, these areas are susceptible to stress concentration. Due to fluctuating loads, the crack spreads until the component's cross-section is so small that the remaining portion is vulnerable to rapid fracture.
Causes of Fatigue Failure
Fatigue failures occur for a variety of reasons, the most common of which are:
- Surface flaws such as machining marks and surface irregularities are the most common causes of fatigue failures.
- Notches, keyways, screw threads, and matching under-cuts are examples of stress concentrations.
- The fatigue strength is great at low temperatures and gradually diminishes as the temperature rises.
- Corrosive conditions lower fatigue strength.
Thermal fatigue is generally caused by varying thermal loads at elevated temperatures; mechanical pressures from an external source are not required. The source of these thermal stresses is a restriction on the dimensional expansion and/or contraction that would normally occur in a structural member when temperature varies. According to the coefficient of thermal expansion and the modulus of elasticity E, the magnitude of a thermal stress generated by a temperature change  T is determined by the coefficient of thermal expansion and the modulus of elasticity E.

Corrosion fatigue is a kind of failure caused by the combined action of cyclic stress and chemical attack. Corrosive surroundings have a negative impact and result in a lower fatigue life. The fatigue behavior of various materials is affected by even the usual ambient environment. As a result of chemical reactions between the environment and the material, small pits can form, which serve as stress concentration areas and thus crack nucleation sites.
Key Takeaway
Under cyclic loading, fatigue failure is characterized as a time-delayed fracture. Transmission shafts, connecting rods, gears, vehicle suspension springs, and ball bearings are all examples of parts that are prone to fatigue failure Affects 90% of component Surface flaws, Notches, keyways, screw threads increases stress concentration and leads to fatigue failure, The fatigue strength is great at low temperatures and gradually diminishes as the temperature rises. Corrosive Environment also reduces Fatigue Strength
Fatigue limit is also called endurance limit (Se), It is limit below which infinite number of repetitive load cycles of completely reversed bending stress can be applied before causing any fatigue failure on new standard specimen.
The fatigue limit term is used for materials having distinct limit like ferrous alloys whereas fatigue strength term is used when material don’t have distinct limit and can even fail at small stress amplitude.
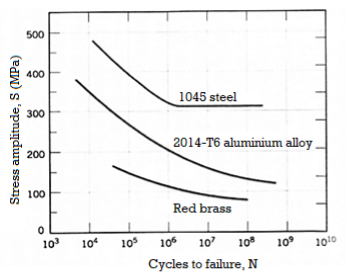
It's vital to understand that a material's Endurance Limit isn't an exact or entirely reproducible quantity. In reality, as shown in the S-N diagram below, numerous seemingly identical samples cut from neighboring sections of one bar of steel will exhibit various endurance limit values when tested.
![Figure 1. S−N curves for aluminium and low-carbon steel [1].](https://glossaread-contain.s3.ap-south-1.amazonaws.com/epub/1642700153_3929012.png)
Cycle to Failure The number of cycles a sample must go through before failing is known as the cycle to failure. The greater the load, the fewer the number of failure cycles. The cycles to failure are theoretically infinite if the stress is below the material's Endurance Limit.
Fatigue life N is another key metric that determines a material's fatigue behavior. The number of cycles required to cause failure at a given stress level, as shown by the S–N plot. To provide a suitable fatigue life, it is vital to keep the following points in mind during the design process:
- Modification of design to avoid stress concentration by removing sharp recesses and a severe stress raiser.
- Surface finish precision by avoiding surface damage from abrasive machining, punching, stamping, shearing, and other processes.
- Controlling corrosion, erosion, and chemical assault in the field, as well as avoiding surface decarburization during processing or heat treatment.
- Fatigue is fundamentally a surface-initiated process, therefore surface conditions are extremely critical. Furthermore, because fatigue is caused by slip, any structural condition that prevents slip would be beneficial for a long fatigue life.
Determination of Endurance Limit - Rotating Beam Fatigue Testing Apparatus
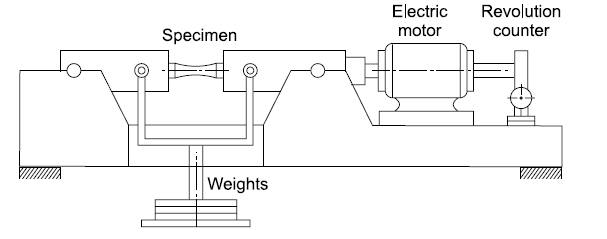
Pure bending is the most popular test loading for fatigue testing since it is simple to utilise. Collets are used to hold a circular specimen. The test specimen and the key elements of the testing machine are shown in the diagram. The test machine is powered by a 1000 rpm high-speed electrical motor. There is a huge bearing next to the motor that relieves the motor from the large bending moment given to the specimen. A spinning lever arm is attached to a collect, which is then connected to a tiny bearing. The bearing is subjected to a force, causing the specimen to bend. The specimen's upper surface will be in tension, while the lower surface will be compressed. The surface of the specimen is subjected to alternate tensile and compressive stresses because it is rotated by a motor. The machine's revolution counter reader records the number of cycles applied, and when the specimen breaks, the counter disengages automatically. The disengaging device is intended to bring the testing equipment to a halt. To determine a metal's fatigue limit, or endurance limit, a number of specimens that are representative of that metal must be prepared. The first metal specimen is subjected to a reasonably high stress, with the goal of failure occurring in a small number of stress applications. Other metal specimens are subjected to stress tests at a lower level than the preceding one. The life of the specimen rose as the stress value decreased. As the load lowers, the number of repetitions necessary to cause rupture, i.e. fracture, increases. The specimen will not burst if the stress is less than the endurance limit. The specimen's life is measured in the number of cycles necessary to reach maximum applied force failure. Fatigue test results are frequently represented on diagrams, with stress values plotted as ordinates and stress cycles for rupture plotted as abscissa. The curve is known as an S-N diagram, with S denoting stress and N denoting the number of cycles.
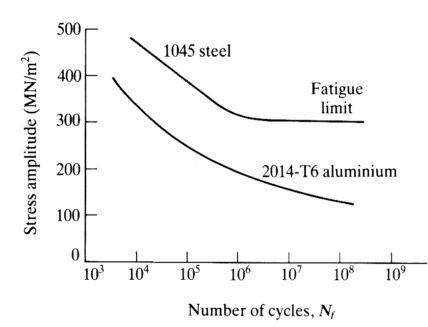
Semi logarithmic plotting, or plotting 'N' on a logarithmic scale, is used to create these diagrams. Engineers pay close attention to the shape of the S-N curve. At a certain tension, the curvature of metals such as mild steel and titanium becomes horizontal. The fatigue limit or endurance limit is the name given to this stress value.
Key Takeaway
Endurance limit is limit below which infinite number of repetitive load cycles of completely reversed bending stress can be applied before causing any fatigue failure
Materials having Distinct cut-off on SN curve have Endurance limits and those are more gradually have Endurance strength
Endurance Limit though being distinct doesn’t have any fixed value for each material and for same material of same component can have different fatigue limit but will lie in proximity to each other on SN curve
Fatigue properties of material are described by SN curve. It is also called has Wohler curve. SN curve is curve describe relation between cycle stress amplitude and number of cycles the specimen holds till failure Horizontal axis represents “No of cycle” in logarithmic scale; Vertical axis can either be in linear or logarithmic scale and can either represent “stress amplitude” or maximum stress SN curve are found out by fatigue testing carried out on metal coupon testing machine, in which small metal coupon is placed and cyclic stress with constant amplitude is applied till specimen fails or exceed large No of cycles (N>106 ) and results are interpreted infinite life.
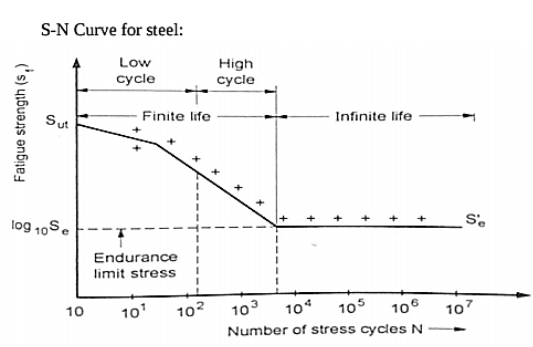
Regions of SN curve (Infinite, High cycle Fatigue, Low cycle Fatigue)
Infinite region
In this region, the stress levels are below a certain number and infinite no if cycles can be performed without causing fatigue failure. To determine if a component is operating in the infinite life region, the Goodman-Haigh diagram is often used. See in figure steel has distinct limit whereas metals like aluminum and other do not always have distinct limit.
Elastic region or High cycle fatigue Region
In this region, stress and strain exhibit linear relationship. After each load cycle, material returns to original shape. This region is also called High cycle fatigue region ( N = 103 to 106), because high number of stress cycles at low amplitude can cause material to fail. The fatigue occurring in this region is called High-CycleFatigue. Residual stresses and sharp counters in geometry can affect the failure of material, smooth geometry decreases crack initiation
Plastic Region or Low Cycle Fatigue
In this region material experience high stress and causes permanent change to shape of material. This region is also called as the “Low Cycle Fatigue” region (N ≤ 103) as a low number of stress cycles, with a high amplitude result in failure.
SN curve Slope (K factor)
The slope of the log-log SN-Curve is defined as “k-factor”. The relationship between stress and the number of cycles to failure is governed by this "k-factor.". Wohler has developed the k-factor to easily relate the load, stress to the life, number of cycles to failure. As this is log v/s log relationship, a small change in stress amplitude can cause very large change in the fatigue life This helps in increasing the speed of testing
Limits of the S-N Curve
The S-N method can be used in circumstances when all stresses, including local ones, are elastic. In practice, this means that the S-N curve should be limited to numbers bigger than 10,000 cycles on the life axis.
Key Takeaway
- SN curve method only applicable to HCF region
- HCF (N = 103 to 106)
- LCF (N ≤ 103)
It has been discovered that the real drop in a material's endurance limit caused by stress concentration is smaller than the theoretical stress concentration factor indicates. K As a result, stress concentration factors are denoted by two different notations: Kf and Kt. Kt as established in earlier sections, is the theoretical stress concentration factor that applies to ideal homogeneous, isotropic, and elastic materials. The fatigue stress concentration factor, Kf, is defined as the ratio of the notch-free specimen's endurance limit to the notched specimen's endurance limit.
This factor Kf, which is dependent on the grain size of the material, is applicable to actual materials. Due to stress concentration, fine-grained materials' endurance limits are reduced more than coarse-grained materials.
The vulnerability of a material to succumb to the detrimental effects of stress rising notches in fatigue loading is known as notch sensitivity. The notch sensitivity factor q is calculated as the ratio of actual stress over nominal stress to theoretical stress over nominal stress.
The relation between all 3 parameter is given by

When material as no sensitivity to notches q=0,  and When material as fiull sensitivity to notches q=1,
Key Takeaway
The vulnerability of a material to succumb to the detrimental effects of stress rising notches in fatigue loading is known as notch sensitivity
The relation between fatigue stress concentration factor , theoretical stress concentration factor
  and notch sensitivity of material

When material as no sensitivity to notches q=0,  and When material as full sensitivity to notches q=1,
Due to a variety of circumstances, the endurance limit of a component differs from the endurance limit of a rotating beam specimen. The difference emerges because the rotating beam specimen has standard specifications and operating conditions, whereas the actual components have varied specifications and operate under variable conditions. In practice, other modifying factors are applied to adjust for this discrepancy. These are sometimes referred to as derating factors. Derating factors are used to 'derate,' or reduce, a spinning beam specimen's endurance limit to fit the actual component.
- Ka is the coefficient of surface finish.
- Kb is the size factor.
- Ke reliability Factor
- Kd is modifying factor to account for stress concentration

Surface finish
For the surface finish factor, Shigley and Mischke proposed an exponential equation. This equation is based on Noll and Lipson's experimental data points.
K= a(Sut)b
Table shows the values of coefficients a and b for various factors
Surface finish | a | b |
Ground | 1.58 | -0.085 |
Machined or cold-Drawn | 4.51 | -0.265 |
Hot-rolled | 57.7 | -0.718 |
Forged | 272 | -0.995 |
The above-mentioned surface finish factor values have only been developed for steel components. Components made of other ductile materials, such as aluminium alloys, should not be used. For standard grey cast iron components, the surface finish factor is set to 1.
Size Factor
The larger the machine part, the more likely there is a fault somewhere in the component. Any one of these problems has a higher likelihood of causing fatigue failure. When a result, as the component's size grows larger, the endurance limit decreases.
Diameter (mm)  | Kb |
<= 7.5 | 1 |
7.5 < d <= 50 | 0.85 |
d>50 | 0.75 |
Size factor according to loading
For the size factor, Shigley and Mischke proposed an exponential equation. The following is the equation for bending and torsion:
- For 2.79 mm
 d < 51 mm
K= 1.24 d-0.107
- For 51 mm < d
 254 mm)
K = 0.859 -0.000 873d
- For axial loading
K1 = 1
The size factor for components with a non-circular cross-section is difficult to calculate. However, because the endurance limit is reduced in such components, an equivalent circular cross-section must be used to define effective diameter. This is where Kuguel's equality comes in handy. The rationale behind this equivalence is that fatigue failure is linked to the likelihood of high stress interacting with a discontinuity. When a big volume of material is subjected to severe stress, the likelihood of fatigue failure due to any fault in that volume increases. Kuguel considers a high stress volume to be a volume of material that has been stressed to 95 percent of its maximum stress or above.

For rectangle 

Reliability factor
In endurance limit testing, the standard deviation is 8% of the mean value. The reliability factor K. Is determined by the reliability employed in the component's design. The higher the probability of a part surviving, the higher the reliability and the lower the reliability factor. For 50 percent reliability, the reliability factor is one. This suggests that in the given set of circumstances, 50% of the components will survive. To ensure that more than half of the parts survive, the component's stress amplitude should be less than the endurance limit's calculated value. This reduction is accomplished through the usage of the reliability factor.
Reliability (%) |  |
50 | 1 |
90 | 0.897 |
95 | 0.865 |
99 | 0.814 |
99.9 | 0.753 |
99.99 | 0.702 |
99.999 | 0.659 |
Modifying factor to account for stress concentration
Due to stress concentration, the endurance limit is lowered. Because of the material's notch sensitivity, the stress concentration factor employed for cyclic loading is lower than the theoretical stress concentration factor. The designer can either reduce the endurance limit by (Kd) or raise the stress amplitude by (Kf) to apply the impact of stress concentration (Kt). To account for the effect of stress concentration, the modifying factor K is defined as,
Kd=1/Kf
Key Takeaway
The four parameters listed below are utilised to determine the component's actual endurance limit from theoretical limit.
- Ka is the coefficient of surface finish.
- Kb is the size factor.
- Ke reliability Factor
- Kd is modifying factor to account for stress concentration

In fatigue design, there are two sorts of issues: components subjected to totally reversed loads and components subjected to fluctuating stresses. In the event of entirely reversed stresses, the mean stress is 0. The stress distribution is made up of tensile stresses during the first half of the stress cycle and compressive stresses for the second half, with the stress cycle ending at zero.
The design difficulties for entirely reversed stresses are further separated into two categories: (i) infinite life design and (ii) finite life design.
Infinite life Design
The endurance limit is a failure criterion in infinite design. To resist an unlimited number of cycles, the amplitude stress caused in such components should be lower than the endurance limit. The following equations are used to create these components:

Where ( ) and (
 ) are component stress amplitudes and
 , and
, and  , respectively, are corrected endurance limits in reversed bending and torsion.
Finite life Design
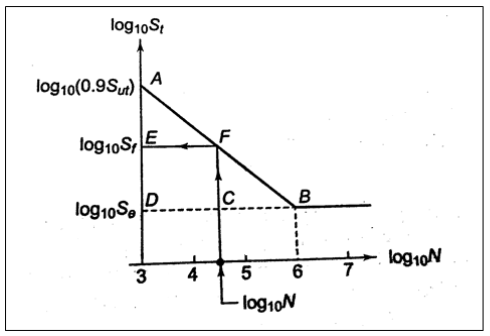
On a log-log paper, it consists of a straight-line AB drawn from (0.9 Sut) at 103 cycles to (Se) at 106 cycles. For such challenges, the design procedure is as follows:
- Find the point A with coordinates [3, log10 (0.95)], because log10(103) = 3.
- Find the point B with coordinates [6, log10 (S)], since log10(106) = 6
- Join AB, which is a failure condition for problems with finite lives.
- Draw a vertical line through log10 (N) on the abscissa, depending on the component's life N. At point F, this line crosses AB.
- Draw a line parallel to the abscissa FE. The ordinate at point E, i.e. log10 (S). Gives Sf which is used in design calculation
Key Takeaway
Design for entirely reversed stresses are further separated into two categories:
(i) Infinite life design
The endurance limit is a failure criterion in infinite design

(ii) Finite life design
Use SN Curve
In some applications, the mechanical component is subjected to varying degrees of stress throughout the work cycle. Miner's equation determines the life of such a component. Consider a component that has been subjected to entirely reversed stresses (σ1) for (n1) cycles, (σ2) for (n2) cycles, and so on. If only the alternating stress (σ 1) is acting, let N be the number of stress cycles before fatigue failure. Because there are n, such stress cycles at this stress level, the proportionate damage to fatigue life will be [(1/N1)n] or (n/N). Similarly, at stress level (02), the corresponding damage will be (n2/N2).

This is called miners equation. Let  be the proportions of total life consumed by
  then
then


Substituting values in above equation

Also 
Using above equation, the life of component can be found out
Key Takeaway
Using Following equation to find life of component


When a component is subjected to fluctuating stresses, mean stress and stress amplitude exist. The mean stress component is present in conjunction with an alternating component, it has been observed to have an effect on fatigue failure In the Fig. Below. The mean stress is plotted on the abscissa, while the stress amplitude is plotted on the ordinate in this diagram.
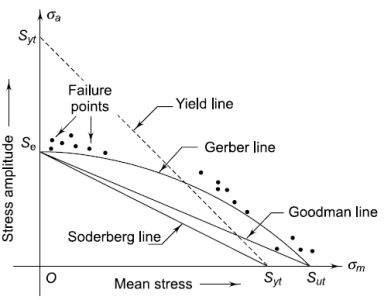
The magnitudes of maximum and minimum force acting on the component determine the magnitudes of mean stress and stress amplitude. The load is purely static when the stress amplitude is zero, and the criteria of failure are Sut or Syt. On the abscissa, these limitations are plotted. When the mean stress is zero, the stress is entirely reversed, and the endurance limit Se shown on the ordinate is the criterion of failure. When all components of stress are applied to the component, failure occurs at several distributed sites as illustrated in the diagram. For certain combinations of mean stress and stress amplitude, there is a border that separates the safe and risky regions.
Different criteria for constructing the borderline separating the safe zone and the failure zone have been offered. The Gerber, Soderberg, and Goodman lines are among them
- Gerber Line: A parabolic curve joining Se on the Y axis to Sut on the X axis is called the Gerber line.
- Soderberg Line: A straight line joining Se on the Y axis to Syt on the X axis is called the Soderberg line.
- Goodman Line: A straight line joining Se on the Y axis to Sut on the X axis is called the Goodman line.
When a component is subjected to both, mean and amplitude stress, the Goodman line is commonly employed as criteria for fatigue failure. The following are the reasons for this:
- Because it is totally within the failure points of test data, the Goodman line is immune to design considerations.
- When compared to the equation of a parabolic curve, the equation of a straight line is straightforward and easy to calculate
- A scale diagram is not required, and a rough sketch will suffice to create a fatigue diagram.
Equation for line in intercept form is 
By substituting values of stress from above figure Soderberg equation would be 
The Goodman line would be 
Modified Goodman line
By Combining fatigue failure with yielding failure, Goodman line is modified. The modified Goodman diagram is used to design the components that are subjected to fluctuating stresses.
- Modified Goodman line for Components subjected to fluctuating axial or bending stresses
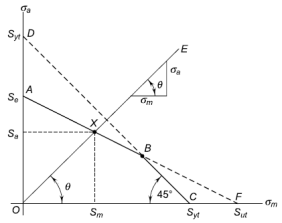
A line OE with a slope of tan is constructed in such a way that,


The magnitude for Pm and Pa are determined by maximum and minimum forces acting on the component
Similarly,  can be proved, where (Mb)a and (Mb)m determined by maximum and minimum bending moment acting on the component
In figure above, X is the location where lines AB and OE intersect.
The dividing line between the safe and failure regions is marked by the letter X. The coordinates of the point X (Sm, Sa) represent the stresses' limiting values, which are utilized to compute the component's dimensions. The following are the allowed stresses:

2. Modified Goodman line for Components subjected to fluctuating torsional shear stresses.
On the abscissa, the torsional mean stress is displayed, while the torsional stress amplitude is plotted on the ordinate. On the abscissa, the torsional yield strength Ssy is displayed, and a yield line is drawn at 45 ° to the abscissa. B is the location where this line and the yield line connect. In this scenario, the OABC area symbolizes the safe zone.
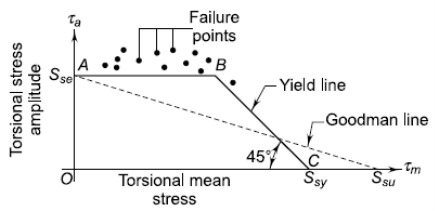
The fatigue failure is indicated if,

The static failure is indicated if

Where,


Key Takeaway
The mean stress effects the fatigue life, safe zones and failure zones are created which are separated by different criteria which are represented as the line on diagrams
- A parabolic curve joining Se on the Y axis to Sut on the on X axis is called as Gerber line.
- A straight line joining Se on the Y axis to Syt on the X axis is called the Soderberg line.
- A straight line joining Se on the Y axis to Sut on the X axis is called the Goodman line.
- The Goodman line is modified by combining fatigue and yielding Failure.
Modified Goodman line for Components subjected to fluctuating axial or bending stresses is

Modified Goodman line for Components subjected to fluctuating torsional shear stresses 

In fact, because the component may be subjected to two-dimensional stresses or coupled bending and torsional moments, the difficulties are more complicated. Each of the two stresses in the case of two-dimensional stresses may have two components: mean and alternating. Similarly, the mean and alternating components of the bending and torsional moments may exist. The distortion energy theory of failure solves such situations involving multiple stresses. The distortion energy theory's most general equation is as follows:

In case of 2 Dimensions

The mean and alternating stresses are 


 are obtained by Modified Goodman Diagram
In case of Torsional stresses
From Eqn(a) for 2D y and z components zero

The mean and alternating stresses are 


 are obtained by Modified Goodman Diagram
Key Takeaway
To solve problem from Modified Goodman Diagram, obtain 
Use following equation to finf bending and torsional combined stresses


References:
- Design of Machine Element VB Bhandari
- Machine Design RS Khurmi, JK Gupta