Unit - 5
Mass Transfer
The transport of a material (mass) in liquid and gaseous mediums is known as mass transfer. Four main types of mass transfer are distinguished based on the conditions, nature, and forces involved for mass transfer: (1) diffusion in a quiescent medium, (2) mass transfer in laminar flow, (3) mass transfer in turbulent flow, and (4) mass exchange between phases.
The most basic scenario is mass transfer in a resting media, where the driving force is a difference in concentrations between adjacent parts of the medium and the mechanism is molecular diffusion. Because of the statistical nature of molecule motion, the material flows from a high concentration location to a low concentration one, tending to equalise concentration throughout the volume. This mass transfer is represented by Fick's law, which has the following form when applied to a binary mixture:

Where is the flow of substance A, kg/m2s, in the opposite direction to its concentration gradient dCA/dy (kmole/m3m), is the molecular weight of component A (kg/kmole), and DAB (m2/s) is the interdiffusion coefficient of substance A in substance B, and is determined by the physical properties of these substances. DAB has been computed using a molecular-kinetic theory and has been determined experimentally for numerous gas pairings. Temperature and pressure are known to affect DAB. The diffusion coefficient in gases is on the order of 104 m2/s under typical conditions, while it is around five orders lower in liquids (see Diffusion and Diffusion Coefficient for more details).
Temperature and pressure gradients, which affect mass transfer via thermal and pressure diffusion, may also come into play in addition to concentration gradients. These effects are most noticeable in gas combinations with a wide range of molecule sizes, such as He—Cs. One of the methods for separating the uranium isotope U235 is thermal diffusion.
Calculating mass transfer in laminar flow of gaseous and liquid mixtures is not particularly difficult. For example, the set of Equations (2) defining the velocity and concentration fields for a plate in a stream of incompressible liquid takes the form
 (2)
(2)


Where x and y are the longitudinal and transverse coordinates, u and v are the longitudinal and transverse components of velocity, v and D are the kinematic viscosity and molecular diffusion coefficients, respectively, and C is the substance's local concentration, C = f (x, y).
Under the boundary conditions  =
=  = 0 and C = C1, at y = 0,
  =
=  and C = C0 at x < 0 or y = ∞ the solution to equation system (2) yields
 (3)
(3)
Where β is the local mass transfer coefficient at the distance x from the leading edge of the plate (β = [  /
/  (C1 - C0)], Rex = x
  /ν is the Reynolds number, and Sc = ν/D the Schmidt number. Note that there is a departure from the linear dependence of
  or (C1 - C0) at high rates of mass transfer.
If the plate's total length is L, the length-averaged mass transfer coefficient can be calculated using the equation.
 (4)
(4)
Where ReL = Lu0/ν.
In the shift to a turbulent flow, mass transport fundamentally changes. Its vortex flow features result in large-scale fluid transfer. This transport typically has orders of magnitude larger rates than molecular transport, allowing for faster equalisation of the concentration field and, in the case of a drug source, rapid propagation of the substance over the flow cross section. Due to the lack of a rigorous theory of turbulence, it is preferable to describe the flow and heat and mass transfer in it using a set of equations similar to (2) for laminar flow using averaged velocity values and replacing v and D with their effective values conforming to the conditions in the turbulent flow, i.e., the coefficients of "eddy viscosity" and "turbulent diffusion" (see Diffusion and Diffusion Coefficient). In turbulent flow, such as between and inside eddies, molecular diffusion also occurs. As the channel surface is approached, its role is amplified (in comparison to turbulent transport) and it becomes dominating near it. The molecular DM and turbulent DT diffusion coefficients are typically assumed to be additive, i.e., D = DM + DT.
Because material, energy, and momentum are transported by large-scale eddies in a developed turbulent flow, the transport rate is regarded identical, and DT, aT, and vT are roughly equal. (This is a triple analogy between matter, energy, and momentum transmission.) This allows mass transfer to be calculated using empirical dimensionless equations describing heat transfer.
In engineering, mass exchange between a gas and a droplet is a regular occurrence. The solution for a medium at rest can be written as follows:
 (5)
(5)
Where M is the mass transfer coefficient, D is the diffusion coefficient of the exchanged material in the gas, and dd is the droplet diameter. The Frössling-Marshall formula is used when the drop moves with regard to a medium in the Red 200 range.
 (6)
(6)
(Where Red = dpu/v, where u and v are the gas kinematic viscosity and velocity relative to the drop, respectively) is highly consistent with the experiment. This formula also remains true in the case of droplet evaporation in a gas stream, as long as the evaporation rate is low or moderate.
An empirical formula can be used to compute the rate of mass transfer from the surface of a liquid film (e.g., evaporation) flowing on the inner surface of the tube toward the central gas flow.
 (7)
(7)
Where d denotes the tube diameter (see Nu = 0.023 for heat transfer).
Diffusion of a substance, such as A, from one moving medium to another over an interface is another example of mass transfer (two-film theory). If there is no concentration jump at the border, CABi = CAEi (Fig. 1a), then the flow of substance A can be described in the following way.


Where AB, AE, and KA are the mass transfer coefficients for substance A in media B and E, respectively, and the overall mass transfer coefficient, and CA is the concentration of substance A at the sites shown in Figure.
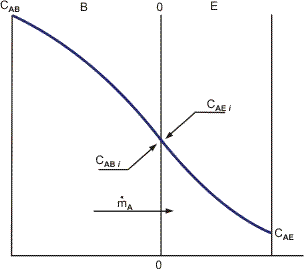
Figure. Mass transfer of component A between media B and E with no concentration jump at the interface.
Hence,
(9)

i.e., total mass transfer resistance is the sum of resistances in each medium.
The concentrations of the transferring chemical at the interface in the two media are not always identical. For example, if B is a liquid phase and E is a gas, and a boundary equilibrium obeys Henry's rule CABi = H CABi (Figure),


Whence
 (11)
(11)
Given the flow parameters for both films, can be calculated using, for example, the methods above.
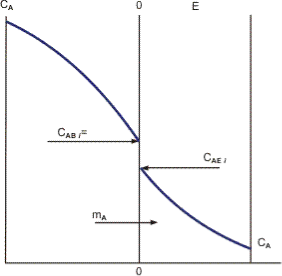
Figure. Mass transfer of component A between media B and E with a concentration jump at the interface.
Mass transfer is widely used in industry, including chemical process equipment, metallurgy, and power engineering, among other applications. Fractionating towers, absorbers and extractors, driers and cooling towers, combustion chambers, heterogeneous catalysis devices, and other items are among the equipment used.
Nature and engineering practise are both full with mass transportation processes. There are innumerable examples that might fill a whole book on their own. This section offers a few instances as well as questions that an engineer might ask in order to better understand or create these processes. As the contents of this book unfold, we will be able to address these questions, as well as possibly raise new ones. The study and modelling of mass transfer processes (the major purpose of this book) is broadly applicable in many domains, as you will see from these examples. After finishing this book, you will be well prepared to face difficulties in your chosen engineering career and will be in a good position to do research and improve this field.
5.2.1 Reacting Systems
Chemical processing frequently involves heterogeneous reactions. These systems have two or more phases, with the reaction occurring mostly in one of them and the reactants typically present in the other. As a result, mass transfer from one phase to the other is a requirement for reaction to occur. This linkage of mass transfer and reaction has a number of intriguing implications, which are explored in greater depth in Part II of the book. Table 1.3 shows a simplified classification of heterogeneous reacting systems based on the kind and number of phases touched (along with one example for each case). Most reaction engineering texts have parts on heterogeneous reactions, and they explore this topic to varied degrees (e.g., Levenspiel, 1974). Doraiswamy and Sharma (1984) published an exhaustive (nearly encyclopaedic) treatise on heterogeneous reactions that is a great reference book.
Table. Examples of Heterogeneous Reactions Based on the Phases Being Contacted
Phases Contacted | Example |
Gas + solid catalyst | Oxidation of ethylene |
Gas + solid reactant | Combustion of coal |
Gas–liquid | Removal of CO2 by reactive solvent |
Liquid–liquid | Biodiesel production |
Gas–liquid + solid catalyst | Removal of sulfur compounds from diesel |
Gas–liquid + solid reactant | Carbonation of lime |
Gas–liquid–liquid | Production of hydroxylamine from nitrobenzene |
Here are two instances of reacting systems in which mass transfer plays a crucial role. In Part II, we'll look at several more cases.
Catalytic Converter
A vehicle is a common example of mass transfer accompanied with reaction. A catalytic converter is made up of a series of flow channels that are coated with an active catalyst layer, such as platinum (Pt). This is an example of a flow system that includes mass transfer and a chemical reaction to reduce pollutant emissions like CO and NOx. The amount of pollutant removed is determined by the gas flow rate, temperature, mass transfer rate to the catalytic surface, and reaction rate at the surface itself. A mass transfer analysis can be performed to calculate the overall rate of reaction and design the converter. These models can also be used to determine the system's dynamic response and the level of pollutant removal during the initial cold start period (when the converter is cold).
Trickle Bed Reactor
A three-phase reactor (gas–liquid–solid catalyst) is an example of a trickling bed reactor. It’s similar to the packed column utilised in gas absorption unit operations. Gas and liquid pass over a packed catalytic bed, where a reaction takes place on the catalyst’s surface. The reactor contains three phases: gas, liquid, and solid catalyst. In the chemical and petroleum industries, such reactors are commonly utilised. They’re used to remove sulphur compounds from diesel, for example, in a reactor that includes three phases: hydrogen, diesel, and a cobalt–molybdenum (Co-Mo)-based catalyst. Because of the trickle bed reactor, today’s urban air is often cleaner. The book by Ramachandran and Chaudhari (1983), which covers the many types of three-phase catalytic reactors in depth, is a good place to start.
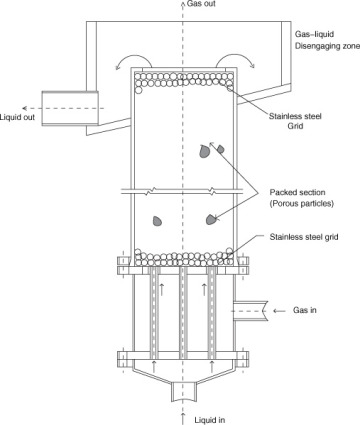
Figure A trickling bed reactor in which species in the gas phase (e.g., hydrogen) are mass transferred to the liquid and subsequently to the catalyst’s surface, followed by a surface reaction on the catalyst with a second species diffusing from the liquid. (An operation with both phases up flow is depicted below.)
5.2.2 Unit Operations
A unified examination of a particular separation technology utilised for a chemical engineering application is termed as a unit operation. The vapour pressure variations between two components are utilised to separate and purify these components in distillation. The unit operation technique assumes that whether you're distilling a crude oil combination or manufacturing brandy, the analysis is the same. Table 1.4 lists the most common mass transfer–based separation techniques. All of these separations rely on interfacial mass transfer; thus, mass transport effects must be analysed and modelled before such systems can be designed.
Table Common Mass Transfer–Based Separation Processes and the Phases Being Contacted
Phase 1 | Phase 2 | Operation |
Vapor | Liquid | Distillation |
Gas | Liquid | Absorption |
Liquid | Gas | Stripping |
Liquid | Liquid | Extraction |
Gas | Solid | Adsorption |
Liquid | Solid | Adsorption |
Wet solid | Gas | Drying |
Liquid–liquid extraction is an example of a unit operation. We'll use this unit as a prototype for modelling stage contactors, as demonstrated in the schematic of a simple single-stage extraction unit. Two phases are intimately combined in the mixer part of the contactor to produce an emulsion or dispersion that promotes a high rate of mass transfer in this unit activity. In the settler portion, the two-phase mixture is allowed to settle, and the enriched solvent and lean solutions are separated. One of the goals of the mass transfer calculation is to determine the degree of mass transfer that can be achieved for a given rate of agitation.
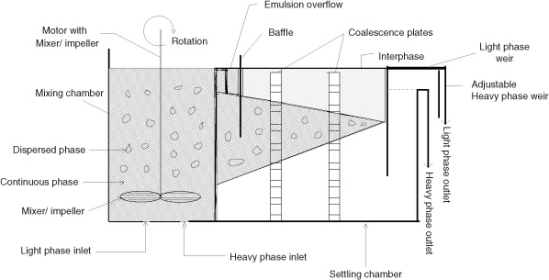
A single-stage mixer-settler used in liquid–liquid extraction is shown schematically.
Because a single-stage contactor can only achieve a limited degree of separation, a multistage cascade is used, with the lean solution being treated with fresh or recycled solvent. A designer can be curious as to how many phases are required to reach a specific level of purity. The answer is obtained by modelling such a multistage cascade.
The application of mass transfer principles to the design of some of the many unit operations described in Table is covered in Part III of the book. The basic concept is that the modelling methodology is universal across all unit operations and may be approached in a unified manner. As a result, the many characteristics of each unit functioning, while significant in and of itself, can be grouped together under the umbrella of mass transfer process modelling. Seader, Henley, and Roper (2011) provide a detailed examination of the numerous operations as well as significant insights into separation process concepts.
5.2.3 Bioseparations
Bioseparation is the separation of products produced by biological reactions; a common example is the separation of products from a fermentation broth. When compared to traditional separations used in the bulk chemical and petroleum industries, these techniques have a variety of unique characteristics. The chemical industry's main workhorse is distillation, however due to the heat-sensitive nature of bioproducts, several other separation procedures are required. Because the product may degrade or react further, rapid extraction may be necessary (e.g., in penicillin separation). The chemicals may be present in low amounts in many circumstances. Because the target component to be isolated may have properties that are similar to those of the other compounds in the broth, new separation technologies are required. Extraction, adsorption, chromatography, and electrophoresis are common techniques, and mass transfer analysis is utilised to represent these scenarios in later chapters.
This field is well-introduced in Harrison, Todd, Rudge, and Petrides' (2003) book. Seader et al. (2011) offers a lot of material on this subject in their book. Harrison (2014) gives an introductory reading in a review article, emphasising the significance of learning basic principles and theory as a prerequisite to designing and controlling the purity of bioprocessing products.
5.2.4 Semiconductor and Solar Devices
The heart of your computer is a silicon chip, but the electronic activity is due to phosphorus, boron, or other dopants being incorporated into the chip through a diffusion process. n-type semiconductors are doped with group V metals, whereas p-type semiconductors are doped with group III metals. Contacting these two types of semiconductors forms a junction, which operates as a diode or transistor. The electrical behaviour of such systems is determined by electron transport from the n to p side and hole transport from the p to n side, as well as recombination. This system can easily be extended to the diffusion-reaction analysis provided in Chapter 18 for porous catalysts.
Chemical vapour deposition is used in a number of processing processes in this sector, in which a species (precursor) is carried from a vapour, interacts, and creates a deposit or film on a (substrate) surface. This process involves mass transport of reactants, with the rate of transport influencing the characteristics of the deposited substance. Another example of mass transfer in the production of metal oxide semiconductor (MOS) devices is the oxidation of silicon to generate an insulating layer. Middleman and Hochberg's book from 1993 is a classic in this field and a must-read for students interested in becoming engaged.
5.2.5 Biomedical Applications
The goal of mass transfer analysis in biomedical engineering is to combine transport model fundamentals with life science concepts. The following are some of the key areas in which mass transportation phenomena can be used:
- Tissue engineering, including the production of artificial organs
- Pharmacokinetics analysis, distribution, and metabolism of pharmaceuticals in the body
- Understanding of oxygen transport in the lungs and tissues
- Creating assistive gadgets like dialysis machines
In Chapter 23 of this book, certain application examples are briefly explained. Lightfoot's (1974) early work, as well as more contemporary volumes by Sharma (2010), Truskey, Yuan, and Katz (2004), and Fournier (2011), are examples of mass transportation applications in this discipline.
5.2.6 Application to Metallurgy and Metal Winning
In metallurgy and metal winning, models and analyses of transport processes are commonly employed. In this topic, books like Szekely and Themelis (1991) and Geiger and Poirier (1998) give a variety of applications. Mass transport concepts are required in applications such as ore smelting in a blast furnace, gas–solid reactions in steel and copper production, and alloy creation by melt drop solidification. Metal winning (e.g., copper) is another use of electrochemical processes, in which transport of copper ions to the cathode is a critical phase in the whole process.
5.2.7 Product Development and Product Engineering
The use of transportation phenomena in product development is becoming more common. Designing medication capsules with a steady release rate and designing polymer wrapping in food packaging to reduce oxygen diffusion are two examples of applications. Cussler and Moggridge's book (2001) is a good place to start if you want to learn more about this topic.
A capsule is used to demonstrate medication release. In this situation, if the drug is at a constant concentration inside the capsule, the release rate peaks at first and then gradually falls. A (almost) constant rate, such as that indicated in the image, is ideal. The use of transient mass diffusion concepts in the design of the capsule's pore structure to produce this type of constant release rate is an essential application.
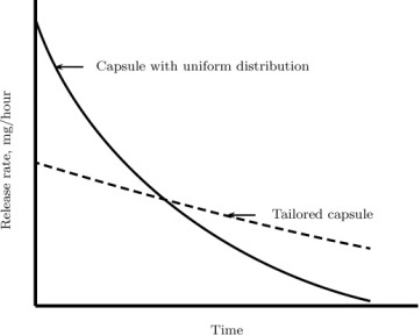
An example of a product design application. For a medicine having both a uniform distribution and a customised capsule, the drug release rate is shown.
5.2.8 Electrochemical Processes
Batteries, solar cells, electro-deposition, thin films, and microfluidic devices are just a few of the uses for electrochemical processes. Principles of transportation phenomena are increasingly being employed to create and improve these types of devices. Newman and Thomas-book Alyea's on the subject, Newman and Thomas-Alyea (2004), is an excellent resource.
In the energy sector, better batteries for electric cars are needed to store solar energy generated during off-peak hours. The lithium-ion battery depicted is a common type of battery. Li ions are transferred across the electrolyte that separates the cathode and anode at this point. Li ions are transported and stored in the carbon matrix during the charging cycle. During the discharging cycle, transport occurs in the reverse direction, resulting in Li storage in the metal oxide matrix. In order to simulate the performance of this device, mass transport issues must be taken into account.
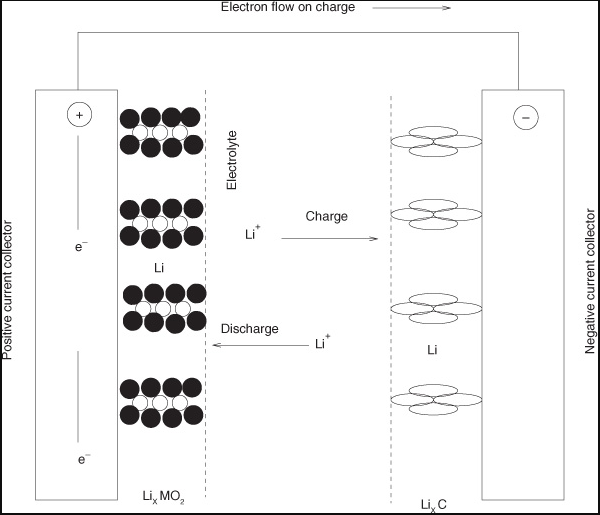
A diagram of a lithium-ion battery illustrating the numerous mass transfer and reaction phases that occur in the device. During the discharge cycle, lithium ions trapped in the carbon "hotels" are freed and diffuse through the electrolyte to the cathode, where they react with the metal oxide matrix. A current is created in the external circuit as a result of this.
5.2.9 Environmental Applications
Principles and modelling of transport phenomena have found widespread use in environmental engineering, where they provide a fresh perspective and innovative method. The following are some examples of environmental issues that can be handled utilising the transport modelling methodology:
• To simulate fate and contaminant movement in the atmosphere, divide the system into four or more compartments (air, water, soil, and biota) and analyse transit and reaction in each compartment.
• Another example is groundwater transport. Contaminants leaking from nuclear waste tanks into rivers could be a serious issue, and some of these scenarios can be examined using transport models to determine the rate of leakage and the necessary mitigation measures.
• Eutrophication occurs when extra nutrients are transported to water bodies, resulting in algal development and the extinction of other creatures. Further remediation actions will be determined by the pace of travel in such systems.
• Carbon dioxide sequestration in underground mines is being considered as a means of reducing global warming's impact. To forecast leakage and the solution's long-term viability, a mass transfer study is required.
Pure substances and mixtures are the two broad categories in which matter can be categorised. A pure substance is a type of matter with a consistent composition (that is, it is the same everywhere) and qualities throughout the sample (meaning that there is only one set of properties such as melting point, color, boiling point, etc. throughout the matter). A mixture is a material made up of two or more ingredients. Pure substances include both elements and compounds. An element is a substance that cannot be broken down into chemically simpler components. Aluminium is a chemical element that is found in soda cans. A compound is a substance that can be broken down into chemically simpler components (due to the presence of more than one element). Water, for example, is a substance made up of the element’s hydrogen and oxygen. In today's universe, there are approximately 118 elements. Scientists, on the other hand, have discovered tens of millions of distinct chemicals to date.
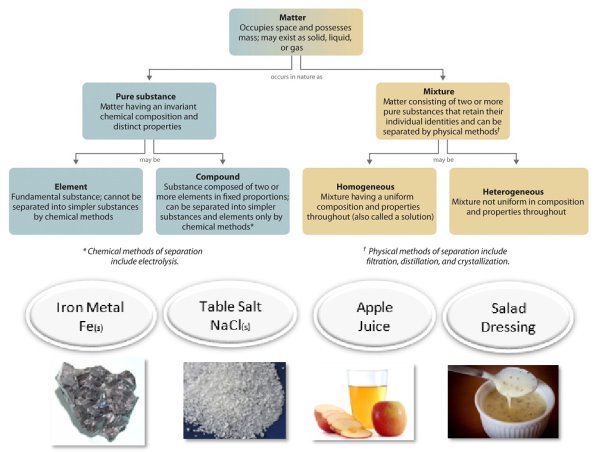 Figure: Relationships between the Types of Matter and the Methods Used to Separate Mixtures
Sodium chloride is the chemical name for common table salt. Because it has a consistent and distinct makeup, it is classified as a material. Chemically, all sodium chloride samples are identical. Water is a pure substance as well. Although salt dissolves readily in water, salt water cannot be classed as a material due to its variable composition. A tiny bit of salt or a large amount of salt can be dissolved in the same amount of water. A mixture is a physical mixing of two or more components, each of which retains its own identity and attributes. When salt is dissolved in water, just the shape of the salt changes. It hasn't changed in terms of composition or qualities.
A homogeneous mixture is one in which the chemical composition is consistent throughout. Because the dissolved salt is evenly distributed throughout the whole salt water sample, the salt water described above is homogenous. Because they are both uniform, it is common to confuse a homogenous mixture with a pure substance. The difference is that the substance's makeup is always the same. The amount of salt in the salt water varies depending on the sample. Because the dissolved substance is present in the same amount throughout the solution, all solutions are termed homogenous.
A heterogeneous mixture is one in which the composition varies from one part to the next. Vegetable soup is a diverse mix of ingredients. Each mouthful of soup will contain differing proportions of the soup's various veggies and other ingredients.
A phase diagram is a sort of chart used in physical chemistry, engineering, mineralogy, and materials science to depict the parameters (pressure, temperature, volume, and so on) at which thermodynamically distinct phases (such as solid, liquid, or gaseous states) occur and coexist at equilibrium.
Overview
Lines of equilibrium or phase boundaries, which refer to lines that denote conditions under which various phases can coexist at equilibrium, are common components of a phase diagram. Phase transitions happen along equilibrium lines. Metastable phases, despite their ubiquitous occurrence, are not indicated in phase diagrams since they are not equilibrium phases.
On phase diagrams, triple points occur where lines of equilibrium intersect. The term "triple point" refers to a situation in which three distinct phases can coexist. The water phase diagram, for example, has a triple point, which corresponds to the single temperature and pressure at which solid, liquid, and gaseous water can coexist in stable equilibrium (273.16 K and a partial vapour pressure of 611.657 Pa).
The solidus is the lowest temperature at which a substance will remain solid. The liquidus is the temperature at which a substance remains liquid at all times. There may be a gap between the solidus and the liquidus; the substance within the gap is a mixture of crystals and liquid (like a "slurry").
The shape of a working fluid's phase diagram is frequently used to classify it.
Types
2-dimensional diagrams
Pressure vs temperature
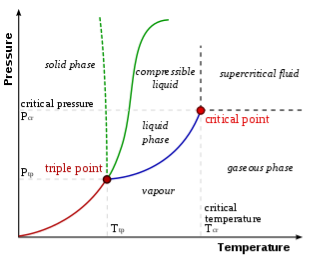
An example of a phase diagram. The solid green line depicts most substances; the dotted green line depicts water's peculiar behaviour. The freezing point is indicated by the green line, while the boiling point is indicated by the blue line, both of which fluctuate with pressure.
Pressure–temperature diagrams of a single basic substance, such as water, are the simplest phase diagrams. Pressure and temperature are represented by the axes. The phase diagram depicts the lines of equilibrium or phase boundaries between the three phases of solid, liquid, and gas in pressure–temperature space.
The arcs on the phase diagram depict the locations at which the free energy (and other derived properties) become non-analytic: their derivatives with respect to the coordinates (in this case, temperature and pressure) change rapidly (abruptly). When a container packed with ice is heated past the melting point, the heat capacity of the container changes abruptly. Single phase areas relate to open spaces where the free energy is analytic. Single phase regions are divided by non-analytical behaviour lines, which are known as phase borders, when phase transitions occur.
The phase barrier between liquid and gas does not continue endlessly in the diagram on the right. Instead, it comes to a halt at the crucial point on the phase diagram. This reflects the fact that, in a supercritical fluid, the liquid and gaseous phases become indistinguishable at extremely high temperatures and pressures. Tc = 647.096 K (373.946 °C), pc = 22.064 MPa (217.75 atm), and c = 356 kg/m3 are the critical points in water.
The occurrence of the liquid–gas critical point indicates a little discrepancy in the single-phase region labelling. When transitioning from the liquid to the gaseous phase, one generally crosses the phase barrier; however, by travelling to the right of the critical point, one can avoid crossing the boundary. As a result, the liquid and gaseous phases can continually mix. If the solid and liquid phases have the same symmetry group, the solid–liquid phase boundary can only end in a critical point.
The solid–liquid phase boundary (or fusion curve) in the phase diagram has a positive slope for most substances, indicating that the melting point rises with pressure. When the solid phase is denser than the liquid phase, this is true. The closer the molecules of a substance are brought to each other as the pressure on the substance increases, the greater the effect of the substance's intermolecular forces. As a result, the substance needs a greater temperature in order for its molecules to have enough energy to break free from the solid phase's established pattern and enter the liquid phase. Liquid–gas phase transitions follow a similar logic.
Water is an exception, as it possesses a negative-slope solid-liquid border, meaning its melting point drops as pressure increases. This happens because ice (solid water) has a lower density than liquid water, as seen by its ability to float atop water. Ice is less dense at the molecular level because it contains a larger network of hydrogen bonds, which necessitates a wider separation of water molecules. Antimony and bismuth are two more exceptions.
Liquid nitrogen undergoes a liquid-liquid phase transition to a polymeric form at pressures greater than 50 GPa (500 000 atm) and becomes denser than solid nitrogen at the same pressure. As a result, solid nitrogen floats in its liquid under these conditions.
The Clausius–Clapeyron equation for fusion (melting) gives the value of the slope dP/dT, where Hfus is the heat of fusion, which is always positive, and Vfus is the volume change for fusion. Vfus is positive for most compounds, hence the slope is positive. Vfus, on the other hand, is negative for water and other exceptions, resulting in a negative slope.
Other thermodynamic properties
Other thermodynamic parameters, in addition to temperature and pressure, can be graphed in phase diagrams. Particular volume, specific enthalpy, and specific entropy are examples of thermodynamic properties. To explain thermodynamic cycles like the Carnot cycle, Rankine cycle, or vapor-compression refrigeration cycle, single-component graphs of temperature vs. Specific entropy (T vs. s) for water/steam or a refrigerant are widely used.
On the horizontal and vertical axes of a two-dimensional diagram, any two thermodynamic quantities can be displayed. Additional thermodynamic quantities can be depicted as a succession of curved, straight, or a combination of curved and straight lines in increments. Each of these iso-lines represents a constant value of a thermodynamic quantity.
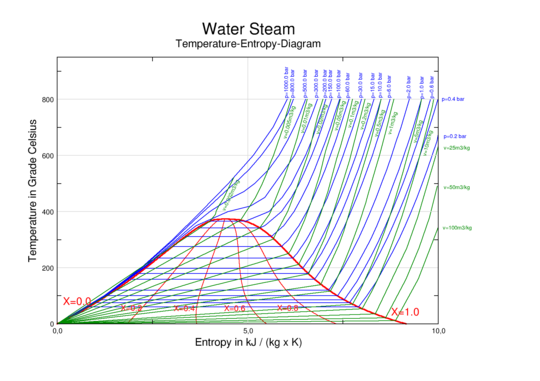
Water/steam phase diagram showing temperature vs. Specific entropy. Liquid water and steam live in perfect harmony beneath the red dome. At the very top of the dome, there is a vital point. To the left of the dome is liquid water. To the right of the dome is steam. Isobars (blue lines/curves) represent continuous pressure. Isochors (green lines/curves) exhibit constant specific volume. The quality is continuous throughout the red curves.
3-dimensional diagrams
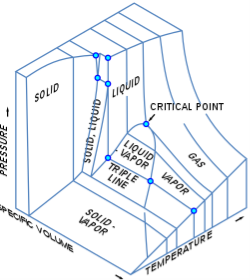
p–v–T 3D diagram for fixed amount of pure material
Three-dimensional (3D) graphs displaying three thermodynamic quantities can be imagined. A 3D Cartesian coordinate type graph, for example, can indicate temperature (T) on one axis, pressure (p) on a second axis, and particular volume (v) on a third axis for a single component. A p–v–T diagram is a type of three-dimensional graph. The equilibrium conditions are represented as curves on a curved surface in three dimensions, containing areas for the solid, liquid, and vapour phases, as well as areas where solid and liquid, solid and vapour, or liquid and vapour coexist in equilibrium. A triple line is a line on the surface where solid, liquid, and vapour can all coexist in equilibrium. Even on a 3D phase diagram, the critical point remains a point on the surface.
For water, the 3D p–v–T diagram is seen here:
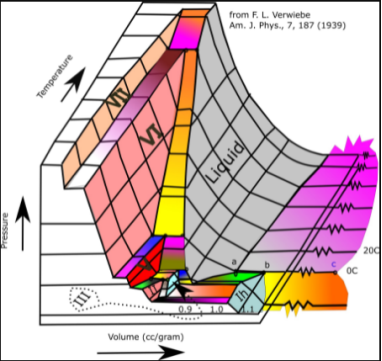
3D phase diagram of water fluids and selected ices
The 3D p–v–T graph, with pressure and temperature as the vertical and horizontal axes, is orthographically projected into a normal 2D pressure–temperature diagram. The solid–vapor, solid–liquid, and liquid–vapor surfaces then collapse into three curved lines that intersect at the triple point, which is the collapsed orthographic projection of the triple line.
Binary mixtures
When more than one pure component is present, other, far more complex types of phase diagrams can be created. In this instance, concentration becomes a crucial factor. More than two-dimensional phase diagrams can be made to depict the effect of several variables on the phase of a substance. Other variables, such as the strength of an applied electrical or magnetic field, can be used in phase diagrams in addition to or instead of temperature, pressure, and composition, and they can also involve substances that take on more than three states of matter.
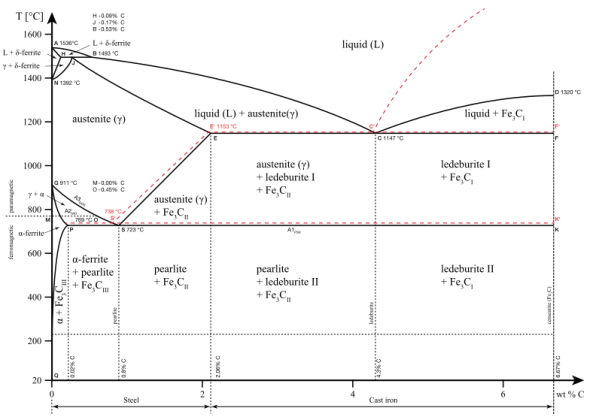
The phase diagram of iron–iron carbide (Fe–Fe3C). The phase of the iron carbon alloy is determined by the percentage of carbon present and the temperature, as well as its physical and mechanical properties. The amount of carbon in a ferrous alloy influence whether it is iron, steel, or cast iron.

A phase diagram for a binary system displaying a eutectic point.
Temperature is shown against the relative concentrations of two substances in a binary mixture in a binary phase diagram, as seen to the right. A solid solution, eutectic, or peritectic mixture, for example, can be created. The graphs produced by these two sorts of mixes are significantly different. A boiling-point diagram for a mixture of two components, such as chemical compounds, is another sort of binary phase diagram. A boiling-point diagram indicates what vapour (gas) compositions are in equilibrium with certain liquid compositions depending on temperature for two specific volatile components at a given pressure, such as atmospheric pressure. Temperature is plotted on a vertical axis, while mixture composition is plotted on a horizontal axis, in a standard binary boiling-point diagram.
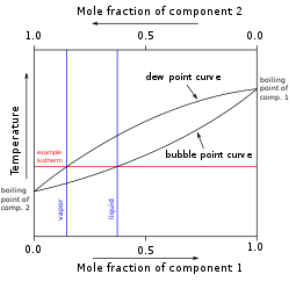
Boiling-point diagram
At right is a basic example diagram of hypothetical components 1 and 2 in a non-azeotropic combination. Because the boiling points of pure components are connected by two different curved lines, the vapour composition is rarely the same as the liquid composition with which the vapour is in equilibrium. For further information, see Vapor–liquid equilibrium.
There are thousands of different combinations of phase diagrams in addition to the ones shown above. Congruent spots, where a solid phase transitions straight into a liquid, are one of the most important aspects of phase diagrams. The peritectoid, a point where two solid phases unite to form one solid phase after cooling, is another option. The eutectoid is what happens when one solid phase changes into two solid phases after cooling.
The iron–carbon system for less than 7% carbon is a complex phase diagram of tremendous technological value (see steel).
The x-axis of such a diagram represents the mixture's concentration variable. The recommended concentration measure is mole fraction because the mixes are rarely dilute and their density as a function of temperature is rarely determined. It's not a good idea to use a volume-based metric like molarity.
Crystals
Multiple crystal or amorphous phases exist in polymorphic and polymorphic substances, which can be graphed in the same way that solid, liquid, and gas phases can.
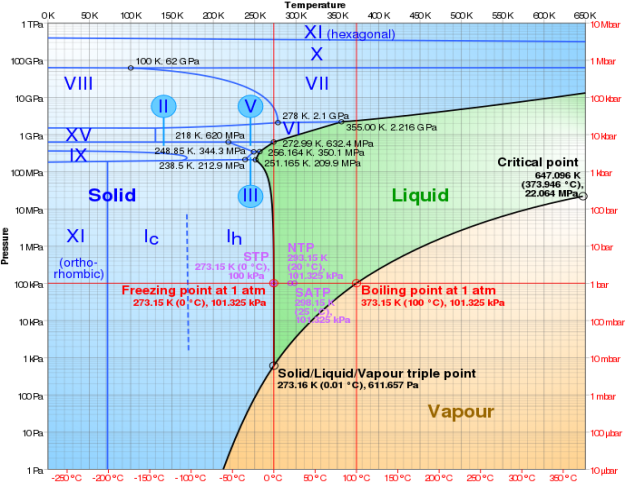
Water phase diagram with log-lin pressure–temperature. The Roman numbers represent different ice stages.
Mesophases
Mesophases are the transitional states between solid and liquid that some organic compounds go through. Mesophases have gotten a lot of attention since they enable display devices and have become commercially essential because to liquid-crystal technology. The presence of mesophases is depicted using phase diagrams.
Adolf Fick developed Fick's laws of diffusion in 1855 to characterise diffusion. They can be used to find the diffusion coefficient, and D. Fick's first law can be used to deduce his second law, which is the diffusion equation.
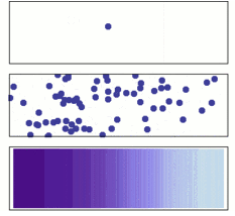
From a microscopic and macroscopic perspective, molecular diffusion. Solute molecules are initially found on the left side of a barrier (purple line) but not on the right. When the barrier is eliminated, the solute diffuses throughout the container, filling it completely. A single molecule travels about at random in the top image. Middle: As the number of molecules increases, there is a distinct tendency toward the solution filling the container more equally. Bottom: When a large number of solute molecules are present, randomization is undetectable: The solute appears to flow from high-concentration to low-concentration locations in a smooth and orderly manner. Fick's laws are the laws that characterise this smooth flow.
Fick's rules, created by Adolf Fick in the nineteenth century, provide the most basic description of diffusion:
1. Diffusion's molar flow is proportional to the concentration gradient.
2. The second derivative of concentration with space is proportional to the rate of change of concentration at a point in space.
Fick's First Law of Diffusion
Writing the first law in a modern mathematical form:

Where for species i, Ni is the molar flux (mol m-2 s-1), Di is the diffusion coefficient (m2 s-1), and ci is the concentration (mol m-3).
From the continuity equation for mass:

We can derive Fick's second law directly:

This is based on the assumption that Di is a constant, which is only true in dilute solutions. For diffusion in solids, diffusion of chemicals in a dilute solution, water, or other common liquid solvents, and diffusion of dilute (trace) species in the gas phase, such as carbon dioxide in air, this is usually a valid assumption.
Fick's Second Law of Diffusion
Fick's second law of diffusion is a linear equation with the concentration of the chemical species under investigation as the dependent variable. Each chemical species' diffusion occurs on its own. These characteristics make numerical simulations of mass transport systems described by Fick's second law simple.
When modelling diffusion, it's common to start by assuming that all diffusion coefficients are equal and independent of temperature, pressure, and other variables. This simplification assures that the mass transport equations in the modelled domain are linear, and it typically allows for more straightforward correlations to known analytical limitations. Once the behaviour of a system with all equal diffusion coefficients is thoroughly known, this assumption can be loosened.
According to a dimensional study of Fick's second law, there is a basic relationship between the elapsed time and the square of the length over which diffusion occurs in diffusive processes. For a precise numerical simulation of diffusion, it is critical to understand this relationship.
Diffusion of Multiple Components
The diffusion coefficient can no longer be viewed as constant or composition-independent for concentrated solutions or gas mixtures containing more than one chemical species in substantial mass fractions. The interactivity of the molecules of various species with one another is far too common for a physical description to neglect these inter-molecular connections. As a result, the diffusion coefficient is transformed into a tensor, and the diffusion equation is changed to connect the mass flux of a single chemical species to the concentration gradients of all chemical species present. The relevant equations are written as the Maxwell-Stefan diffusion description, which is commonly used to describe gas mixtures like syngas in a reactor or the mix of oxygen, nitrogen, and water in a fuel cell cathode.
The species mole or mass fractions (xi and I respectively) are the more perceptible dependent variables in Maxwell-Stefan diffusion than the species concentrations. These are limited in the following ways:

And related to the concentration and each other as:


Where Mi is the relative molar mass (kg mol-1) of species i.
Using multi-component diffusion coefficients Dik, the diffusive mass flux of each species is expressed based on the gradients of the mole or mass fractions. Because these are symmetric, parameterizing the rate of diffusion of an n-component system requires n(n-1)/2 independent coefficients. These quantities are frequently unknown for four-component or more complex combinations. To use the corresponding Fick's law diffusivity, simplifications can be made to the Maxwell-Stefan equations.
Diffusion is frequently used to solve issues with concentrated mixtures that need convection and momentum conservation (fluid flow).
Consider diffusion on an incremental planar volume's front and back surfaces. The rate of concentration buildup (or depletion) within a volume is proportional to the local curvature of the concentration gradient, according to Fick's 2nd law of diffusion. Fick's 2nd law of diffusion provides the local rule for accumulation:

The accumulation, dC/dt [cm-3 s-1], is proportional to the diffusivity [cm2/s] and the concentration's second derivative (or curvature), [cm-3 cm-2] or [cm-5]. When the curvature is positive, that is, when the concentration gradient is more negative on the front end of the planar volume and less negative on the back end, more flux is forced into the volume at the front end than out of the volume at the back end, the accumulation is positive.
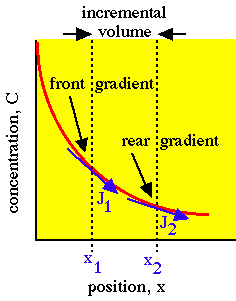
Incremental planar volume accumulates concentration because the front gradient at x1 drives more flux J1 into the volume than the flux J2 driven out of the volume by the rear gradient at x2.
Although the 1/c components introduced on both sides of the equation cancel, the differential equation for optical diffusion is simply Fick's 2nd law with the product cD for the diffusivity and F/c for the concentration C:

Que: The solution to the diffusion equation for a point source of strength M (per unit length) located at the origin x =0 in a one-dimensional system extending from x = −∞ to x = ∞ is

(a) Use this solution to write an equation for the diffusion from a point source initially located at position x =∆ in a semi-infinite one-dimensional system extending from x =0 to x = ∞. Hint: Solve this problem by superposing a second identical “image” point source of strength M located at position x = −∆ so that the symmetry plane at x =0 will be a plane of zero flux. See Fig.1below.
(b) Demonstrate that the solution you obtain from part (a) has zero flux at x =0 for all times.
Solution:
The solution requires that the point source expression be shifted to put the peak at the correct location, and that the principle of superposition be used to combine the source at x =∆ with the image source at x = −∆:


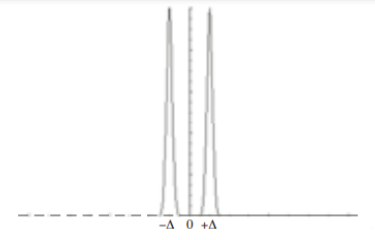
Figure: Image source at x = −∆.
b) To show that the flux is 0 at x =0 for all times it is necessary to show that

Evaluating this derivative at  gives
gives

Heat diffusion is easier to understand than mass diffusion. Two restricted conditions are linked to complications:
A temperature gradient, a pressure gradient, or an external force can all cause mass diffusion. We're presuming that these aren't present or are insignificant in this case. Ordinary diffusion is the term used when this is the case and the species concentration gradient is the primary driving potential.
2. The second constraint is that the fluxes must be assessed in relation to coordinates that move with the mixture's average velocity. Equations (9.1) and (9.2) are not generally applicable when a species' mass flux is described in terms of a given set of coordinates.
The proportionality factor D in Fick's law states that the mass of a substance dM diffusing in time dt over a surface dF normal to the diffusion direction is proportionate to its concentration gradient grad c: dM = D grad c dF dt. As a result, with a concentration gradient of unity, the diffusion coefficient suggests that the mass of the substance diffuses through a unit surface in a unit time. In the SI system, a square metre per second is the dimension of D.
The diffusion coefficient is a physical constant that is affected by temperature and pressure, as well as molecule size and other features of the diffusing substance. The coefficients of diffusion of one chemical into another are often determined experimentally and published in reference tables. Tables 1, 2, and 3 show instances of self-diffusion and interdiffusion (binary diffusion) coefficients in gaseous and liquid systems.
Table 1. Self-diffusion coefficient DA of some gases at T = 273 K and p = 0.1 MPa
Gas  Gas
Gas  Gas
Gas 
 1.604
1.604  0.192
0.192  0.276
0.276
He 1.386  0.155
0.155  0.188
0.188
Ar 0.157  0.106
0.106  0.192
0.192
Table 2. Interdiffusion coefficient DAB
Diffusing gas A Medium B P.mm 


 He 760 298 1.64
Ar He 751 288 0.703

 760 288 0.158
 air 760 273 0.219

 760 288 0.743

 760 273 0.146
Table 3. Diffusion coefficient of gases in liquids
Gas | Liquid | T, K |  |
Air | Water | 293 | 2.5 |
 | Water | 298 | 1.92 |
 | Water | 298 | 4.50 |
 | Water | 285 | 1.64 |
 | Ethanol | 298 | 3.42 |
 | Heptane | 298 | 6.03 |
When comparing Tables 1 and 2 with Table 3, it is clear that the diffusion coefficients in the gaseous and liquid phases differ by a factor of 104 105, which is reasonable given that diffusion is the movement of individual molecules through a layer of molecules of the same substance (self-diffusion) or other substances (diffusion) (binary diffusion in which the molecules of two substances interdiffuse). In a liquid, the number density of molecules is substantially larger, and their mobility is lower, implying a much lower diffusion coefficient. Diffusion is still slower in solids.
The diffusion coefficient can be computed if experimental data isn't available.
Gaseous diffusion. The diffusion coefficient of ideal gases is independent of substance concentration. The mean free-path length l of molecules is inversely related to the mean cross-sectional area of the molecule S and the number density of the molecules n in a mixture, according to the kinetic theory of gases. T/p, where T is the temperature and p is the pressure, is inversely proportional to the amount of space occupied by the mixture. The average molecular velocity, u, is proportional to, where is the molecular mass. Thus, the term for interdiffusion of gases of the same molecular mass, or self-diffusion, is:

The interdiffusion coefficient is: if molecules of types A and B interact (binary diffusion).
 (1)
(1)
SAB is the average of the cross-sections of both types of molecules. The constant in Eq. (1) can be calculated using the kinetic theory of gases, assuming the molecules are spherical and their cross-sections are equal to the cross-sections of these spheres.
Sutherland corrected Eq. (1) to account for the forces of intermolecular attraction that affect the free-path length of molecules; as a result,

Where CAB is the Sutherland coefficient.
The complexity of molecular interaction is taken into account in modern kinetic theory; molecules repel each other when they are near together and attract each other when they are separated. Many researchers have looked at the possibilities of this chemical interaction, but the so-called Lennard-Jones potential has gotten a lot of attention.

Where (r) is the potential energy; r is the distance between molecule centres; and are the Lennard-Jones interaction constants, which have been calculated for several gases and summarised in tables.
For dilute gas mixtures, the formula assumes that molecular collisions are only binary and elastic, that colliding molecules' motion is described by classical mechanics, that quantum effects are absent, and that intermolecular forces occur only along the centre line.

Bird, Hirshfelder, and Curtiss found the diffusion coefficient in a binary mixture. The collision integral is equal to f(kT/AB) and k is the Boltzmann constant. The binary system's interaction parameters AB and AB were calculated using the relevant constants for pure substances:

If data on and aren't available, the well-known critical parameters for a given material can be used to estimate them:

The critical temperature (K) and critical molar volume (cm3/mol), respectively, are Tc and Vc.
Wilke and Lee pointed out that the coefficient 1.885102 is not constant in reality and is dependent on the diffusing gases' molecular masses:

As a result of this precise specification, the experimental and computational data accord better.
Fuller, Schetter, and Gittings developed a correlation formula based on computer-aided correlation of 340 experimental points, which is stated as:
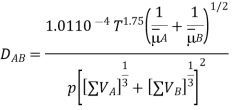
Where (VA) and (VB) are the values determined from the summation of atomic diffusion volumes for each component of the binary mixture, i.e., molecules A and B. Table 1 shows the results for a few atoms and simple compounds.
Table. Diffusion volumes of atoms and simple molecules
Substance  Substance
  Substance
C 16.5  26.9 CO 18.9
H 1.98  7.07
7.07  14.9
14.9
O 5.48 

 12.7
12.7
N 5.69  17.9
17.9  41.1
41.1
Wilke utilised the Maxwell-Stefan equation to get the expression for the diffusion coefficient in multicomponent systems.

Where D'A is the diffusion coefficient of component A in the mixture, and YA, YB, YC are the relevant component molar fractions; and DAB and DAC are the diffusion coefficients in the AB and AC binary systems, respectively.
In liquids, there is a phenomenon known as diffusion. As previously stated, diffusion in liquids finds stronger resistance, with diffusion coefficients of 104 to 105 times for liquids.
The Stokes-Einstein equation, based on the motion of a spherical particle of diffusing substance A in a viscous liquid continuum B, was one of the first equations for estimating the diffusion coefficient in dilute solutions.

Where r0 is the radius of the particle (molecule) and B is the viscosity of the liquid The constant b is proportional to the size of the diffusing molecules: b = 6 for bigger molecules, b = 4 for identical molecules, and b can be less than 4 for smaller molecules.
If the molecule diameter is, and the molar volume of a diffusing substance is, and N0 is the Avogadro number, then

When this formula is compared to experimental data, the discrepancy is usually moderate, reaching 40 percent only in a few circumstances.
Wilke and Chang proposed a more generic formula in 1955, based on numerous experimental researches but also including several empirical values.

DAB is the interdiffusion coefficient in an infinitely dilute solution, cm2/s;  the parameter of association of solvent B;
  the molecular mass of substance B;
  the molar volume of solute A at a boiling point under normal conditions, cm3/mol;
  , the substance viscosity, Ns/m2; and T, the temperature, K.
The association parameter was introduced into the model because associated molecules behave like large molecules and diffuse at a slower rate, with the degree of association varied with mixture composition and molecule kinds. As a result, Wilke and Chang provided the following values for the most common solvents: water = 2.6; methanol, 1.9; ethanol, 1.5; benzene, ester, heptane, and non associated solvents, 1.

Is deserving of consideration It looks to be more precise in some circumstances than the previous one; but, for vA/vB (1 - 2), the departure from experiment becomes significant, and the following relationships are recommended:
 (Water is the solvent);
 (Benzene is the solvent);
 (Other solvents).
Reddy and Doraiswamy have suggested the equation

Where KRS is different based on the molar volume ratio: KRS = 8.5 108 for and KRS = 107 for A comparison of this equation with 96 experimental points revealed good agreement, with a point spread of roughly 15%.
For low-viscosity liquids, all of the following formulas for estimating the diffusion coefficient remain true. They are in great mistake and so inapplicable for a high-viscosity solvent.
The influence of temperature on the diffusion coefficient has received little attention thus far. The temperature dependence of the diffusion coefficient can be considered to be linear within a restricted temperature range of 10 to 20°C.

Where D298 is the diffusion coefficient at T = 298K, Ns/m; 298 is the solvent viscosity at 298K, Ns/m; and g/cm3 is the solvent density.
This must be an exponential dependence of the type D = AT exp (-E/RT), according to theory.
Wilke and Chang's experimental results show that the activation energy fluctuates between 12.6 and 28.1 kJ/mol.
The dependence of the diffusion coefficient on diffusing substance concentration is, strictly speaking, due to the fact that diffusion flow is determined by the difference (gradient) of the system's thermodynamic potential rather than concentration, i.e., the formula must account for diffusing substance activity. As a result, when VB = const,

Where D0 and D are the diffusion coefficients in an infinitely dilute solution and a solution with finite concentration c, respectively; a and c are the activity and concentration of the diffusing substance, respectively; and n is the activity coefficient of this substance. Because the theoretical formulas were developed using assumptions, the semiempirical formulas shown above are more precise. To avoid a significant inaccuracy, it is recommended to perform calculations using several formulas at the same time and compare the results.
Salts dissolve and disperse as ions and molecules in electrolyte solutions, depending on the degree of dissociation. Salt diffusion theory is primarily developed for dilute solutions with a degree of dissociation near to one. The Nernst-Heckell equation can be used to calculate the diffusion coefficient for a simple salt that has been endlessly diluted.

DAB is the diffusion coefficient, defined as the proportionality factor between the molecular flow of dissolved salt and the gradient of its molecular concentration, cm2/s; T is the temperature, K; Fa is the Faraday number, n+ and n-, the cation and anion valences; and is the limit (under an infinite dilution) of cation and anion ionic conductions, cm2/mol.
The diffusion coefficient in electrolyte solutions is highly dependent on the concentration of the diffusing material. The formula is 2N if the concentration is less than 2N.

Is proposed by Gordon, where D0 and D are the diffusion coefficients for an infinitely dilute solution and a molar solution, respectively; V, the solution volume; V1, the partial volume of the solvent; x1, the number of solvent moles in volume V; v, the molarity of the solution; and1, the viscosity of the solution and solvent; v, the molar activity coefficient
The mass of some species entering a control volume minus the mass of this species leaving the control volume must match the mass of the species contained in the control volume.
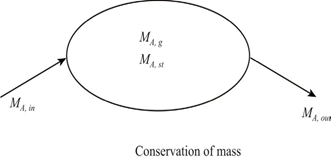

Species generation exists when chemical reactions occur in the system.
There will be a net production of species A if a dissociation reaction of the form AB A + B were occurring.
Mass Diffusion Equation: -
We shall consider a homogeneous medium that is binary mixture of species A and B and that is stationary. The mass average or molar average velocity of the mixture is everywhere zero and mass transfer may occur only by diffusion. The resulting equation could be solved for the species concentration distribution, which could, in turn, be used with Fick's law to determine the species diffusion rate at any point in the medium. We define a differential control volume dx dy dz, within the medium and then consider the processes that influence the distribution of species A. With the concentration gradients, diffusion must result in the transport of species A through the control surfaces. Moreover, relative to stationary coordinates, the species transport rates at opposite surfaces must be related by

In addition, there may also be volumetric (homogeneous) chemical reactions throughout the medium. The rate at which species A is generated within the control volume due to such reactions may be expressed as


Where  is the rate of increase of the mass of species A per unit volume of the mixture (kg/sm3). Finally, these processes may change the mass of species A stored within the control volume
The mass diffusion equation
Mass diffusion governing equations are an extension of Fick's equations, allowing for nonuniform solubility of the diffusing substance in the base material as well as mass diffusion driven by temperature and pressure gradients. The “normalised concentration” (often also referred to as the “activity” of the diffusing material), def=c/s=defc/s, is the basic solution variable (used as the degree of freedom at the nodes of the mesh), where c is the mass concentration of the diffusing material and s is its solubility in the base material. As a result, when the mesh contains distinct materials with shared nodes, the normalised concentration remains constant across the interface between them.
For example, Sievert's law can be used to describe a diatomic gas that dissociates during diffusion: c=sp12c=sp12, where p is the diffusing gas's partial pressure. Using Sievert's rule and the prior definition of normalised concentration, =c/s=p12=c/s=p12. Because equilibrium needs constant partial pressure across an interface, normalised concentration must be continuous as well. If the connection between concentration and partial pressure for a diffusing material is determined by an expression other than Sievert's law, solubility should be defined accordingly.
The mass conservation condition for the diffusing phase defines the diffusion problem:
∫Vdc.dt. dV+∫Sn⋅JdS=0,
Where V is any volume whose surface is S, n is the outward normal to S, JJ is the flux of concentration of the diffusing phase, and n⋅J is the concentration flux leaving S.
Diffusion is assumed to be driven by the gradient of a general chemical potential, which gives the behavior
J=−sD⋅[∂ϕ∂x+κs∂∂x(ln(θ−θZ)) +κp∂p∂x],
Where D (c, θ, f) is the diffusivity; s (θ, f) is the solubility; κs (c, θ, f) is the “Soret effect” factor, providing diffusion because of temperature gradient; θ is the temperature; θZ is the value of absolute zero on the temperature scale being used; κp (c, θ, f) is the pressure stress factor, providing diffusion driven by the gradient of the equivalent pressure stress, pdef=−trace(σ)/3; σ is stress; and f are any predefined field variables.
Whenever D, κs, or κp depends on concentration, the problem becomes nonlinear and the system of equations becomes nonsymmetric. In practical cases the dependence on concentration is quite strong, so the nonsymmetric matrix storage and solution scheme is invoked automatically when a mass diffusion analysis is performed.
Cartesian coordinates deviation
In most investigations of oceanic dynamics, the Cartesian coordinate system is used. X is to the east, y is to the north, and z is to the right. The f-plane is a Cartesian coordinate system with a constant Coriolis parameter. The -plane is a Cartesian coordinate system in which the Coriolis parameter is believed to be linearly proportional to latitude.
When the water on the sea surface moves solely due to the Coriolis force and no other force acts on the water, this is referred to as an inertial motion.
By (11.34),
{∂v1∂t+v1∂v1∂x+v2∂v1∂y+v3∂v1∂z=−1ρ∂p∂x+fv2+Fx, ∂v2∂t+v1∂v2∂x+v2∂v2∂y+v3∂v2∂z=−1ρ∂p∂y−fv1+Fy, ∂v3∂t+v1∂v3∂x+v2∂v3∂y+v3∂v3∂z=−1ρ∂p∂z−g+Fz,
Where v = (v1, v2, v3), F = (Fx, Fy, Fy), and f = 2 sin are the velocity, friction, and Coriolis parameter. The horizontal momentum equations are the first two, while the vertical momentum equation is the third.
We get the horizontal momentum equations by dropping the quadratic terms in the material derivatives.
{∂v1∂t=−1ρ∂p∂x+fv2+Fx, ∂v2∂t=−1ρ∂p∂y−fv1+Fy.
If only Coriolis force acts on the water, there must be no horizontal pressure gradient,
∂p∂x=∂p∂y=0,
And so
(12.1) {∂v1∂t=fv2+Fx, ∂v2∂t=−fv1+Fy.
For a frictionless ocean, Fx = Fy = 0. So (12.1) reduces to the two coupled, first-order, linear, differential equations
{∂v1∂t=fv2, ∂v2∂t=−fv1.
This system of equations can be solved with standard techniques as follows.
Solving the second equation for v1 gives
v1=−1f∂v2∂t.
Inserting it into the first equation gives
−1f∂2v2∂t2=fv2.
Therefore, the inertial motion satisfies the system of equations
{v1+1f∂v2∂t=0, ∂2v2∂t2+f2v2=0.
This system of equations has the solution
{v1=Vsinft, v2=Vcosft, V2=v12+v22.
A parameter equation for a circle with diameter Di = 2V and period Ti=2f=Tsd2sin, where Tsd=2 is a sidereal day, is the solution. The inertial period is denoted by the letter Ti. It describes a current known as an inertial current or an inertial oscillation.
The most prevalent currents in the ocean are inertial currents. They've been spotted at all depths and latitudes in the ocean. The motions are only temporary and go away after a few days. In most cases, oscillations at different depths or at different neighbouring places are incoherent.
The Cartesian coordinate system makes describing the location of points in space very simple. Some surfaces, on the other hand, can be challenging to represent using Cartesian equations. This is a common difficulty; remember that polar coordinates are a handy alternate approach for representing the location of a point in the plane in two dimensions, especially when dealing with circles. We'll look at two distinct approaches of representing the location of points in space in this section, both of which are based on polar coordinate extensions. Cylindrical coordinates, as the name implies, are useful for dealing with cylinder-related difficulties, such as determining the volume of a spherical water tank or the amount of oil flowing through a pipe. Similarly, spherical coordinates can be used to solve sphere-related problems, such as determining the volume of domed constructions.
Cylindrical Coordinates
We simply added a new axis to depict the third dimension when we expanded the classic Cartesian coordinate system from two to three dimensions. We may use the same method to develop a new three-dimensional coordinate system called the cylindrical coordinate system, starting with polar coordinates. In this way, cylindrical coordinates are a natural three-dimensional extension of polar coordinates.
Definition: The Cylindrical Coordinate System In the cylindrical coordinate system, a point in space is represented by the ordered triple (r, θ, z), where
- (r, θ) are the polar coordinates of the point’s projection in the xy-plane
- z is the usual z-coordinate in the Cartesian coordinate system
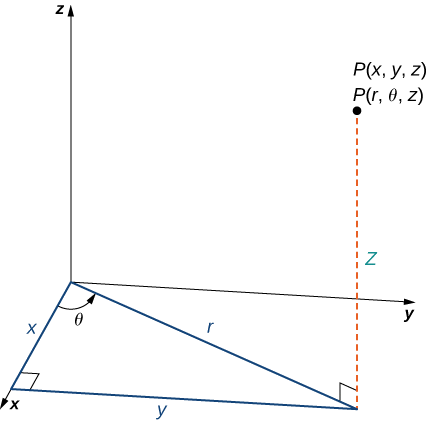
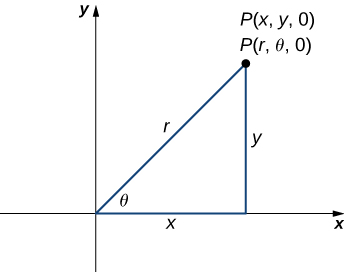
The xy-plane contains the right triangle. The hypotenuse's length is r, and the angle created by the positive xx-axis and the hypotenuse is measured by. The z-coordinate indicates whether a point is above or below the xy plane.
The right triangle represented in Figure offers the key to converting cylindrical to Cartesian, or rectangular, coordinates in the xy-plane.
Conversion between Cylindrical and Cartesian Coordinates
The rectangular coordinates (x, y, z) and the cylindrical coordinates (r, θ, z) of a point are related as follows:
These equations are used to convert from cylindrical coordinates to rectangular coordinates.
- x=rcosθx
- y=rsinθy
- z=z
These equations are used to convert from rectangular coordinates to cylindrical coordinates
- r2=x2+y2r2=x2+y2
- Tanθ=yx
- z=z
It should be noted that, like with the conversion from rectangular to polar coordinates in two dimensions, the equation tan=yx has an endless number of solutions. We can obtain a unique solution based on the quadrant of the xy-plane in which the initial point (x, y, z) is placed if we restrict to values between 0 and 2. If x=0, the value of will either be 2,322, or 00, depending on the value of y.
It's worth noting that these equations are derived from right triangle properties. Consider the point PP in the xy plane, which has rectangular coordinates (x, y,0) and cylindrical coordinates (r,0), as illustrated in Figure.
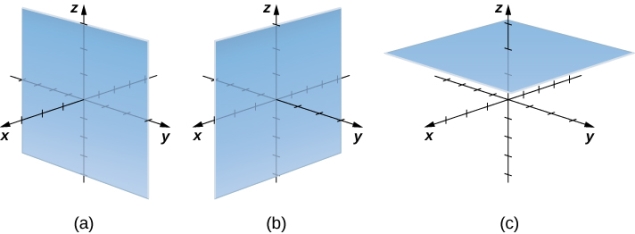
In rectangular coordinates, (a) surfaces of the form x=c are planes parallel to the yz-plane, (b) surfaces of the form y=c are planes parallel to the xz-plane, and (c) surfaces of the form z=c are planes parallel to the xy-plane.
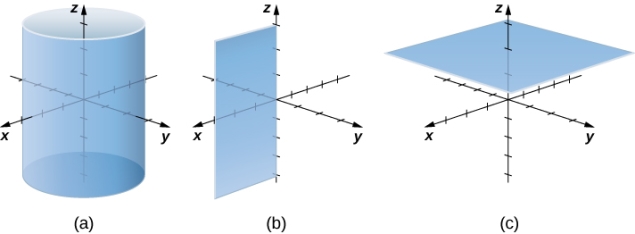
In cylindrical coordinates, (a) surfaces of the form r=c are vertical cylinders of radius r, (b) surfaces of the form θ=c are half-planes at angle θ from the x-axis, and (c) surfaces of the form z=c are planes parallel to the xy-plane.
Spherical Coordinates
The location of a point in space in the Cartesian coordinate system is given by an ordered triple in which each coordinate indicates a distance. The location of a point in space in the cylindrical coordinate system is given by two distances (r (r and z) z) and an angle measure (). We use an ordered triple to express the location of a point in space in the spherical coordinate system. The triple describes one distance and two angles in this situation. It's easy to describe a sphere with spherical coordinates, just as it's easy to describe a cylinder with cylindrical coordinates. Grid lines for spherical coordinates, like those for polar coordinates, are based on angle measures.
Spherical coordinate system is a type of coordinate system that has a spherical shape. A point PP in space is represented by the ordered triple (,) in the spherical coordinate system.
- ρ (the Greek letter rho) is the distance between PP and the origin (ρ≠0);
- θ is the same angle used to describe the location in cylindrical coordinates;
- φ (the Greek letter phi) is the angle formed by the positive z-axis and line segment OP¯, where O is the origin and 0≤φ≤π.
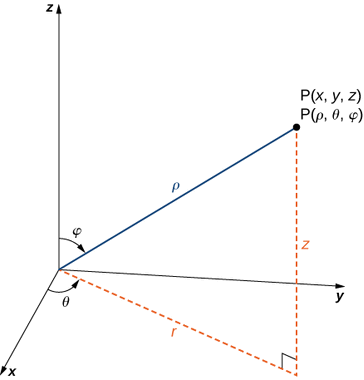
The relationship between cylindrical, spherical, and rectangular coordinates. In spherical coordinates, the origin is typically expressed as (0,0,0).
HOW TO DO IT: Converting Coordinates between Spherical, Cylindrical, and Rectangular
The following are the relationships between a point's rectangular coordinates (x, y, z), cylindrical coordinates (r, z), and spherical coordinates (,):
Convert from spherical coordinates to rectangular coordinates
These equations are used to convert from spherical coordinates to rectangular coordinates.
- x=ρsinφcosθ
- y=ρsinφsinθ
- z=ρcos
Convert from rectangular coordinates to spherical coordinates
These equations are used to convert from rectangular coordinates to spherical coordinates.
- ρ2=x2+y2+z2ρ2=x2+y2+z2
- Tanθ=yx
- φ=arccos (
 ).
).
Convert from spherical coordinates to cylindrical coordinates
These equations are used to convert from spherical coordinates to cylindrical coordinates.
- r=ρsinφ
- θ=θ
- z=ρcosφ
Convert from cylindrical coordinates to spherical coordinates
These equations are used to convert from cylindrical coordinates to spherical coordinates.
- ρ=

- θ=θ
- φ=arccos (
 )
)
The formulas for converting from spherical to rectangular coordinates may appear complicated, yet they are simple trigonometry applications. It is easy to see that r=sin by looking at Figure. Then we have x=rcos=sincosx. The formula for y has a similar derivation. 2=r2+z2=x2+y2+z2 and z=cos is also shown in the figure. =arccos(zr2+z2) = arcco Also, as previously, we must use caution when utilising the formula tan=yx to determine the correct value of.
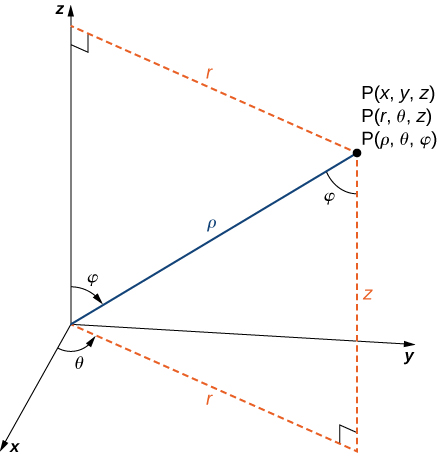
Right-triangle connections are used to create equations that convert from one system to another.
Consider the surfaces that are created when each of the coordinates is maintained constant, just as we did with cylindrical coordinates. Consider surfaces of the form =c, with cc as a constant. The points on these surfaces form a sphere and are at a fixed distance from the origin. Surfaces of the form =c are half-planes in the spherical coordinate system because the coordinate is the same as in the cylindrical coordinate system. Last but not least, consider surfaces with the shape =0. The points on these surfaces form a half-cone at a set angle from the z-axis.
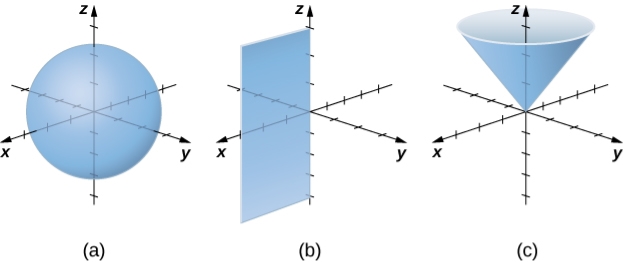
In spherical coordinates, surfaces of the form ρ=c is spheres of radius ρ (a), surfaces of the form θ=c are half-planes at an angle θ from the xx-axis (b), and surfaces of the form ϕ=c are half-cones at an angle ϕ from the z-axis (c).
The behaviour of a function on the boundary (border) of its defined area is expressed by a boundary condition. An initial condition is similar to a boundary condition, except that it is applied in the time direction. Although not all boundary conditions allow for solutions, the physics usually suggests what is reasonable. Let me remind you of a situation that you should all be familiar with in ordinary differential equations: a particle under the action of a constant force.
∂2x∂t2∂x∂tx=a.=at+v0,
=12at2+v0t+x0.
There are two integration constants in this. It is standard practise to provide xt(t=0) =v0 and x(t=0) =x0. These are first-order linear initial conditions (first-order because they only involve x and its derivatives in a linear manner). PDEs retain this one-order difference between boundary condition and equation. We certainly cannot describe the same derivative in a different equation because the equation already has that derivative. The key distinction between the arbitrariness of integration constants in PDEs and ODEs is that, whereas ODE solutions are truly constants, PDE solutions incorporate arbitrary functions.
Let me give an example. Take
u=yf (x
Then
∂u∂y=f(x).
This can be used to eliminate f from the first of the equations, giving
u=y∂u∂y
Which has the general solution u=yf(x).
One can construct more complicated examples. Consider
u (x, y) =f(x+y) +g(x−y)
Which gives on double differentiation
∂2u∂x2−∂2u∂y2=0.
The problem is that without extra constraints, the arbitrariness of the answer’s renders writing down the general solution nearly meaningless (if possible). Additional constraints are required to limit this freedom. Boundary conditions, which describe how the system operates on its boundaries (at all times), and initial conditions, which specify the state of the system at time t=0, are used in most physical problems. We have two beginning conditions (velocity and location at time t=0) in the ODE problem we mentioned earlier.
Explicit Boundary Conditions
We will only discuss linear boundary conditions for the problems of concern here, which express a linear relationship between the function and its partial derivatives, e.g.,
u (x, y=0) +x∂u∂x (x, y=0) =0.
As previously, the derivative's greatest order in the boundary condition is one order lower than the PDE's order. There are three different forms of boundary conditions for a second order differential equation.
Dirichlet Boundary Condition
Dirichlet boundary conditions are when the value of u on the boundary is specified. A vibrating string with its ends fixed at x=0 and x=L is an example.
u (0, t) =u (L, t) =0.
Von Neumann Boundary Conditions
The derivative of a function with respect to each of the variables forms a vector field (i.e., a function that takes a vector value at each point of space) in multidimensional problems, which is commonly referred to as the gradient. This assumes the following form for three variables:
Grad f (x, y, z) =∇f (x, y, z) = (∂f∂x (x, y, z), ∂f∂y (x, y, z), ∂f∂z (x, y, z))
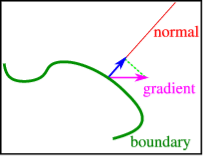
A sketch of the normal derivatives used in the von Neumann boundary conditions.
We can't usually define the gradient at the boundary because it's too restrictive for solutions. We can – and frequently must – indicate the component normal to the boundary in physical situations, as shown in Figure. Von Neumann boundary conditions are defined when this normal derivative is supplied.
We can't have a heat-flux beyond the ends of an insulated (infinitely thin) rod of length aa, therefore the temperature gradient has to vanish (heat can only flow where a difference in temperature exists).
This leads to the BC
∂u∂x (0, t) =∂u∂x (a, t) =0
Mixed (Robin’s) Boundary Conditions
Of course, we can mix and match Dirichlet and von Neumann boundary conditions. In the case of the narrow rod mentioned above, we might need
u (0, t) +∂u∂x (0, t) =u (a, t) +∂u∂x (a, t) =0.
Implicit Boundary Conditions
We have implicit boundary requirements in many physical situations, which simply mean that we have certain constraints that must be met. This is most often the case with systems that have an endless definition area. This usually means that the wavefunction must be normalizable in the case of the Schrödinger equation. As a result, we must rule out the wave function blowing up at infinity. We can make assumptions about continuity or differentiability without realising it. In general, such implicit BCs, which can be quite crucial, should be avoided.
More Realistic Examples of Boundary and Initial Conditions
A String with Fixed Endpoints
Consider a string fixed at x=0 and x=a, as in Figure

A string with fixed endpoints.
It satisfies the wave equation
1c2∂2u/∂t2=∂2u/∂x2, 0<x<a
With boundary conditions
u (0, t) =u (a, t) =0, t>0,
And initial conditions,
u(x,0) =f(x), ∂u/∂x(x,0) =g(x).
A String with Freely Floating Endpoints
Consider a string whose ends are attached to air bearings on a rod that is perpendicular to the xx-axis. There should be no stress along the rods because the bearings float freely, hence the string should be horizontal at the bearings. Figure
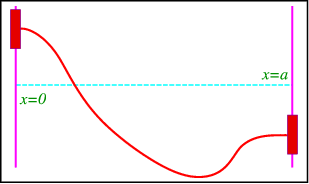
A string with floating endpoints.
It satisfies the wave equation with the same initial conditions as above, but the boundary conditions now are
∂u∂x (0, t) =∂u∂x (a, t) =0, t>0.
These are clearly of von Neumann type.
A String with Endpoints Fixed to Strings
To demonstrate mixed boundary conditions, we create a more sophisticated contraption in which the string's endpoints are fixed to springs, with equilibrium at y=0y=0, as shown in Figure.
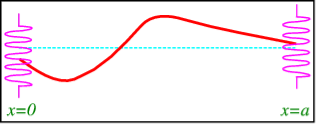
A string with endpoints fixed to springs.
F=ku (0, t), where kk is the spring constant, is Hook's law for the force exerted by the spring (along the y axis). The force of the string on the spring, which is equivalent to the tension TT in the string, must balance this. Tsin is the component parallel to the y axis, where is the angle with the horizontal (see Figure).
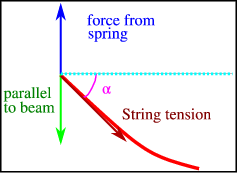
The balance of forces at one endpoint of the string of Figure
For small αα we have
Sinα≈tanα=∂u∂x (0, t).
Since both forces should cancel, we find
u (0, t) −Tk∂u∂x (0, t) =0, t>0,
And
u (a, t) −Tk∂u∂x (a, t) =0,
Numerical
Example: Calculate the mass concentration of 2-gram moles of Sulphur dioxide to be used to manufacture sulfuric acid in a 0.20 m3 of reactor.
Solution: 2 moles of Sulphur dioxide is equal to 642g = 128 g
So mass concentration is 128 g/0.20 m3 = 1280.001 kg/0.20 m3 = 0.64 kg/m3
Example: A mixture of noble gases [helium, argon, krypton, and xenon] is at a total pressure of 100 kPa and a temperature of 200 K. If the mixture has equal kmole fractions of each of the gases, determine:
a) The composition of the mixture in terms of mass fractions.
b) Total molar concentration
c) The mass density.
Solution:
(a) Let 100 kmol of the mixture
Molecular weight of helium, argon, krypton (3), and xenon (4) are 4, 40, 83.8 and 131.3 kg/mol respectively.
Moles of each component of the mixture = 25 moles
Molecular weight of helium, argon, krypton (3), and xenon (4) are 4, 40, 83.8 and 131.3 kg/mol respectively.
Moles of each component of the mixture = 25 moles
So total mass of mixture = 25*4+ 25*40+25*83.8+25*131.3 = 6477.5 kg So mass fractions (component mass/ Total mass) are:
Helium = 25*4/6477.5 = 0.015, Argon = 25*40/6477.5= 0.154,
Krypton = 25*83.8/6477.5 = 0.323 and Xenon =25*131.3/6477.5 = 0.507
The average molecular weight of the mixture = total mass/100 kmol = 6477.5 kg/100 kmol = 64.775 kg/kmol = 0.064775 kg/mol
(b) Temperature T = 200 K, Pressure P = 100 kPa, R = 8.314 kPa.m3.kmol-1.K-1. So Total molar concentration, C = P/RT = 60.14 mol/m3.
(c) Mass density = Total molar concentration (C) * average molecular weight of the mixture = 60.14 mol/m3*0.064775 kg/mol = 3.896 kg/m3.
Example: Converting from Cylindrical to Rectangular Coordinates. Plot the point with cylindrical coordinates (4,2π3, −2) and express its location in rectangular coordinates.
Solution
Conversion from cylindrical to rectangular coordinates requires a simple application of the equations listed in Note:
Xyz=rcosθ=4cos2π3=−2=rsinθ=4sin2π3=23–√=−2.x=rcosθ=4cos2π3=−2y=rsinθ=4sin2π3=23z=−2.
The point with cylindrical coordinates (4,2π3, −2) has rectangular coordinates (−2, ,−2).
,−2).
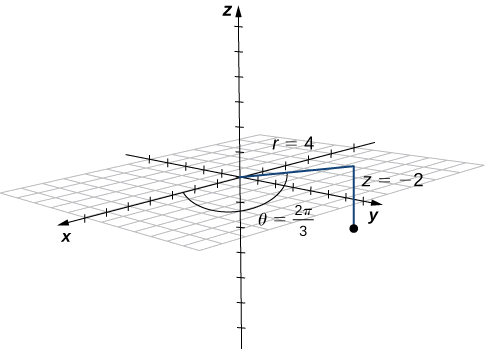
The projection of the point in the xy-plane is 4 units from the origin. The line from the origin to the point’s projection forms an angle of 2π32π3 with the positive xx-axis. The point lies 22 units below the xy-plane.
Example: Converting from Rectangular to Cylindrical Coordinates. Convert the rectangular coordinates (1, −3,5) to cylindrical coordinates.
Solution
Use the second set of equations from Note to translate from rectangular to cylindrical coordinates:
r2r= =±
=± .
.
We choose the positive square root, so  =10.Now, we apply the formula to find θ. In this case, y is negative and x is positive, which means we must select the value of θ between 3π2 and 2π:
Tanθ=yx=arctan (−3) =−31≈5.03rad.
In this case, the z-coordinates are the same in both rectangular and cylindrical coordinates:
z=5.
The point with rectangular coordinates (1, −3,5) has cylindrical coordinates approximately equal to ( ,5.03,5).
Example: Identifying Surfaces in the
Cylindrical Coordinate System. Describe the surfaces with the given cylindrical equations.
- θ=π4
- r2+z2=9
- z=r
Solution
a. When the angle θ is held constant while r and z are allowed to vary, the result is a half-plane.
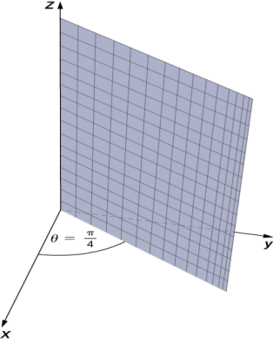
In polar coordinates, the equation θ=π/4 describes the ray extending diagonally through the first quadrant. In three dimensions, this same equation describes a half-plane.
b. Substitute r2=x2+y2 into equation r2+z2=9 to express the rectangular form of the equation: x2+y2+z2=9. This equation describes a sphere centered at the origin with radius 3
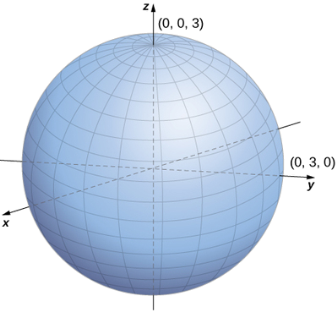
The sphere centered at the origin with radius 3 can be described by the cylindrical equation r2+z2=9.
c. To describe the surface defined by equation z=r, is it useful to examine traces parallel to the xy-plane. For example, the trace in plane z=1 is circle r=1, the trace in plane z=3 is circle r=3, and so on. Each traces a circle. As the value of z increases, the radius of the circle also increases. The resulting surface is a cone.
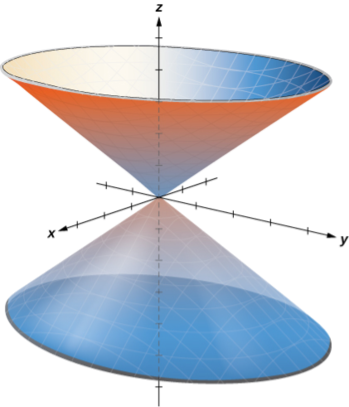
The traces in planes parallel to the xy-plane are circles. The radius of the circles increases as z increases.
Example: Converting from Spherical Coordinates. Plot the point with spherical coordinates (8, π3, π6) and express its location in both rectangular and cylindrical coordinates.
Solution
Use the equations in Note to translate between spherical and cylindrical coordinates
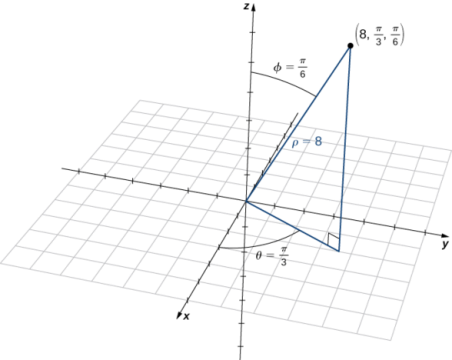
The projection of the point in the xy-plane is 4 units from the origin. The line from the origin to the point’s projection forms an angle of π/3π with the positive x-axis. The point lies  units above the xy-plane. The point with spherical coordinates (8, π3, π6) has rectangular coordinates (2,
 ,
, ). Finding the values in cylindrical coordinates is equally straightforward:
rθz=ρsinφ=8sinπ6=θ=ρcosφ=8cosπ6= .
.
Thus, cylindrical coordinates for the point are (4, π3, ).
).
Example: Converting from Rectangular Coordinates. Convert the rectangular coordinates (−1,1, ) to both spherical and cylindrical coordinates.
Solution
Start by converting from rectangular to spherical coordinates:
ρ2tanθρ=x2+y2+z2= (−1)2+12+( )2=8=1−1=
 and θ=arctan (−1) =3π4.ρ2=x2+y2+z2= (−1)2+12+(6)2=8tanθ=1−1ρ=22 and θ=arctan (−1) =3π4.
Because (x, y) = (−1,1), then the correct choice for θ is 3π4.
There are actually two ways to identify φ. We can use the equation φ=arccos ( ). A more simple approach, however, is to use equation z=ρcosφ. We know that z=
 and ρ=
 , so
, so
 =
= cosφ, so cosφ=
 =
= 2
2
And therefore φ=π6. The spherical coordinates of the point are ( ,3π4, π6).
To find the cylindrical coordinates for the point, we need only find r:
r=ρsinφ= sin(π6) =
 .
.
The cylindrical coordinates for the point are ( ,3π4,
,3π4, ).
).
Example: Identifying Surfaces in the Spherical Coordinate System
Describe the surfaces with the given spherical equations.
- θ=π3
- φ=5π6
- ρ=6
- ρ=sinθsinφ
Solution
a. The variable θ represents the measure of the same angle in both the cylindrical and spherical coordinate systems. Points with coordinates (ρ, π3, φ) lie on the plane that forms angle θ=π3 with the positive x-axis. Because ρ>0, the surface described by equation θ=π3 is the half-plane shown in Figure
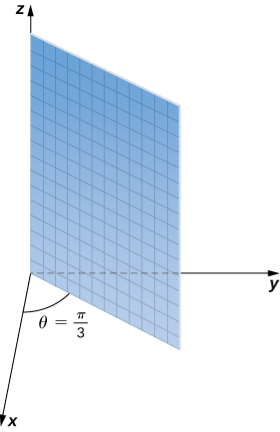
The surface described by equation θ=π3 is a half-plane.
b. Equation φ=5π6 describes all points in the spherical coordinate system that lie on a line from the origin forming an angle measuring 5π6 rad with the positive z-axis. These points form a half-cone (Figure). Because there is only one value for φ that is measured from the positive z-axis, we do not get the full cone (with two pieces).
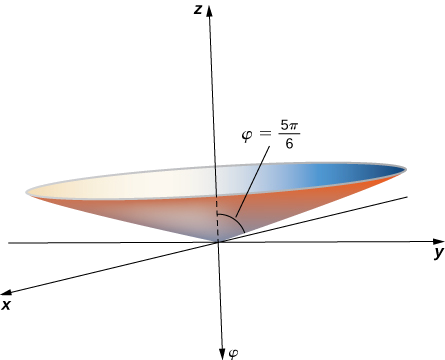
The equation φ=5π6 describes a cone
To find the equation in rectangular coordinates, use equation
φ=arccos ( ).
).
This is the equation of a cone centered on the z-axis.
c. Equation ρ=6 describes the set of all points 6 units away from the origin—a
Sphere with radius 6
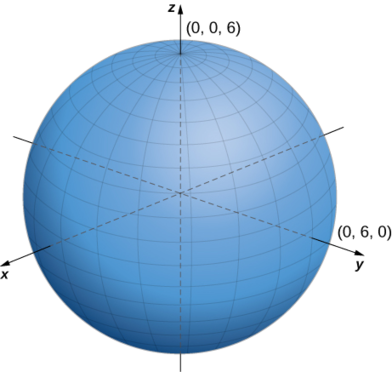
Equation ρ=6 describes a sphere with radius 66.
d. To identify this surface, convert the equation from spherical to rectangular coordinates, using equations y=ρsinφsinθ and ρ2=x2+y2+z2:
ρ=sinθsinφ
ρ2=ρsinθsinφ Multiply both sides of the equation by ρ.
x2+y2+z2=y Substitute rectangular variables using the equations above.
x2+y2−y+z2=0 Subtract y from both sides of the equation.
x2+y2−y+14+z2=14 Complete the square.
x2+(y−12)2+z2=14. Rewrite the middle terms as a perfect square.
The equation describes a sphere centered at point (0,12,0) with radius 12.
References:
1. P.K. Nag, Heat & Mass Transfer, McGraw Hill Education Private Limited.
2. M.M. Rathod, Engineering Heat and Mass Transfer, Third Edition, Laxmi Publications, New Delhi
3. V. M. Domkundwar, Heat Transfer, Dhanpat Rai & Co Ltd.
4. A.F. Mills, Basic Heat and Mass Transfer, Pearson.
5. S. P. Venkatesan, Heat Transfer, Ane Books Pvt. Ltd.