Unit - 3
Control systems & transfer function-based modelling
A control system is a set of mechanical or electronic devices which control the other devices. In control system behaviours of the system is desired by differential equations.
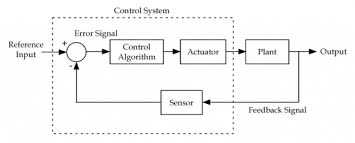
Fig: Block diagram for closed loop control system
The above figure shows a feedback system with a control system. The components of control system are:
i) The actuator takes the signal transforms it accordingly and causes some action.
Ii) Sensors are used to measure continuous and discrete process variables.
Iii) Controllers are those elements which adjust the actuators in response to the measurement.
Key takeaway:
1) The feedback control system is having a sensor.
2) These sensors help to improve accuracy by generating error signal.
The control system plays a major role in the technology. All the areas in any industry require control systems in any way to keep it running. Like in space technology, power system, transportation system, robotics, machine tool controlling etc., everything needs controlling. So, these are basically control systems.
Like in space technology, power system, transportation system, robotics, machine tool controlling etc., everything needs controlling. So, these are basically control systems. These basically provide the desired responses or application when proper controlling is provided to them.
It is noteworthy here that the input and output of a control system must have appropriate mathematical relationship between them. When there exists linear proportionality between input and output of the system then it is known as a linear control system, otherwise a non-linear system.
Open Loop Control system
An open-loop control system takes input under the consideration and doesn’t react on the feedback to obtain the output. This is why it is also called a non-feedback control system.

Fig: Open loop control system
Closed Loop Control System
A closed loop system is also referred as a feedback control system. These systems record the output instead of input and modify it according to the need. It generates preferred condition of the output as compared to the original one. It doesn’t encounter any external or internal disturbances.
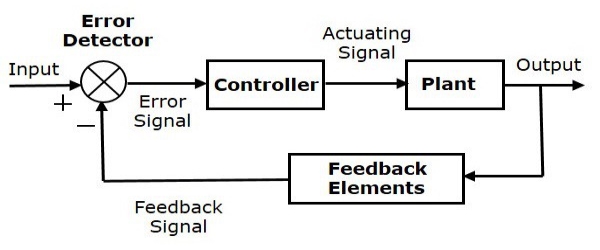
Fig: Closed loop control system
Differences between Open-loop and Closed-loop control systems
These two types of control system have contrast with each other. They have dissimilarities some of which are discussed below:
Effect of output
– An open loop control system acts completely on the basis of input and the output has no effect on the control action.
– A closed loop control system considers the current output and alters it to the desired condition. The control action in these systems is based on the output.
Reaction to Internal and External Disturbances
– An open loop control system works on fixed operation conditions and there are no disturbances.
– A closed loop control system doesn’t encounter and react on external disturbances or internal variations.
Stability
– Open loop control systems are mostly stable.
– In closed loop control systems stability is a major issue.
Effect on gain
– There is no effect on gain.
– There is no-linear change in system gain.
Implementation
– The structure of open loop control system is rather easy to construct. These systems can be easily implemented.
– The working principle and structures of closed loop control systems are rather complex and they are often difficult to implement.
Cost
– As an open loop control system is easy to implement, it needs lesser number of components to be constructed. Such systems need good calibration and lesser power rating. The overall cost of these systems is low.
– As the principle is complex, a closed loop control system needs larger number of components than an open loop control system.
Key takeaway
Open Loop System | Closed Loop system |
1.It does Not have any feedback. | 1. This system comprise of feedback |
2.As no feedback so easier to build. | 2.As it has feedback so difficult to build |
3.Theaccuracy of this system depends on the calibration of input. | 3.They are accuracy because of the feedback. |
4.Open Loop system are more stable. | 4.In closed Loop system stability depends on system components. |
5.optimization is not possible | 5. Optimization is possible |
6.These systems are not reliable. | They are more reliable |
A transfer function represents the relationship between the output signal of a control system and the input signal, for all possible input values. A block diagram is a visualization of the control system which uses blocks to represent the transfer function, and arrows which represent the various input and output signals.
For any control system, there exists a reference input known as excitation or cause which operates through a transfer operation (i.e., the transfer function) to produce an effect resulting in controlled output or response.
Thus, the cause and effect relationship between the output and input is related to each other through a transfer function.

Fig: Transfer function
In a Laplace Transform, if the input is represented by R(s) and the output is represented by C(s), then the transfer function will be:

That is, the transfer function of the system multiplied by the input function gives the output function of the system.

Fig: Transfer function with input and output
Key takeaway
The transfer function is given as

Block Diagram Reduction Rules
Follow these rules for simplifying (reducing) the block diagram, which is having many blocks, summing points and take-off points.
Rule 1 − Check for the blocks connected in series and simplify.
Rule 2 − Check for the blocks connected in parallel and simplify.
Rule 3 − Check for the blocks connected in feedback loop and simplify.
Rule 4 − If there is difficulty with take-off point while simplifying, shift it towards right.
Rule 5 − If there is difficulty with summing point while simplifying, shift it towards left.
Rule 6 − Repeat the above steps till you get the simplified form, i.e., single block.
Note − The transfer function present in this single block is the transfer function of the overall block diagram.
Example
Consider the block diagram shown in the following figure. Let us simplify (reduce) this block diagram using the block diagram reduction rules.
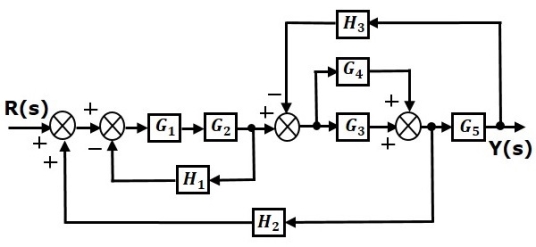
Step 1 − Use Rule 1 for blocks G1 and G2. Use Rule 2 for blocks G3 and G4. The modified block diagram is shown in the following figure.
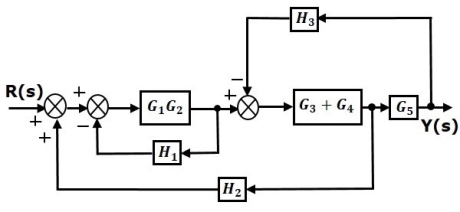
Step 2 − Use Rule 3 for blocks G1G2 and H1. Use Rule 4 for shifting take-off point after the block G5. The modified block diagram is shown in the following figure.
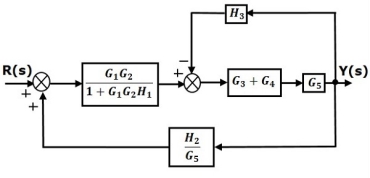
Step 3 − Use Rule 1 for blocks (G3+G4) and G5. The modified block diagram is shown in the following figure.
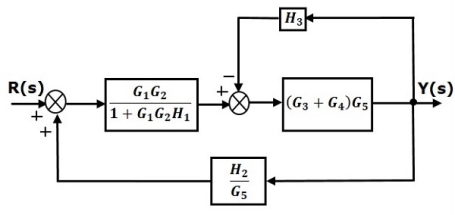
Step 4 − Use Rule 3 for blocks (G3+G4) G5 and H3. The modified block diagram is shown in the following figure.
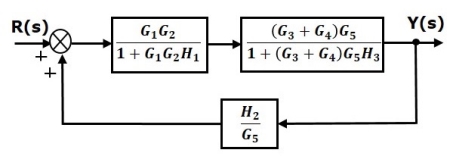
Step 5 − Use Rule 1 for blocks connected in series. The modified block diagram is shown in the following figure.
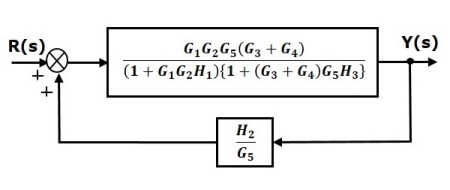
Step 6 − Use Rule 3 for blocks connected in feedback loop. The modified block diagram is shown in the following figure. This is the simplified block diagram.

Q1. Reduce given B.D to canonical (simple form) and hence obtain the equivalent Tf = c(s)/ R(S)?
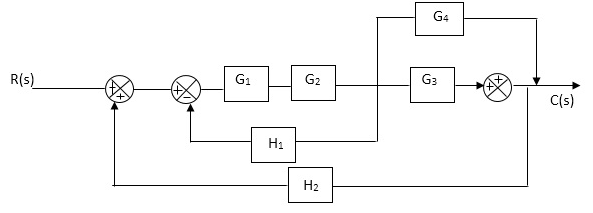
Sol:
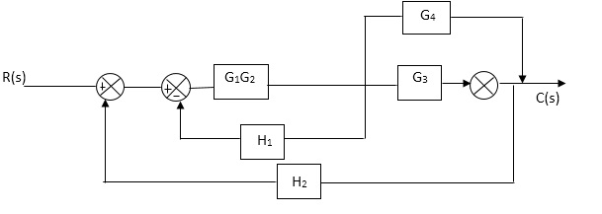


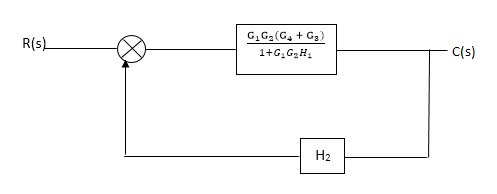
C(S)/R(S) = (G1G2) (G3+G4)/1+G1G2H1)/1-G1, G2(G3+G4) H2/1+G1G2H1
= G1G2(G3+G4)/1+G1G2H1-G1G2H2(G3+G4)
=G1G2(G3+G4)/1+(H1-H2) (G1G2) (G3+G4)
C(s)/R(S) = G1G2(G3+G4)/1+(H1-H2(G3+G4)) G1 G2
Q2) Reduce the Block diagram
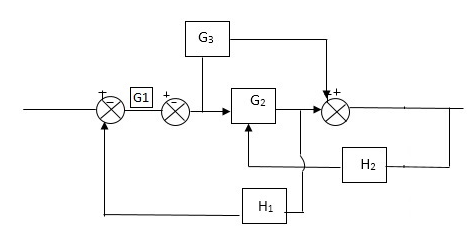
Sol:
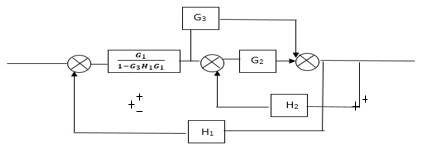
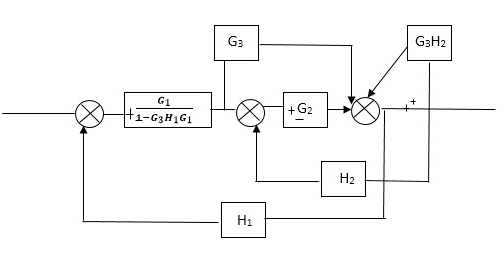
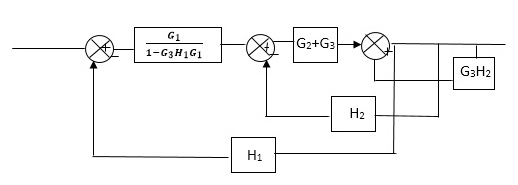
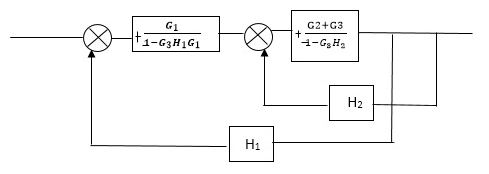
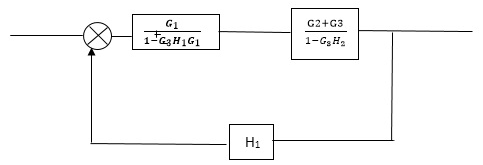
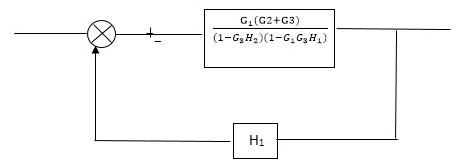
C(s)/R(s)= G1(G3+G2)/(1-G1G3X1) (1-G2X2) H1
= G(G3+G2)/(1-G3G1H1) (1-G2H2) + G1H1(G3+G2)
= G1(G3+G2)/1-G3G1H1-G2H2+G1H1(G3+G2H1
=G1(G3+G2)/1-G3H2+G1G2H1(1+G3H2)
Household (Media Centre)
A typical Media centre consists of a television, a receiver with its speakers, and a cable or satellite box.
● The User interacts with the media centre using a remote control with the capabilities of turning on or off the system, changing the channel, volume and input (i.e., Cable, DVD player, etc.).
● A media centre will almost certainly have many more functions, however, these are the ones absolutely required for use.
Automotive (Electronic clutch control)
• To relieve pressing of clutch during gear change
• Throttle cable of accelerator pedal replaced by closed loop control system
– Accelerator pedal position sensor and servomotor
– Connected to an ECU for the gear change process
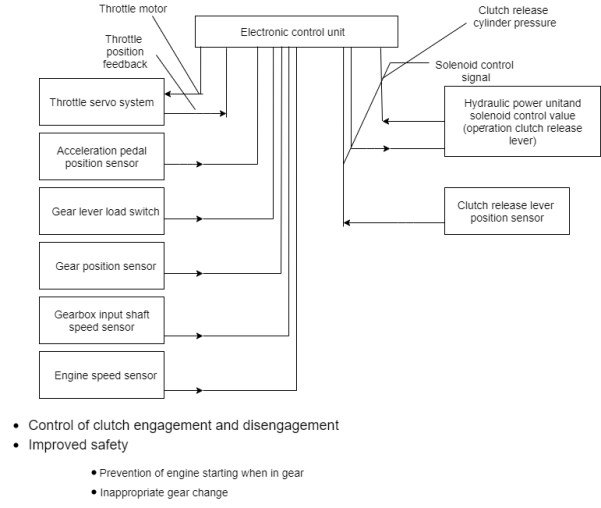
Fig: Block diagram of an automatic clutch and throttle system
Industrial Application (Sheet manufacturing process)
The delivery mechanism supplies material through a narrow slit to form a continuous sheet or web of material. The narrow slit is controlled by an array of actuators, which control the formation of the sheet. Specifically, a movement in one of the actuators in the array influences the product over an area in the region of the actuator’s spatial location and the sheet’s temporal location. The spatial direction across the process is called the cross direction (CD) and the direction of material movement is the machine direction (MD). The properties of the product are normally measured by a scanning device, which measures the web properties by a zigzag path. Scanning sensors of this form are the current industry standard with the dominant manufacturers being ABB, Measurex/Honeywell and NDC/Infrared Engineering.
Key takeaway
A typical Media centre consists of a television, a receiver with its speakers, and a cable or satellite box.
● The User interacts with the media centre using a remote control with the capabilities of turning on or off the system, changing the channel, volume and input (i.e., Cable, DVD player, etc.).
(a) Translational system
(b) Rotational system
Translational system
The motion that takes place along a straight line is called translational the forces that resist motion are
- Inertia: A body with mass ‘N’ acceleration ‘a’ will produce inertia fm(t)= malt N’ acceleration ‘a’ will produce inertia
fm(t)= M a(t)
In terms of velocity
Fm(t) = M dv(t)/dt
In terms of displacement
Fm(t)= Md2/dt2µt
- Damping force: The damping force is proportional to velocity for vis case function
F0(t) = B(t) = B dx(t) /dt
B Damping coefficient N/M sec
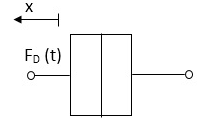
Fig: Damping Force
- Spring force: A spring stores potential energy. The releasing force of a string is proportional to the displacement.
Fk(t)  x(t)
x(t)
Fk(t) = k x (t)

Fig: Spring Constant
Fk(t) = k 
K = string constant N/m.
(b)Rational System: The motion of a body about a fixed axis is called as Rotational motion The types of torques which can resist the motion are
(i) Inertial Torque: The inertial torque is the product of moment of inertia I and angular acceleration.
TI(t) = J (t)
(t)
TI(t) = Jd/dt w(t)
TI(t) = Jd2ø(t)/dt2(N-m)
W (t) – Angular velocity
Ø(t) = Angular displacement
(ii) Damping Torque: it is product of damping efficient B and angular velocity w T0 (t) = B w(t)
T0(t) = B d/dt ø(t)
(iii) Spring Torque: It is the product of torsional stiffness and angular displacement
Tø(t) = k ø(t)
K = N.m/rad

Fig: Rotational Spring Constant
D’Alembert’s Principle
For anybody, the algebraic sum of externally applied forces and the forces resisting motion in any given direction is zero.
Ex.
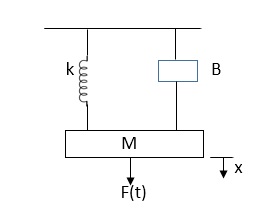
Fig: Mechanical System
In above figure applying D’Alembert’s principle to write the equation of motion
As force f(t) acts downwards all other forces (of k, B, x) acts Opposite to it to considering f(t) as the and all other forces negative.
F(t)+fm (t) + fD(t) +fx(t) =0
f(t)- M d2x(t)/dt2+B dx(t)/dt +x(t)
Example-1 Draw the free body diagram and write the differential equation for system below.
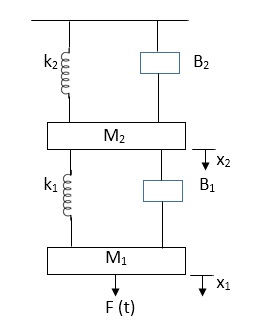
Soln: The free body diagram for M1 will be
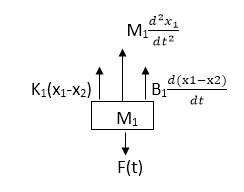
Fig: FBD for Mechanical System
F(t) = M1 d2/dt2x1+ B1 d/dt (x1-x2) + k1(x1-x2)
Similarly, for M2we have
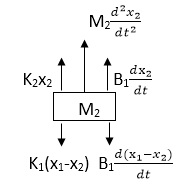
Fig: FBD for Mechanical System
K1(x1-x2) + B1d/dt(x1-x2) = k2x2+M2d2/dt2+B2dx2/dt
Transfer function of Thermal System:
List of symbols used in thermal system.
q = Heat flow rate, Kcal/sec.
θ1 = Absolute temperature of emitter, °K.
θ2 = Absolute temperature of receiver, °K.
∆θ = Temperature difference, °C.
A = Area normal to heat flow, m²
K = Conduction or Convection coefficient; Kcal/sec-°C.
Kr = Radiation coefficient, Kcal/sec-°C.
H = K/A=Convection coefficient, Kcal/m2-sec-°C.
H = Thermal conductivity, K cal/m-sec-°C.
∆X = Thickness of conductor, m
R = Thermal resistance, °C-sec/Kcal
C = Thermal capacitance, Kcal/°C
Thermal systems are those that involve the transfer of heat from one substance to another. There are three difference ways of heat flow from one substance to another. They are conduction, convection and radiation.
Consider a simple thermal system shown in the below figure. Let us assume that the tank is insulated to eliminate heat loss to the surrounding air, there is no heat storage in the insulation and liquid in the tank is kept at uniform temperature by perfect mixing with the help of a stirrer. Thus, a single temperature is used to describe the temperature of the liquid in the tank and of the out flowing liquid. The transfer function of thermal system can be derived as shown below.

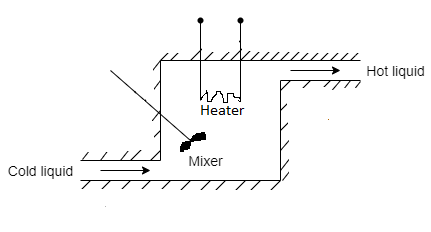
Fig: Transfer function of thermal system
Transfer function of Fluid function:
The most frequently used hydraulic device in control system is hydraulic motor-pump set. It consists of a variable stroke hydraulic pump and a fixed stroke hydraulic motor as shown in the below figure. The device accepts a linear displacement (stroke length) input and delivers a large output torque.
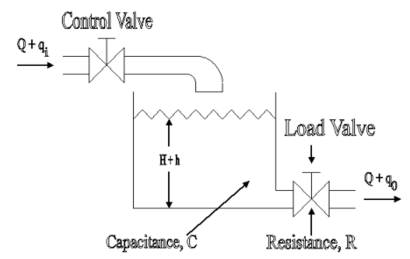
The hydraulic motor is controlled by the amount of oil delivered by the pump. By mechanically changing the pump stroke, the oil delivered by the pump is controlled. Like in a DC generator and dc motor, there is no essential difference between hydraulic pump and motor. In a pump the input is mechanical power and output is hydraulic power and, in a motor, it is vice versa.
Let qp = Rate at which the oil flows from the pump
Qm = Oil flow rate through the motor
q = Leakage flow rate
Qc = compressibility flow rate
x = Input stroke length
θ = Output angular displacement of motor
P = Pressure drops across motor
Oil flow rate through motor, qm = Km dt
Where Km = Motor displacement constant.
Leakage flow rate, qi = Ki P
Where Ki = constant.
Compressibility flow rate, qc = Kc dP/dt
Where Kc = Coefficient of compressibility.
In hydraulic systems, normally Kc << Km, therefore, Put Kc = 0 in above equation.
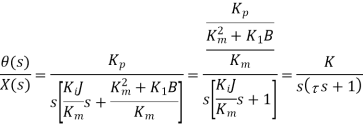
Where  and
and 
The above equation is the required transfer function of hydraulic system.
Key takeaway
D’Alembert’s Principle
For anybody, the algebraic sum of externally applied forces and the forces resisting motion in any given direction is zero.
Ex.
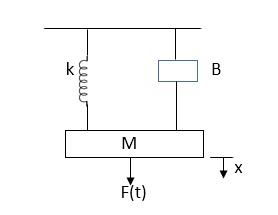
Fig 6 Mechanical System
In above figure applying D’Alembert’s principle to write the equation of motion
As force f(t) acts downwards all other forces (of k, B, x) acts Opposite to it to considering f(t) as the and all other forces negative.
F(t)+fm (t) + fD(t) +fx(t) =0
f(t)- M d2x(t)/dt2+B dx(t)/dt +x(t)
Poles and Zeros of a transfer function are the frequencies for which the value of the denominator and numerator of transfer function becomes zero respectively. The values of the poles and the zeros of a system determine whether the system is stable, and how well the system performs. Control systems, in the most simple sense, can be designed simply by assigning specific values to the poles and zeros of the system.

Let's say we have a transfer function defined as a ratio of two polynomials:
Where N(s) and D(s) are simple polynomials. Zeros are the roots of N(s) (the numerator of the transfer function) obtained by setting N(s) = 0 and solving for s.
The polynomial order of a function is the value of the highest exponent in the polynomial.
Poles are the roots of D(s) (the denominator of the transfer function), obtained by setting D(s) = 0 and solving for s. Because of our restriction above, that a transfer function must not have more zeros than poles, we can state that the polynomial order of D(s) must be greater than or equal to the polynomial order of N(s).
Effect of poles and zeros
As s approaches a zero, the numerator of the transfer function (and therefore the transfer function itself) approaches the value 0. When s approaches a pole, the denominator of the transfer function approaches zero, and the value of the transfer function approaches infinity. An output value of infinity should raise an alarm bell for people who are familiar with BIBO stability. We will discuss this later.
As we have seen above, the locations of the poles, and the values of the real and imaginary parts of the pole determine the response of the system. Real parts correspond to exponentials, and imaginary parts correspond to sinusoidal values. Addition of poles to the transfer function has the effect of pulling the root locus to the right, making the system less stable. Addition of zeros to the transfer function has the effect of pulling the root locus to the left, making the system more stable.
Key takeaway
Control systems, in the most simple sense, can be designed simply by assigning specific values to the poles and zeros of the system.

Let's say we have a transfer function defined as a ratio of two polynomials:
Where N(s) and D(s) are simple polynomials. Zeros are the roots of N(s) (the numerator of the transfer function) obtained by setting N(s) = 0 and solving for s.
A stable system always gives bounded output for bounded input and the system is known as BIBO stable
A linear time invariant (LTI) system is stable if,
The system is BIBO stable
In absence of the input the output tends towards zero
For system;
1)


For R(s) = 1
C(S) = 
R (t) =  (t) C (t) = t
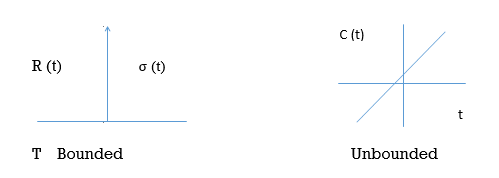
Fig 14 Input and output for 
So, system unstable.
Eg.2

[R(s) = 1]
 =
= 
C(t) = e-10t C(t)
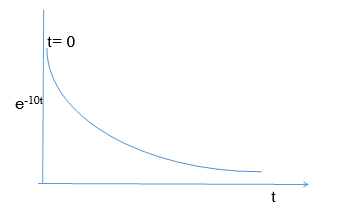
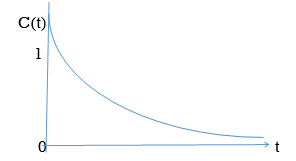
Fig: BIBO stable figure
Effect of location of Poles on stability
A) Real and negative G(s)= 
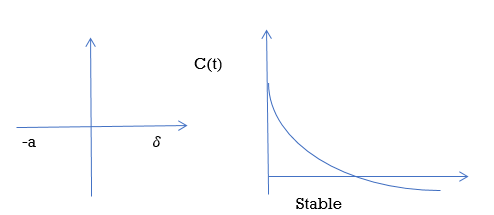
Fig: Output for G(s)= 
Stable
B) Poles on right half of S- plane
G(s) = 
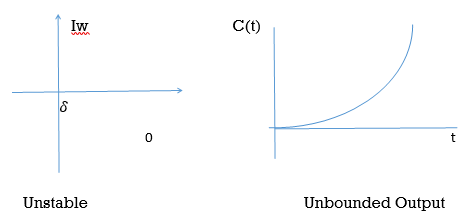
Fig: Input and Output for G(s) = 
(C)Poles at origin
G(s)=
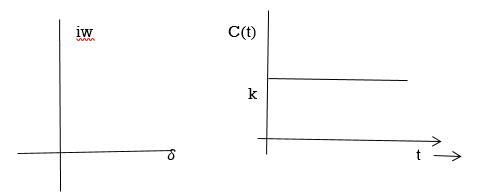
Marginally stable
Fig: Input and output for G(s)=
4) Complex poles on left half of S-plane
S1, S2= -α ± iw
 =
= 
C(t) = k e- αt Cos wt
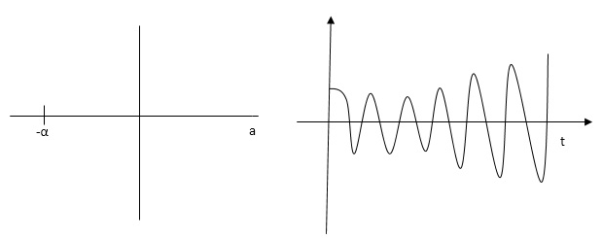
Fig: Pole location and output for C(t) = k e- αt Cos wt
At t - ∞ C(t) – 0 so, system stable
5) Complex poles on right half of S-plane
S1, S2 = α ± iw.
C(t) = k eαt COS wt.
C(t) increases exponentially with t ∞
So, unstable.
6) Poles on iw axis:
S1, S2 = ± iw.
C(t) = k COS wt.
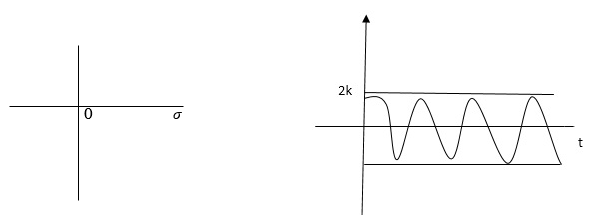
Fig: Output response of C(t) = k COS wt.
The system is marginally stable than sustained oscillations.
Key takeaway
Consider a system with characteristic equation
aoSm + a1 Sm-1 ……………..am=0.
1) All the coefficients of above equation should have same sign.
2) There should be no missing term.
3) The above two condition are necessary but not sufficient condition for stability
It states that the system is stable if and only if all the elements is the first column have the same algebraic sign. If all elements are not of the same sign, then the number of sign changes of elements in first column equals the number of roots of the characteristic equation in the right half of S-plane.
Consider the following characteristic equation:
a0 Sn + a1 Sn-1 ………….an = 0 where a0, a1,,,,,,,,,,,,,,,,,,,,an have same sign and are non-zero.
Step1 Arrange coefficients in rows
Row1 ao a2 a4
Row2 a1 a3 a5
Step2 Find third row from above two rows
Row1 a0 a2 a4
Row2 a1 a3 a5
Row3 a1 a3 a5
a1 = 
 =
= 
a3 = 
 =
= 
Continue the same procedure to find new rows.
Q1) For the given polynomials below determine the stability of the system
S4+2S3+3S2+4S+5=0
Arranging Coefficient in Rows.
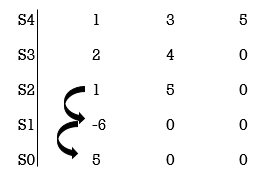
For row S2 first term
S2 =  = 1
= 1
For row S2 Second term
S2 =  = 5
= 5
For row S1:
S1 =  = -6
= -6
For row S0
S0 =  = 5
= 5
As there are two sign changes in the first column, So there are two roots or right half of S-plane making system unstable.
Q2. Using Routh criterion determine the stability of the system with characteristic equation S4+8S3+18S2+16S+S = 0
Sol: - Arrange in rows.
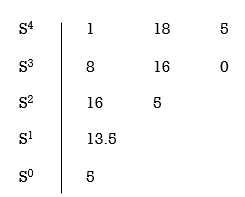
For row S2 first element
S1 =  = 16
= 16
Second terms =  = 5
= 5
For S1
First element =  = 13.5
For S0
First element =  = 5
= 5
As there is no sign change for first column so all roots are is left half of S-plane and hence system is stable.
Special Cases of Routh Hurwitz Criterions
- When first element of any row is zero.
In this case the zero is replaced by a very small positive number E and rest of the array is evaluated.
E.g. (1) Consider the following equation
S3+S+2 = 0
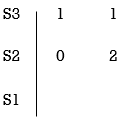
Replacing 0 by E
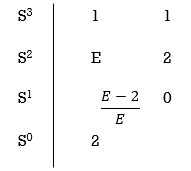
Now when E  0, values in column 1 becomes
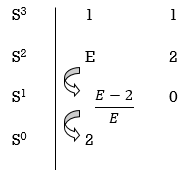
Two sign changes hence two roots on right side of S-plans
II) When any one row is having all its terms zero.
When array one row of Routh Hurwitz table is zero, it shown that the X is attests one pair of roots which lies radially opposite to each other in this case the array can be completed by auxiliary polynomial. It is the polynomial row first above row zero.
Consider following example
S3 + 5S2 + 6S + 30
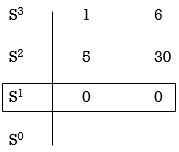
For forming auxiliary equation, selecting row first above row hang all terms zero.
A(s) = 5S2 e 30
 = 10s e0.
Again, forming Routh array
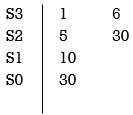
No sign change in column one the roots of Auxiliary equation A(s)=5s2+ 30-0
5s2+30 = 0
S2 α 6= 0
S = ± j 
Both lie on imaginary axis so system is marginally stable.
Q3. Determine the stability of the system represent by following characteristic equations using Routh criterion
1) S4 + 3s3 + 8s2 + 4s +3 = 0
2) S4 + 9s3 + 4S2 – 36s -32 = 0
1) S4+3s3+8s2+4s+3=0
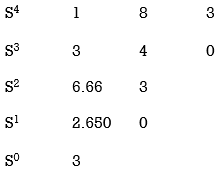
No sign change in first column to no rows on right half of S-plane system stable.
2) S4+9S3+4S2-36S-32 = 0
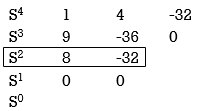
Special case II of Routh Hurwitz criterion forming auxiliary equation
A1 (s) = 8S2 – 32 = 0
 = 16S – 0 =0
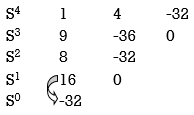
One sign change so, one root lies on right half S-plane hence system is unstable.
Q4. For using feedback open loop transfer function G(s) = 
Find range of k for stability
Soln: - Findlay characteristics equation.
CE = 1+G (s) H(s) = 0
H(s) =1 using feedback
CE = 1+ G(s)
1+  = 0
= 0
S(S+1) (S+3) (S+4) +k = 0
(S2+5) (S2+7Sα12) αK = 0
S4α7S3α1252+S3α7S2α125αK = 0
S4+8S3α19S2+125+k = 0
By Routh Hurwitz Criterion
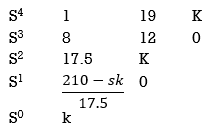
For system to be stable the range of K is 0< K <  .
.
Q5. The characteristic equation for certain feedback control system is given. Find range of K for system to be stable.
Sol:
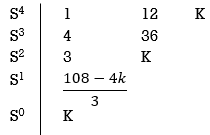
S4+4S3α12S2+36SαK = 0
For stability K>0
 > 0
> 0
K < 27
Range of K will be 0 < K < 27
Relative Stability:
Routh stability criterion deals about absolute stability of any closed loop system. For relative stability we need to shift the S-plane and the apply the Routh criterion.
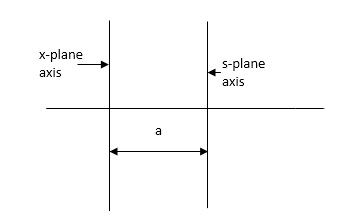
Fig 21 Location of Pole for relative stability
The above fig 10 shows the characteristic equation is modified by shifting the origin of S-plane to S1= - .
.
S = Z-S1
After substituting new valve of S =(Z-S1) applying Routh stability criterion, the number of sign changes in first column is the number of roots on right half of S-plane
Q6. Check if all roots of equation
S3+6S2+25S+38 = 0, have real poll more negative than -1.
Sol:

No sign change in first column, hence all roots are in left half of S-plane.
Replacing S = Z-1. In above equation
(Z-1)3+6(Z-1)2+25(Z-1) +38 = 0
Z3+ Z23+16Z+18=0

No sign change in first column roots lie on left half of Z-plane hence all roots of original equation in S-domain lie to left half 0f S = -1
Key takeaway
Special Cases of Routh Hurwitz Criterions
I) When first element of any row is zero.
In this case the zero is replaced by a very small positive number E and rest of the array is evaluated.
II) When any one row is having all its terms zero.
When array one row of Routh Hurwitz table is zero, it shown that the X is attests one pair of roots which lies radially opposite to each other in this case the array can be completed by auxiliary polynomial. It is the polynomial row first above row zero.
References:
- Alciatore & Histand, Introduction to Mechatronics and Measurement system, 4th Edition, Mc-Graw Hill publication, 2011
- Bishop (Editor), Mechatronics – An Introduction, CRC Press, 2006
- Mahalik, Mechatronics – Principles, concepts and applications, Tata Mc-Graw Hill publication, New Delhi
- C. D. Johnson, Process Control Instrumentation Technology, Prentice Hall, New Delhi