Unit - 5
Controllers
The controller is required when the system is unstable and the compensation will stabilize the system to improve its performance. There is one more situation when we require compensation that is when system is stable but not giving the proper performance. The type-2 or higher systems are mostly unstable and require lead compensator so that the stability of such systems can be increased. The techniques are discussed in detail below.
The important uses of the controllers include:
- They decrease the steady state error and hence improve the steady-state accuracy.
- The improvement in steady state accuracy results in improvement of system stability.
- Controllers also help in reducing the unwanted offsets produced by the system.
- They also help in controlling the maximum overshoot of the system.
- The noise signals produced by the system are also reduced by using controllers.
- The over damped system has slow response, Controllers helps to improve and increase the response.
Proportional (P) control action
Proportional control is a control system technology based on a response in proportion to the difference between what is set as a desired process variable (or set point) and the current value of the variable.
Proportional control is a control system technology based on a response in proportion to the difference between what is set as a desired process variable (or set point) and the current value of the variable.
Proportional control is used where maintaining a process variable to a tighter tolerance and timely responsiveness are required. Control systems in many industrial settings as well as some smart devices use proportional control.
Proportional control involves fine-grained control through a feedback mechanism. In comparison to the on-off control (also known as bang-bang control) of a traditional bi-metallic strip-switched domestic thermostat, devices that use proportional control are more complex. The variable response is linearly proportional to the differential between a process variable and the desired optimum set point. This means that the response of the controller and the mechanism for affecting the variable make a greater response for a greater differential and a smaller change for a smaller differential.
Integral (I) control action
Action by a control mechanism that makes changes to the inputs of a manufacturing process based on the accumulated error over a period of time. Integral action controllers are often used in conjunction with proportional controllers, which make corrective changes in proportion to the amount of error in an input, in order make input adjustments faster and more accurate
Integral control is the control mode where the controller output is proportional to the integral of the error with respect to time, i.e., Controller output ∞ integral of error with time and so we can write:
I controller output = KI × integral of error with time
Where K1 is the constant of proportionality and, when the controller output is expressed as a percentage and the error as a percentage, has units of s-1.
To illustrate what is meant by the integral of the error with respect to time, consider a situation where the error varies with time in the way shown in Figure 5.16. The value of the integral at some time t is the area under the graph between t = 0 and t. Thus, we have: controller output ∞ area under the error graph between t = 0 and t
Derivative (D) control action
Derivative control is the reaction to the rate at which the error has been changing, and it slows the rate of change of the controller output.
When derivative control is applied, the controller senses the rate of change of the error signal and contributes a component of the output signal that is proportional to a derivative of the error signal. Thus

Where Td is a time rate constant.
PI control system
The function of a P.I controller.
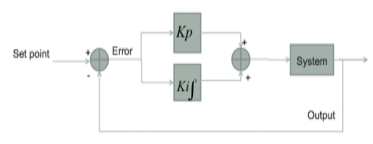
Fig 1 PI Controller
A P.I Controller is a feedback control loop that calculates an error signal by taking the difference between the output of a system, which in this case is the power being drawn from the battery, and the set point. The set point is the level at which we’d like to have our system running, ideally we’d like our system to be running near max power (990W) without causing the limiter to engage.
It is important to point out that due the complexity of the electronic components within the circuit path (i.e., ESC, power limiter, and motor) I was not able to accurately create model (transfer function) for the system. Having a transfer function would have allowed me to simulate the system in a software package such as MATLAB/Simulink and assist me in finding the right proportional and integral constant parameters for the controller. Unfortunately, due to the lack of a model, the parameters were obtained via a trial-and-error format.
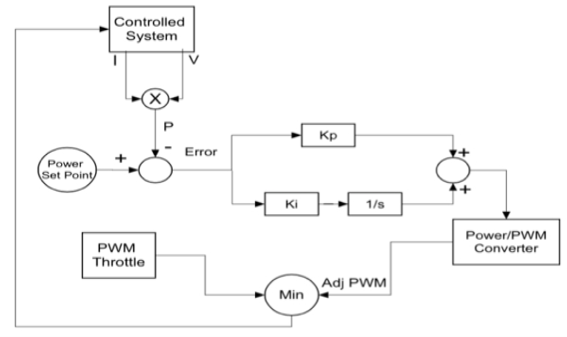
Fig 2 Software level block diagram
The figure above shows a software level block diagram of the P.I control algorithm. The controller receives a current and voltage measurement which it then uses to calculate the power being drained from the battery. Once the power is measured the error signal is calculated by taking the difference between the set point and the power measured. The error signal then goes into the P.I control loop where it gets multiplied by the proportional and integral constant. The output of the P.I control is a power value and in order to convert it to a quantity that is comparable to that of the control signal, it goes through a power to PWM signal converter. The adjusted PWM signal (output of PWM converter) then gets compared with the throttle signal, which is also a PWM signal, that is being sent by pilot, the least of the two gets sent to the controlled system. The controlled system block encompasses the battery, motor, speed controller, and limiter.
PD control system
The proportional derivative controller produces an output, which is the combination of the outputs of proportional and derivative controllers.
Therefore, the transfer function of the proportional derivative controller is
Kp + KdS
The block diagram of the unity negative feedback closed loop control system along with the proportional derivative controller is shown in the following figure.

Fig 3 PD Controller
The proportional derivative controller is used to improve the stability of control system without affecting the steady state error.
PID control system
The proportional integral derivative controller produces an output, which is the combination of the outputs of proportional, integral and derivative controllers.
u(t)=KPe(t)+KI∫e(t)dt+KDde(t)dt
Apply Laplace transform on both sides -
U(s)=(KP+KIs+KDs) E(s)
U(s)E(s)=KP+KIs+KDs
Therefore, the transfer function of the proportional integral derivative controller is
KP+KIs+KDs.
The block diagram of the unity negative feedback closed loop control system along with the proportional integral derivative controller is shown in the following figure.

Fig 4 PID Controller
The proportional integral derivative controller is used to improve the stability of the control system and to decrease steady state error.
Key takeaway
CL Response | Rise Time | Overshoot | Settling Time | S-S Error |
 | Decrease | Increase | Small Change | Decrease |
 | Decrease | Increase | Increase | Eliminate |
 | Small Change | Decrease | Decrease | Small Change |
Examples
Que) The block diagram of a system using PI controllers is shown in the figure 14 Calculate:
(a). The steady state without and with controller for unit step input?
(b). Determine TF of newly constructed sys. With controller so, that a CL Poles is located at -5?

(a). Without:
C(S)/R(S) = 0.2/ (S + 1)
C(S) = R(S) 0.2/ (S + 1) + 0.2
For unit step
Ess = 1/1 + Kp
Kp = lt G(S)
S 0
= lt 0.2/ (S + 1)
S 0
Kp = 0.2
Ess = 1/1.2 = 5/6 = 0.8
(b). With controller:
Gc(S) = Kp + Ki/S
G’(S) = Gc(S). G(S)
= (Kp + Ki/S )0.2/ (S + 1)
= (KpS + Ki)0.2/S (S + 1)
Ess = 1/1 + Kp = 0
So, the value of ess is decreased.
(b). Given
Kpi/Kp = 0.1
G’(S) = (Kp + Ki/S) (0.2/S + 1)
= (KpS + Ki)0.2/S (S + 1)
As a pole is to be added so, we have to examine the CE,
1 + G’(S) = 0
1 + (Kp + Ki)0.2/S (S + 1) = 0
S2 + S + 0.2KpS + 0.2Ki = 0
S2 + (0.2Kp + 1) S + 0.2Ki = 0
Given,
Kpi = 0.1Ki
Kp = 10Ki
S2 + (2Ki + 1) S + 0.2Ki = 0
Pole at S = -5
25 + (2Ki + 1) (-5) + 0.2Ki = 0
-10Ki – 5 + 25 + 0.2Ki = 0
-9.8Ki = -20
Ki = 2.05
Kp = 10Ki
= 20.5
Now,
G’(S) = (KpS + Ki) (0.2)/S (S + 1)
= (20.5S + 2.05) (0.2)/S (S + 1)
G’(S) = 4.1S + 0.41/S (S + 1)
Q. The block diagram of a system using Pd controller is shown, the PD is used to increase ξ to 0.8. Determine the T.F of controller?

(1). Kp = 1
Without controller:
C(S)/R(S) = 16/S2 + 1.6S + 16
wn = 4
2 ξwn = 16
ξ = 1.6/2 x 4 = 0.2
(b). With derivative:
ξS = 0.2 to 0.8
Undamped to critically damped,
G’(S) = (1 + KdS) (16)/ (S2 + 1.6S)
CE:
S2 + 1.6S + 16(1 + KdS) = 0
S2 + (1.6 + Kd)S + 16 = 0
2 ξwn = 1.6 + Kd1.6
wn = 4
ξS = 0.8
2 x 4 x 0.8 = 1.6 + Kd1.6
6.4 – 1.6 = Kd1.6
4.8/16 = Kd
Kd = 0.3
TF = (1 + 0.3S)16/S (S + 16)
- Main premise of the feedforward control: a model of the plant is known
- Model-based design of feedback control - the same premise
- The difference: feedback control is less sensitive to modeling error
- Common use of the feedforward: cascade with feedback
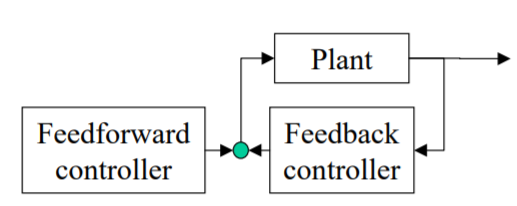
Fig 5 Feed forward system
The design criteria are summarized in a concise form so that they can be applied in general. Adherence to these criteria ensures that feedforward control is used when appropriate. The first two items in the table address the application of feedforward control. Naturally, only when feedback control does not provide acceptable control performance is an enhancement like feedforward control employed. The second criterion requires that an acceptable measured feedforward variable be available or that it can be added at reasonable cost.
Feedforward control design criteria
Feedforward control is desired when
1. Feedforward control does not provide satisfactory control performance.
2. A measured feedforward variable is available.
A feed forward variable must satisfy the following criteria
3. The variable must indicate the occurrence of an important disturbance.
4. There must not a casual relationship between the manipulated and feedforward variables.
5. The disturbance dynamics must not be significantly faster than the manipulated-output variable dynamics (when feedback control is also present).
Fig 6 Table for Feed Forward Criterion
A potential feedforward variable must satisfy three criteria. First, it must indicate the occurrence of an important disturbance; that is, there must be a direct, reproducible correlation between the process disturbance and the measured feed forward variable, and the measured variable should be relatively insensitive to other changes in operation. Naturally, the disturbance must be important (i.e., change frequently and have a significant effect on the controlled variable), or there would be no reason to attenuate its effect. Second, the feedforward variable must not be influenced by the manipulated variable, because the feedback principle is not used.
Note that this requirement provides a clear distinction between variables used for cascade and feedforward. Finally, the disturbance dynamics should not be faster than the dynamics from the manipulated to the controlled variable. This final requirement is related to combined feedforward-feedback control systems. Should the effect of the disturbance on the controlled variable be very fast, feedforward could not affect the output variable in time to prevent a significant deviation from the set point. As a result, the feedback controller would sense the deviation and adjust the manipulated variable. Unfortunately, the feedback adjustment would be in addition to the feedforward adjustment; thus, a double correction would be made to the manipulated variable; remember, the feedforward and feedback controllers are independent algorithms.
The double correction would cause an overshoot in the controlled variable and poor control performance. In conclusion, feedforward control should not be used when the disturbance dynamics are very fast and PID feedback control is present. Naturally, if feedback is not present (perhaps due to the lack of a real-time sensor), feedforward can be applied regardless of the disturbance dynamics.
Manual PID tuning is done by setting the reset time to its maximum value and the rate to zero and increasing the gain until the loop oscillates at a constant amplitude. (When the response to an error correction occurs quickly a larger gain can be used. If response is slow a relatively small gain is desirable). Then set the gain of the PID controller to half of that value and adjust the reset time so it corrects for any offset within an acceptable period. Finally, increase the rate of the PID loop until overshoot is minimized.
To tune a PID use the following steps:
- Set all gains to zero.
- Increase the P gain until the response to a disturbance is steady oscillation.
- Increase the D gain until the oscillations go away (i.e., it's critically damped).
- Repeat steps 2 and 3 until increasing the D gain does not stop the oscillations.
- Set P and D to the last stable values.
- Increase the I gain until it brings you to the set point with the number of oscillations desired (normally zero but a quicker response can be had if you don't mind a couple oscillations of overshoot)
They proposed the rules for determining values of proportional gain kp, derivative time Td and integral time Ti. They have proposed from (1) methods.
1) First Method: The basic PID controller is shown in figure below. In this method a unit step response of a plant. Is obtained if the plant has neither integrator non-dominant complex conjugal poles, then the output step curve is of shape s. As shown below. These curves are generated experimentally.
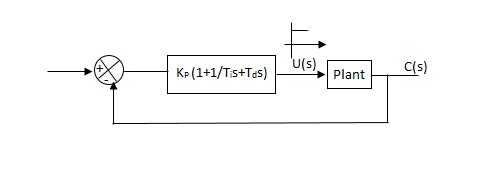
Fig 7 PID Controller
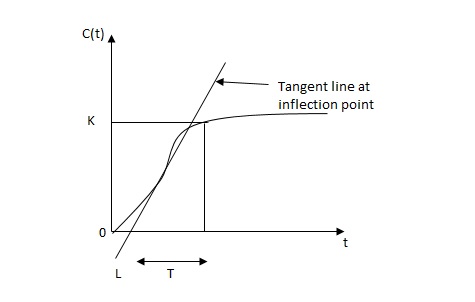
FIG 8 S-Shaped Response Curve
 delay time -L calculated by drawing
Time constant -j tangent
c(s) / l(s) = ke-l1s / ts+1
The values of KP, Ti and td should be set according to the table suggested by Ziegler Nichols tuning rules shown below.
Type of controller
Types of controllers | Kp | Ti | Td |
|
P | T/L | 00 | 0 |
|
PI | 0.9T/L | L/0.3 | 0 |
|
PID | 1.2T/L | 2L | 0.5L |
|
Controller gain Gc(s)= kp(1+1/Tis+Tds)
= 1.2T / L (1+1 / 2LS+0.5 LS)
= 1.2t/l+0.6t / L2S+0.6TS
= 0.6T(2/L+1/L2S+S)
Gc(s) = 0.6 T(S+1/L)2/S
Thus, the PID controller has a pole at the origin and double zeros at S=-1/ L
Second Method
1) Firstly, set Ti= and Td=0
2) Use proportional control action only, increase kp from 0 to Kcr (Critical value).
3)Then Kcr and pcr (period) are determined experimentally.

Fig 9 closed loop with proportional controller
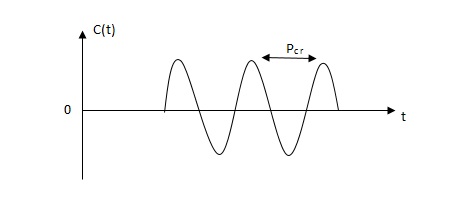
Fig 10 Sustained oscillation with period pcr.
4)For this method Ziegler Nichols suggested new set of values for kp, ti and td shown in table below.
Types of controllers | KP | TI | Td |
P | 0.5Kcr |  | 0 |
PI | 0.45 KCR | 1/1.2PCR | 0 |
PID | 0.6KCR | 0.5PCR | 0.125PCR |
|
|
|
|
GC(S) = KP (1.1/Tis+Tds)
=0.6 Kcr(1+1/0.5PcrS+ 0.125 PCRS)
=0.075 KcrPcr(s+4/Pcr)2 / s
Thus, the PID controller has a pole at the origin and double zeros at s= -4/Pcr
Key takeaway
It is a PID tuning method for controlling and improving parameters like Kp, Ti and Td. They provide good regulation.
The Hydraulic system of interest to control engineers may be classified into,
1.Liquid Level system
2.Hydraulic devices
The liquid level system consists of storage tanks and connecting pipes. The variables to be controlled are liquid height in tanks and flow rate in pipes. The driving force is the relative difference of the liquid heights in the tanks. The Hydraulic devices are devices using incompressible oil as their working medium. In this we will be learning transfer function of hydraulic system.
These devices are used for controlling the forces and motions. The driving force is the high-pressure oil supplied by the Hydraulic pumps. Liquids are slightly compressible at high pressures.
In hydraulic system, the compressibility effects may be neglected and conservation of volume is used as the basic physical law. The variables of hydraulic system are volumetric flow rate, q and pressure, R The volumetric flow rate, q is through variable and it is analogous to current. The pressure, P is across variable and it is analogous to voltage.
Three basic elements of hydraulic systems are the Resistance, Capacitance and inertance. The liquid flowing out of a tank can meet the resistance in several ways. Liquid while flowing through a pipe meet with resistance due to the friction between pipe walls and liquid. Presence of valves, bends, coupling of pipes of different diameter also offer resistance to liquid flow.
The capacitance is an energy storage element and it represents storage in gravity field. The inertance represents fluid inertia and is derived from the inertia forces required to accelerate the fluid in a pipe. It is also an energy storage element. But the energy storage due to inertance element is negligible compared to that of capacitance element.
Consider the flow through a short pipe connecting two tanks. The Resistance, R for liquid flow in such a pipe or restriction, is defined as the change in the level difference, necessary to cause a unit change in the flow rate.
R = Change in level difference/Change in flow rate
The Capacitance, C of a tank is defined to the change in quantity of stored liquid necessary to cause in the potential (head).
C = Change in liquid stored/Change in head
A simple liquid level system is shown in the below figure with steady flow rate, Q and steady state head, H.
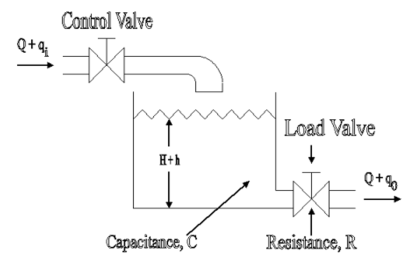
Fig 11 Liquid Level System
Let Q = Steady state flow rate (before any change has occurred)
Qi = Small deviation of inflow rate from its steady-state value
Qo = Small deviation of outflow rate from its steady-state value
H = Steady state head (before any change has occurred)
h = Small deviation of head from its steady state value
Let the system be considered linear. The differential equation governing the system is obtained by equating the change in flow rate to the amount stored in the tank. In a small time interval dt, let the change in flow rate be (qi - qo) and the change in height be dh.
Now, Change In storage = Change in flow rate
C dh = (qi - qo) dh
The resistance, R = 
Qo = h/R
On substituting for qo, we get,


The above equation is the differential equation governing the system. The term RC is the time constant of the system. On the Laplace's transform of above equation we get,


The above equation is the required transfer function of the Hydraulic system.
Pneumatic
With a pneumatic power supply an electric motor drives an air compressor. The air inlet to the compressor is likely to be filtered and via a silencer to reduce the noise level. A pressure-relief valve provides protection against the pressure in the system rising above a safe level. Since the air compressor increases the temperature of the air, there is likely to be a cooling system and to remove contamination and water from the air a filter with a water trap.
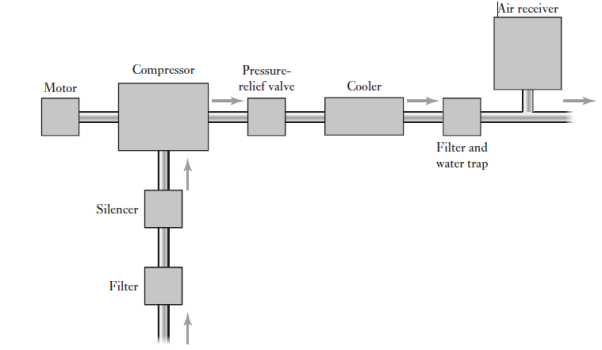
Fig 12 Pneumatic Power Supply
An air receiver increases the volume of air in the system and smoothed out any short-term pressure fluctuations. Commonly used air compressors are ones in which successive volumes of air are isolated and then compressed. Figure shows the basic form of compressor we might have the first stage taking air at atmospheric pressure and compressing it to, say, 2 bar and then the second stage compressing this air to, say, 7 bar. Reciprocating piston compressors can be used as a single-stage compressor to produce air pressures up to about 12 bar and as a multistage compressor up to about 140 bar.
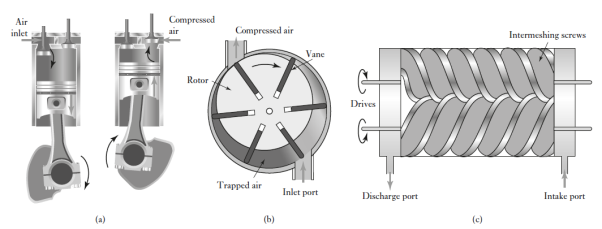
Fig 13 (a) Single-acting, single stage, vertical, reciprocating compressor, (b) rotary vane compressor, (c) screw compressor.
Typically, air flow deliveries tend to range from about 0.02 m3_min free air delivery to about 600 m3_min free air delivery; free air is the term used for air at normal atmospheric pressure. Another form of compressor is the rotary vane compressor. This has a rotor mounted eccentrically in a cylindrical chamber (Figure(b)). The rotor has blades, the vanes, which are free to slide in radial slots with rotation causing the vanes to be driven outwards against the walls of the cylinder. As the rotor rotates, air is trapped in pockets formed by the vanes and as the rotor rotates so the pockets become smaller and the air is compressed. Compressed packets of air are thus discharged from the discharge port. Single-stage, rotary vane compressors typically can be used for pressures up to about 800 kPa with flow rates of the order of 0.3 m3/min to 30 m3/min free air delivery. Another form of compressor is the rotary screw compressor (Figure(c)).
This has two intermeshing rotary screws which rotate in opposite directions. As the screws rotate, air is drawn into the casing through the inlet port and into the space between the screws. Then this trapped air is moved along the length of the screws and compressed as the space becomes progressively smaller, emerging from the discharge port. Typically, single-stage, rotary screw compressors can be used for pressures up to about 1000 kPa with flow rates of between 1.4 m3/min and 60 m3/min free air delivery.
Automotive Control
Automatic control becomes more and more important for the automobile industry. In application areas such as passenger safety, environmental protection and passenger comfort, control functions are implemented in the vehicle electronic control units. In the engine control unit for example, there are several algorithms to reduce emissions, to improve the engine power output and to protect against damage from engine failures.
Compensation of drivetrain oscillations and the adaptive control of automatic gear boxes are examples for applications in the drivetrain area. ABS control, suspension control and vehicle dynamic control increase the driveability of the vehicle and support the driver in dangerous situations. Airbag-systems with automatic recognition of seat occupancy improve passive safety of the passengers in case of an accident. Another large area of control applications are comfort functions like air-condition or navigation systems. Most of these functions require sophisticated signal processing and control algorithms, which are based on models for the system dynamics.
This term is used for the engine and transmission control systems. The engine control unit (ECU) aims to ensure that the engine operates at optimal conditions at all times and includes such items as fuel-injection control, carburettor control, spark-timing control, idle-speed control and anti-knock control. It does this by reading values from many sensors within the engine bay, interpreting the results and then adjusting engine actuators accordingly. Transmission control is primarily involved in automatic transmissions. Often a single engine control unit is used for both engine and transmission control. The engine control unit includes a microcontroller, with the operating software stored in EPROMs or flash memory
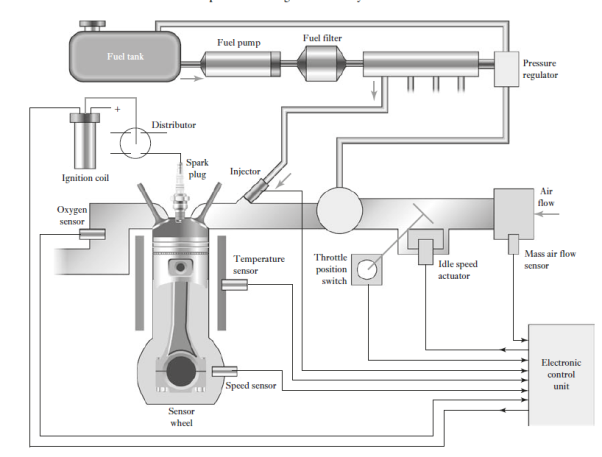
Fig 14 Engine control system
There are a number of control systems in an automobile, and a network is used to communicate information between them. The standard network used to allow microcontrollers and devices to communicate with each other is the controller area network (CAN).
The air–fuel ratio (AFR) is the mass ratio of air to fuel present in an internal combustion engine. If exactly enough air is provided to completely burn all of the fuel, the ratio is known as the stoichiometric mixture. For gasoline fuel, the stoichiometric air–fuel mixture is about 14.7:1 and so, for every 1 g of fuel, 14.7 g of air are required. The air–fuel equivalence ratio, λ (lambda), is the ratio of actual AFR to that at stoichiometry for a given mixture. Thus, if we have λ = 1.0, the mixture is at stoichiometry, for a rich mixture λ < 1.0, and for a lean mixture λ > 1.0. The exhaust gas oxygen sensor (EGO) is thus the key sensor in the engine fuel control feedback loop, producing a voltage output that is related to the amount of oxygen in the exhaust. The zirconium dioxide exhaust gas oxygen sensor is widely used. When hot, the zirconium dioxide element produces a voltage that depends on the amount of oxygen in the exhaust compared to that in the outside air. A stoichiometric field mixture gives an output of about 0.45 V, the voltage ranging from about 0.2 V when lean to 0.8 V when rich. The control system used with the lambda sensor is basically a PI controller of essentially a first-order engine system. Figure shows the basic system model. The engine can be modelled basically as a first-order system

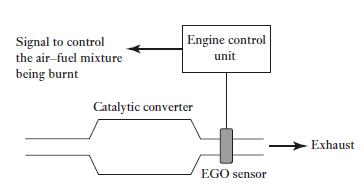
Fig 15 Lambda control circuit
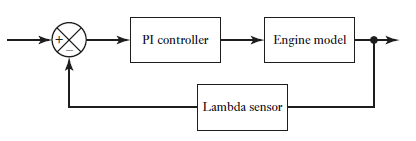
Fig 16 Lambda control system
The PI controller will have a transfer function Gc of KP + KI/s, where KP is the proportional control constant and KI the integral control constant. Thus, taking the lambda sensor to have a transfer function of 1, the closed loop control system will have an overall transfer function T(s) of

However, there is a time delay TL in the lambda sensor responding to a change in oxygen level, typically 50–500 ms, and so to take account of this the transfer function for the engine can be modified by introducing a delay term:

Key takeaway
Hydraulic fluid acts as a lubricant and coolant. Comparatively small sized hydraulic actuators can develop are forces or torques. Hydraulic actuators can be operated under continuous, intermittent, reversing, and called conditions without damage. Hydraulic actuators have a higher speed of response. They offer fast starts, stops and speed reversals. With availability of both linear and rotary actuators, the design has become more flexible.
Case Study
1) Car Park barriers
Consider the coin-operated barriers for a car park. The in-barrier is to open when the correct money is inserted in the collection box and the out-barrier is to open when a car is detected at the car park side of the barrier. Figure shows the types of valve systems that can be used to lift and lower the pivoted barriers.
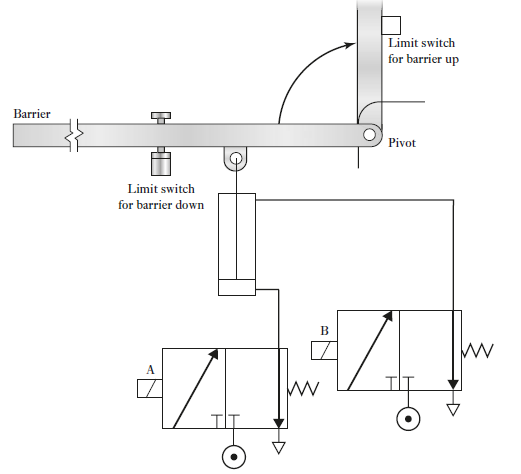
Fig 17 System for raising and lowering a barrier
When a current flows through the solenoid of valve A, the piston in a cylinder moves upwards and causes the barrier to rotate about its pivot and raise to let a car through. When the current through the solenoid of valve A ceases, the return spring of the valve results in the valve position changing back to its original position. When the current is switched through the solenoid of valve B, the pressure is applied to lower the barrier. Limit switches are used to detect when the barrier is down and also when fully up.
With two of the systems shown in Figure above, one for the entrance barrier and one for the exit barrier, and the connections to PLC inputs and outputs shown in Figure below
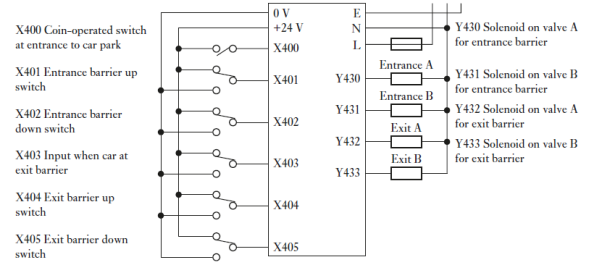
Fig 18 PLC Connections
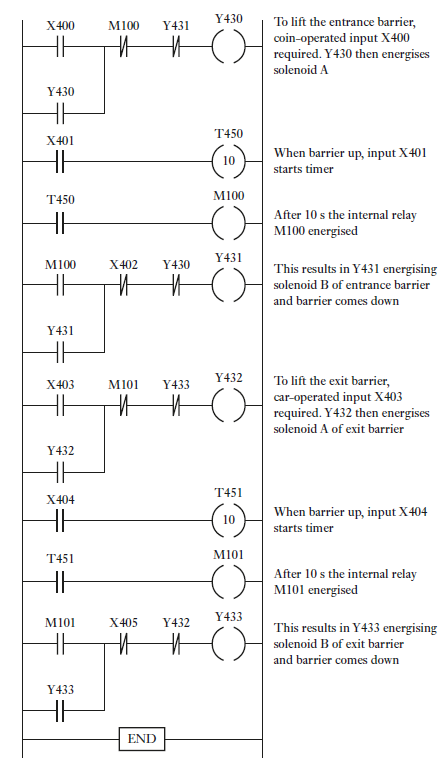
Fig 19 Ladder Program
2) Digital camera
A digital camera is one that captures images and stores them in a digital format in a memory card, unlike the earlier film cameras where the image was stored in an analogue form as a chemical change on film. Figure below shows the basic elements of a less expensive digital camera. When the photographer presses the shutter button to its first position, that of being partially depressed, a microcontroller calculates the shutter speed and aperture settings from the input from the metering sensor and displays them on the liquid crystal display (LCD) screen. At the same time, the microcontroller processes the input from the range sensor and sends signals to drive a motor to adjust the focusing of the lens. When the photographer presses the shutter button to its second position, that of being fully depressed, the microcontroller issues signal to change the aperture to that required, open the shutter for the required exposure time, and then, when the shutter has closed, process the image received at the image sensor and store it on the memory card. Also, when the shutter button is partially depressed, the automatic focus control system is used to move the lens so that the image will be in focus.
The light from the object being photographed passes through a lens system and is focused onto an image sensor. This is typically a charge-coupled device (CCD) consisting of an array of many small light-sensitive
Cells, termed pixels, which are exposed to the light passing through the lens when the electromechanical shutter is opened for a brief interval of time. The light falling on a cell is converted into a small amount of electric charge which, when the exposure has been completed, is read and stored in a register before being processed and stored on the memory card. The sensors are colour-blind and so, in order that colour photographs can be produced, a colour filter matrix is situated prior to the array of cells.
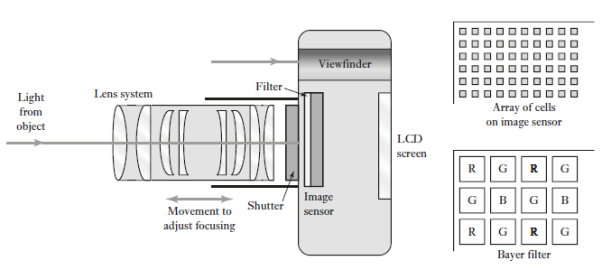
Fig 20 Components of digital camera
There are separate filters, blue, green or red, for each cell. The most common design for the matrix is the Bayer array. This has the three colours arranged in a pattern so that no two filters of the same colour are next to each other and there are twice as many green filters as either red or blue, this being because green is roughly in the centre of the visible spectrum and gives more detail. The result at this stage is a mosaic of red, green and blue pixels. The files of the results for the pixels at this stage are termed RAW files in that no processing has been done to them. In order to give the full range of colours for a particular pixel, an algorithm is used in which the colour to be allocated to a particular pixel is determined by taking into account the intensities of the colours of neighbouring pixels. The next stage in processing the signal is to compress the files so that they take up as little memory as possible. This way, more can be stored on a memory card than would be the case with RAW files. Generally, the compressed file format is JPEG, short for Joint Photographic Experts Group. JPEG compression uses the principle that in many photographs, many of the pixels in the same area are identical and so instead of storing the same information for each it can effectively store one and tell the others to just repeat it.
The exposure required is determined by a camera microcontroller in response to the output from a sensor such as a photodiode detecting the intensity of the light. It gives outputs which are used to control the aperture and the shutter speed. The aperture drive system with a digital camera can be a stepper motor which opens or closes a set of diaphragm blades according to the signal received from the microcontroller. The shutter mechanism used with a digital camera is generally of the form shown in Figure below. The shutter involves two sets of curtains, each being controlled by a spring-loaded
Latch. In the absence of a current to the electromagnet, the spring forces the latch over to a position which has the upper set of curtains down to overlap with the lower set. When a current is passed through an electromagnet it causes the latch to rotate and in doing so lifts the upper set of curtains. The lower set of curtains is initially held down at the bottom by a current through its electromagnet holding the latch. When the current through the lower curtain latch is switched off, the curtains rise. Thus, the opening of the aperture through to the image sensor is determined by the time between switching a current to the upper latch and switching it off at the lower latch.
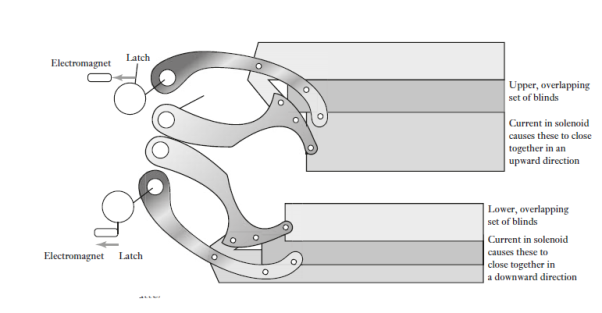
Fig 21 Shutter Mechanism
References:
- Alciatore & Histand, Introduction to Mechatronics and Measurement system, 4th Edition, Mc-Graw Hill publication, 2011
- Bishop (Editor), Mechatronics – An Introduction, CRC Press, 2006
- Mahalik, Mechatronics – Principles, concepts and applications, Tata Mc-Graw Hill publication, New Delhi
- C. D. Johnson, Process Control Instrumentation Technology, Prentice Hall, New Delhi