Unit - 4
Unified Modeling Language (UML)
1. UML can be described as the successor of object-oriented (OO) analysis and design.
2. An object contains both data and methods that control the data. The data represents the state of the object. A class describes an object and they also form a hierarchy to model the real-world system.
3. The hierarchy is represented as inheritance and the classes can also be associated in different ways as per the requirement.
4. Objects are the real-world entities that exist around us and the basic concepts such as abstraction, encapsulation, inheritance, and polymorphism all can be represented using UML.
5. UML is powerful enough to represent all the concepts that exist in object-oriented analysis and design. UML diagrams are representation of object-oriented concepts only. Thus, before learning UML, it becomes important to understand OO concept in detail.
Following are some fundamental concepts of the object-oriented world −
a) Objects − Objects represent an entity and the basic building block.
b) Class − Class is the blue print of an object.
c) Abstraction − Abstraction represents the behavior of an real world entity.
d) Encapsulation − Encapsulation is the mechanism of binding the data together and hiding them from the outside world.
e) Inheritance − Inheritance is the mechanism of making new classes from existing ones.
f) Polymorphism − It defines the mechanism to exists in different forms.
6. OO Analysis and Design OO can be defined as an investigation and to be more specific, it is the investigation of objects. Design means collaboration of identified objects.
7. Thus, it is important to understand the OO analysis and design concepts. The most important purpose of OO analysis is to identify objects of a system to be designed.
8. This analysis is also done for an existing system. Now an efficient analysis is only possible when we are able to start thinking in a way where objects can be identified. After identifying the objects, their relationships are identified and finally the design is produced.
The purpose of OO analysis and design can described as –
a) Identifying the objects of a system.
b) Identifying their relationships.
c) Making a design, which can be converted to executable using OO languages?
There are three basic steps where the OO concepts are applied and implemented. The steps can be defined as
OO Analysis → OO Design → OO implementation using OO languages
The above three points can be described in detail as −
9. During OO analysis, the most important purpose is to identify objects and describe them in a proper way. If these objects are identified efficiently, then the next job of design is easy.
10. The objects should be identified with responsibilities. Responsibilities are the functions performed by the object. Each and every object has some type of responsibilities to be performed. When these responsibilities are collaborated, the purpose of the system is fulfilled.
11. The second phase is OO design. During this phase, emphasis is placed on the requirements and their fulfilment. In this stage, the objects are collaborated according to their intended association. After the association is complete, the design is also complete.
12. The third phase is OO implementation. In this phase, the design is implemented using OO languages such as Java, C++, etc.
13. Role of UML in OO Design
UML is a modeling language used to model software and non-software systems. Although UML is used for non-software systems, the emphasis is on modeling OO software applications. Most of the UML diagrams discussed so far are used to model different aspects such as static, dynamic, etc. Now whatever be the aspect, the artifacts are nothing but objects.
Object Oriented Principles
The object model serves as the conceptual basis for object–oriented systems. In an object-oriented system, there are two types of elements.
Major Elements − By major, we mean that if a model lacks any of these elements, it is no longer considered object oriented. The four major components are as follows:
● Abstraction
● Encapsulation
● Modularity
● Hierarchy
Minor Elements − The term "minor" refers to components that are beneficial but not essential to the object model. The three minor components are as follows:
● Typing
● Concurrency
● Persistence
Abstraction
In OOP, abstraction refers to focusing on an element's or object's important qualities while ignoring its unnecessary or unintentional attributes. The most important characteristics are dependent on the context in which the thing is used.
The following is Grady Booch's definition of abstraction:
"In relation to the viewer's perspective, an abstraction signifies the key properties of an object that distinguish it from all other sorts of things and hence give crisply defined conceptual limits."
When creating a Student class, for example, the properties enrolment number, name, course, and address are included, while characteristics like pulse rate and size of shoe are removed because they are useless from the educational institution's standpoint.
Encapsulation
The process of encapsulating both properties and methods within a class is known as encapsulation. The internal information of a class can be hidden from the outer world through encapsulation. The class provides methods that enable user interfaces for interacting with the class's services.
Modularity
Modularity is the technique of breaking down an issue (software) into a set of modules in order to lessen the problem's overall complexity. Modularity is defined by Booch as:
"The property of a system split into a group of cohesive and loosely linked modules is modularity."
Encapsulation and modularity are inextricably related. Modularity can be thought of as a method of converting enclosed abstractions into real, physical modules with high internal cohesion and little inter–module interaction or coupling.
Hierarchy
"Hierarchy is the ranking or ordering of abstraction," says Grady Booch. A system can be built up of interconnected subsystems, which can have their own subsystems, and so on until the smallest level components are reached through hierarchy. It employs the "divide and conquer" strategy. Reusability of code is made possible through hierarchy.
Typing
A type, according to abstract data type theories, is a characterization of a set of elements. In OOP, a class is represented as a type with properties that are distinct from those of other kinds. The assumption that an object is an instance of a single class or type is enforced through typing. It further stipulates that things of different types cannot be interchanged in general, and can only be done in a very limited way if absolutely necessary.
The two types of typing are −
- Strong Typing
- Weak Typing
Concurrency
Concurrency in operating systems allows numerous tasks or processes to run at the same time. The term "single thread of control" refers to the existence of a single process in a system. Most systems, on the other hand, contain several threads, some of which are active, some of which are waiting for CPU, some of which are suspended, and some of which are terminated. Concurrent threads of control are intrinsically possible in systems with many CPUs; however, in systems with just one CPU, proper techniques are used to allocate equitable CPU time to the threads in order to support concurrency.
There are active and inactive objects in an object-oriented system. Active objects have their own control threads that can run in parallel with threads from other objects. The active items, as well as just sequential objects, synchronise with one another.
Persistence
An object exists for a specific amount of time and consumes memory space. The lifespan of an object in conventional programming was often the execution time of the programme that produced it. The object lifespan in files or databases is longer than the length of the process that created the object. Persistence is the property of an object that allows it to continue to exist after its creator has died.
UML is a modeling language. It may be used to visualize, specify, build, and document the artifacts of a software system. It provides a set of characters (e.g. Rectangles, lines, ellipses, etc.) to create a visual model of the system. Like any other language, UML has its own syntax (symbols and sentence formation rules) and symbolism. Also, we should clearly understand that UML is not a system design or development methodology, but can be used to document object-oriented design and analysis outcomes obtained using some methodology.
Origin of UML:
In the late 1980s and early 1990s, there was a generation of object-oriented design techniques and notations. Different software development houses were using different notations to document their object-oriented designs. These differing notations used, gave rise to a lot of confusion.
UML was developed to systematize the huge number of object-oriented modeling notations that existed and were used extensively in the early 1990s. The principles ones in use were:
- Object Management Technology
- Booch’s methodology
- Object-Oriented Software Engineering
- Odell’s methodology
- Shlaer and Mellor methodology
It is nonessential to say that UML has borrowed many theories from these modeling techniques. Especially, theories from the first three methodologies have been heavily drawn upon. UML was adopted by Object Management Group (OMG) as a de facto standard in 1997. OMG is an association of industries which tries to promote early formation of standards.
We shall see that UML contains an extensive set of characters and suggests building of many types of diagrams. It has profitably been used to model both large and small problems. The elegance of UML, its adoption by OMG, and a strong industry backing have helped UML find widespread approval. UML is now being used in a large number of software development projects worldwide.
Need of UML
- Complex applications need collaboration and planning from multiple teams and hence require a clear and concise way to communicate amongst them.
- Businessmen do not understand code. So UML becomes essential to communicate with non-programmers essential requirements, functionalities and processes of the system. A lot of time is saved down the line when teams are able to visualize processes, user interactions and static structure of the system.
UML is linked with object oriented design and analysis. UML makes the use of elements and forms associations between them to form diagrams.
Diagrams in UML can be broadly classified as:
Structural Diagrams – Capture static aspects or structure of a system. Structural Diagrams include: Component Diagrams, Object Diagrams, Class Diagrams and Deployment Diagrams.
Behavior Diagrams – Capture dynamic aspects or behavior of the system. Behavior diagrams include: Use Case Diagrams, State Diagrams, Activity Diagrams and Interaction Diagrams.
The image below shows the hierarchy of diagrams according to UML
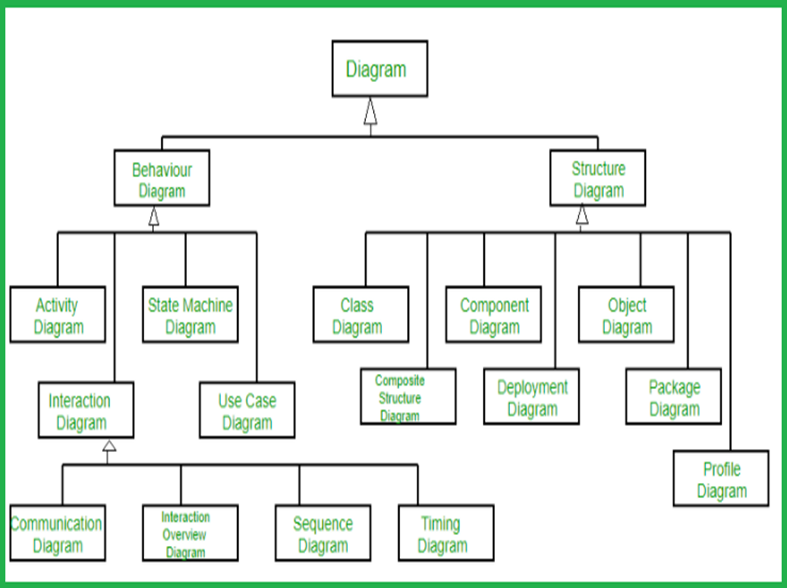
Fig 1: UML
Key takeaway
UML is a modeling language. It may be used to visualize, specify, build, and document the artifacts of a software system. It provides a set of characters (e.g. Rectangles, lines, ellipses, etc.) to create a visual model of the system. Like any other language, UML has its own syntax (symbols and sentence formation rules) and symbolism.
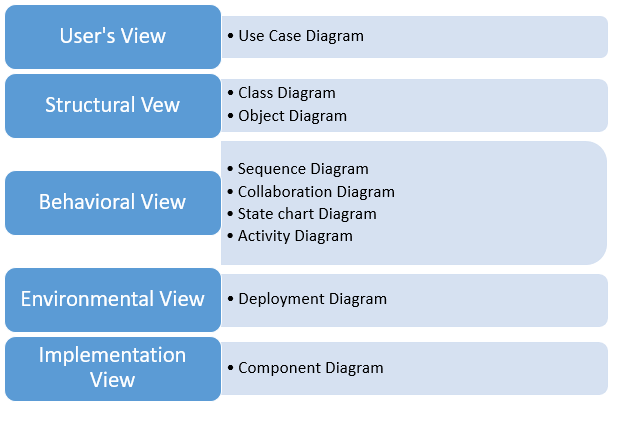
The UML seeks to visualise five different perspectives through various modelling diagrams. These are the five points of view:
- User's View
- Structural Views
- Behavioral Views
- Environmental View
- Implementation View
Now, these points of view only present distinct sets of people's thinking methodologies and expectations (which have been shaped by software). However, we must still use nine different types of UML diagrams to diagrammatically document the system requirements. These diagrams are separated into various categories. These categories are nothing more than the previously mentioned points of view.
The following are the many software diagrams based on the views they implement:
- User's view
This section covers the diagrams that define the user's part of the programme interaction. In this architecture, the software's internal workings are not described. This view includes the following diagrams:
● Use case Diagram
2. Structural view
Only the model's structure is explained in the structural view. This provides an approximation of the software's content. Internal working, on the other hand, is still undefined under this approach. This view comprises the following diagrams:
● Class Diagrams
● Object Diagrams
3. Behavioral view
The behavioural view offers graphics that illustrate the software's behaviour. These are the diagrams:
● Sequence Diagram
● Collaboration Diagram
● State chart Diagram
● Activity Diagram
4. Environmental view
The diagram that shows the software model's after-deployment behaviour may be found in the environmental view. The user interactions and software effects on the system are frequently explained using this diagram. The environmental model includes the following diagrams:
● Deployment diagram
5. Implementation view
The implementation view is made up of diagrams that represent the software's implementation. This point of view is related to the developer's point of view. This is the sole view where the software's internal workflow can be defined. The following is the diagram that this view contains:
Component Diagram
The distribution of these 9 software diagrams according to the five views is depicted in the image below:
Common Modeling Techniques
● Modeling the vocabulary of a system
● Modeling the distribution of responsibilities in a system
● Modeling Non Software Things
● Modeling Primitive types
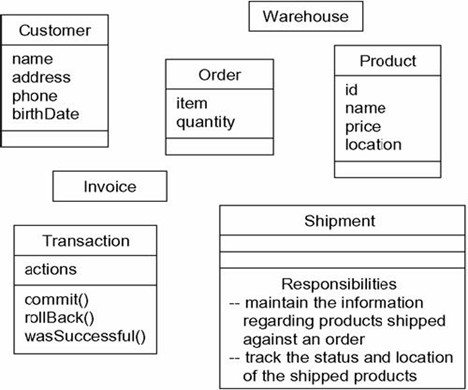
Modeling the vocabulary of a system
● Classes are used to represent abstractions derived from an issue.
● The best ways for finding these abstractions are the CRC card methodology or use-case based analysis tools.
To model the vocabulary of a system:
● Identify the terms used by users or implementers to characterise the issue or solution.
● Determine the duties that relate to each abstraction.
● Provide the properties and operations that are required to handle the obligations for each class.
Retail system
Modeling the distribution of responsibilities in a system
● The abstractions give a balanced set of responsibilities for modelling a system. (By this, we mean that no single class should be excessively huge or too little.)
● This balance of responsibilities is visualised and specified using the UML.
To model the distribution of responsibilities in a system
● Identify the set of classes that collaborate to carry out a specific action.
● Determine the scope of each class's responsibilities.
● Dividing classes with too many responsibilities into smaller abstractions and reallocating responsibilities so that each abstraction may stand on its own is a good idea.
MVC Architecture

Modeling the Distribution of Responsibilities in a System

Modeling Non Software Things
● As a class, model the objects that are abstracting. (For instance, a customer in a retail system.)
● Create a new construction block by defining new semantics with stereotypes.
● Consider modelling the object we're modelling as a node if it's some form of hardware that also contains software.
Modeling Non Software Things

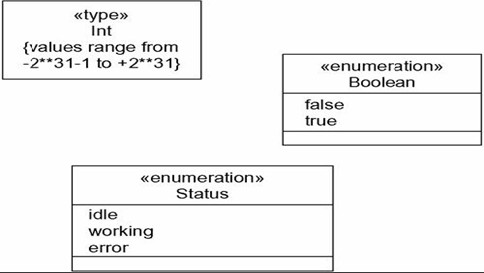
Modeling Primitive types
● Model the abstraction as a type or enumeration, which is represented with class notation and the appropriate stereotype.
● To indicate the range of values associated with a type, use constraints.
Modeling Primitive Types
Relationship
● A relationship is a link between two or more objects.
● Dependencies, generalisations, affiliations, and realisations are the four most significant relationships in object-oriented modelling.
● A relationship is represented graphically as a path, with different types of lines utilised to indicate the various relationships.

Dependency
● A dependency specifies that a change in the definition of one thing (for example, class SetTopController) may affect another thing that requires it (for example, class ChannelIterator), but not necessarily the other way around.
● A dependency is represented graphically as a dashed line pointing to the object on which it is dependent.
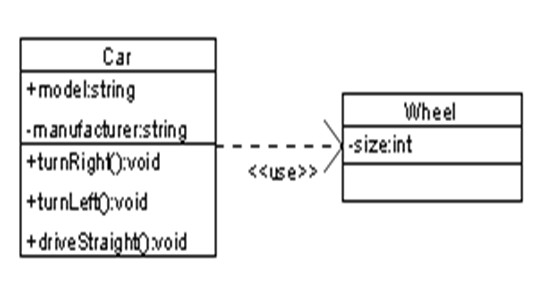
● A variety of stereotypes defined by UML can be applied to dependence relationships. There are 17 stereotypes like this.
● First, in class diagrams, there are eight archetypes that apply to dependence relationships between classes and objects.
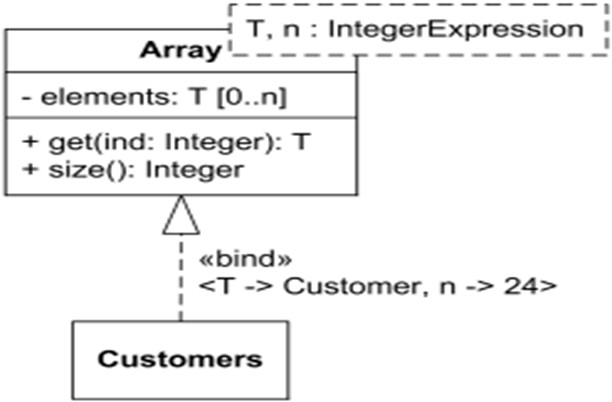
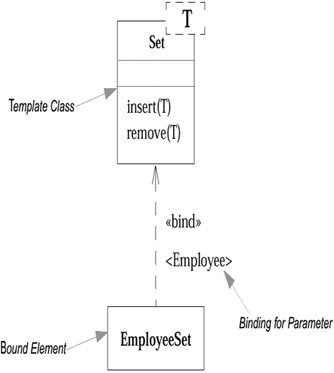
1. Bind: Indicates that the source will use the real arguments to instantiate the destination template.
Bind contains a list of actual arguments that correspond to the template's formal parameters.
Template class Array and bound class Customers
2. Derive: Indicates that the target can be used to compute the source.
3. Friend: Indicates that the source has special access to the target.
4. InstanceOf: Indicates that the source object is a target classifier instance.
5. Instantiate: Indicates that the source will create target objects.
6. Powertype: Indicates that the target is a source's powertype; a powertype is a classifier whose objects are all of a parent's offspring.
7. Refine: Indicates that the source is abstracted to a higher level than the target.
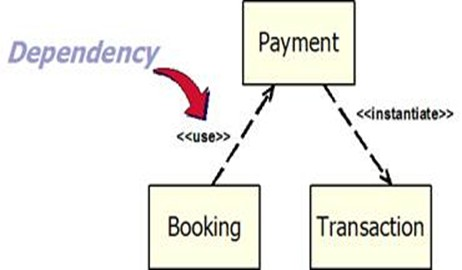
The Car class is instantiated by the CarFactory class


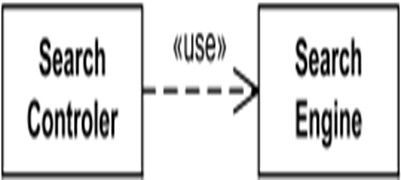
8.use: Indicates that the semantics of the source element are determined by the semantics of the target's public portion.
Class SearchController uses SearchEngine class.
Common mechanism
● The availability of four common processes that apply uniformly throughout the language makes the UML easier to understand: specifications, adornments, common divisions, and extension mechanisms.
Notes
● Rendering limitations or comments related to an element or group of elements are represented graphically.
● No Semantic Impact: has no effect on the model's meaning.
● Requirements, observations, reviews, explanations, and constraints are all examples of things to specify.
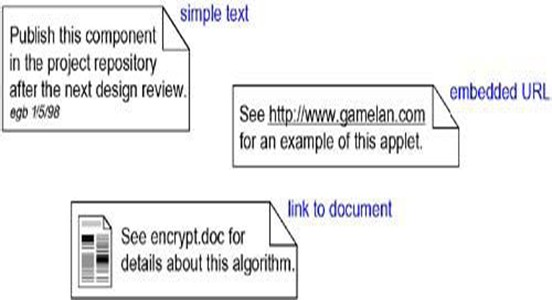
Fig 2: Notes
Adornments
● Adornments are textual or graphical elements that are added to the fundamental notation of an element and are used to illustrate details from the element's specification.
● As close to the element as possible
○ Text
○ Graphic
● In addition, there are special pockets for adornments
○ Classes
○ Components
○ Nodes
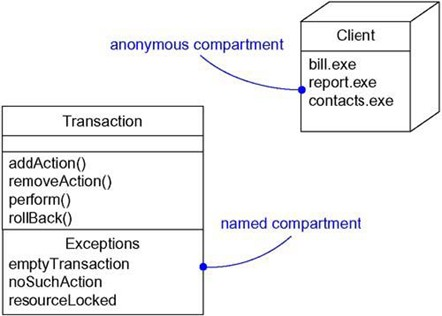
Fig 3: Extra compartments
Stereotypes
Because each Stereotype provides the equivalent of a new class in the UML technique, it is a metatype.
● Named stereotype
● Named stereotype with Icon
● Stereotype element as Icon
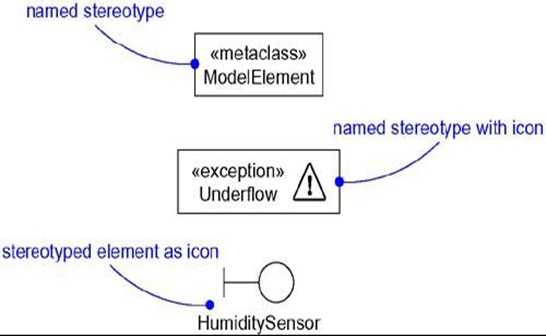
Fig 4: Stereotypes
Tagged Values
● New properties are added by using tagged values.
● A class attribute is not the same as a tagged value. Rather, consider a tagged value to be metadata because it relates to the element itself rather than its instances.
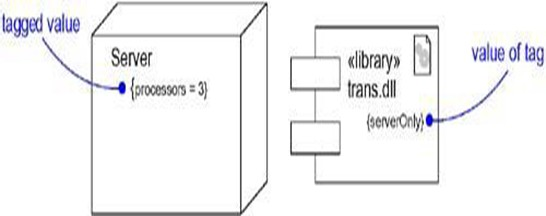
Fig 5: Tagged values
Constraints
● Constraints update or add new interpretations to existing rules.
● A constraint is a set of rules that must be followed for a model to be well-formed.
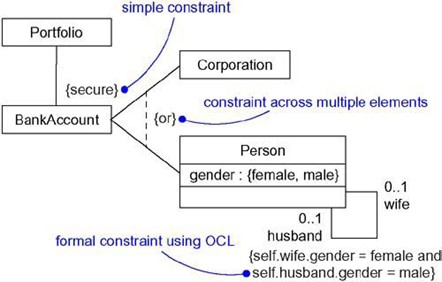
Fig 6: Constraints
Advanced Structural Modeling Overview
● Advanced classes
● Relationship
● Interface
● Types and Roles
Advanced classes
Classifiers:
A classifier is a tool for describing structural and behavioural characteristics.
Classifiers are modelling elements that can have instances in general.
Classifiers include terms like class, instance, component, node, use case, and subsystem.
● Class: A set of properties, operations, relationships, and meanings is referred to as a class.
● Use case: A set of activities that a system performs, including variants, to produce an observable outcome or value for a certain actor.
● Datatype: Data Types include primitive built-in types (such as numbers and texts) as well as enumeration types, which have no identity (such as Boolean).
● Component: A physical and replaceable portion of a system that conforms to a set of interfaces and allows them to be realised.
● Node: A physical element that exists at runtime and represents a computing resource, usually with some memory and processing power.
● Subsystem: A collection of elements, some of which serve as a specification for the behaviour provided by the others.
Visibility:
● Public [+]: This functionality is available to all outside classifiers that have visibility to the supplied classifier.
● Protected [#]: This feature is available to all descendants of the classifier.
● Private [-]: The characteristic is only available to the classifier.

Scope:
The owner scope of a feature determines whether the feature appears in each instance of the classifier or if there is only one instance of feature for all instances.
● Instance: Each instance has its own unique value.
● Classifier: Just one value for all instances (static).
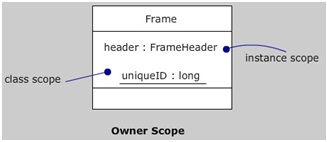
Multiplicity:
In most cases, there can be several instances of a class.
Multiplicity refers to the number of instances a class can have.

Attributes:
In the UML, an attribute has the following syntax:
[visibility] name [multiplicity] [: type] [=initial-value] [{property-string}]
There are three distinct characteristics:
● Changeable: The value of the property can be changed at any time.
● AddOnly: For attributes with a multiplicity greater than one, an additional value may be added. The value of something that already exists cannot be changed or erased.
● Frozen: After an object has been initialised, the value of an attribute cannot be changed.
Operations:
In UML, an operation's syntax is:
[visibility] name [(parameter-list)] [: return-type] [{property-string}] [direction] name: type [=default-value]
There are five distinct characteristics:
● Leaf: It is not possible to override the leaf.
● isQuery: Do not affect the state of the subsystem.
● Sequential: Only one flow is present in the object at a time.
● Guarded: All calls should be sequenced.
● Concurrent: Treating the operation as atomic at the same time.
Template Classes:
These are analogous to C++ and Ada's template classes.
A template cannot be used directly; it must first be instantiated.
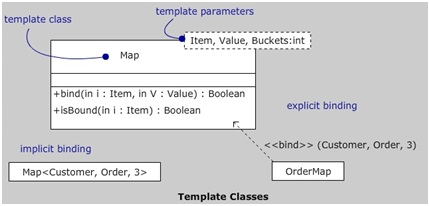
Standard Elements:
The following are some of the most common stereotypes about classes:
● Metaclass: A classifier whose objects are all classes is known as a metaclass.
● Powertype: A classifier whose objects are classes that are the offspring of a specified parent class.
● Stereotypes: Stereotypes are generalisations that can be applied to a variety of things.
● Utility: A class whose characteristics and operations are all static scoped, allowing utility's clients to access the operations and attributes without having to construct instances.
Interface
A set of operations that can be used to specify a service.
Indicate how an element (class or component) should behave regardless of its implementation.
Important for large-scale projects with multiple teams working on different aspects of the system.
Abstract operations are used to describe it (signatures).
Used to represent a system's seams (flow).
Changes on one side of seams should have no effect on components on the other.
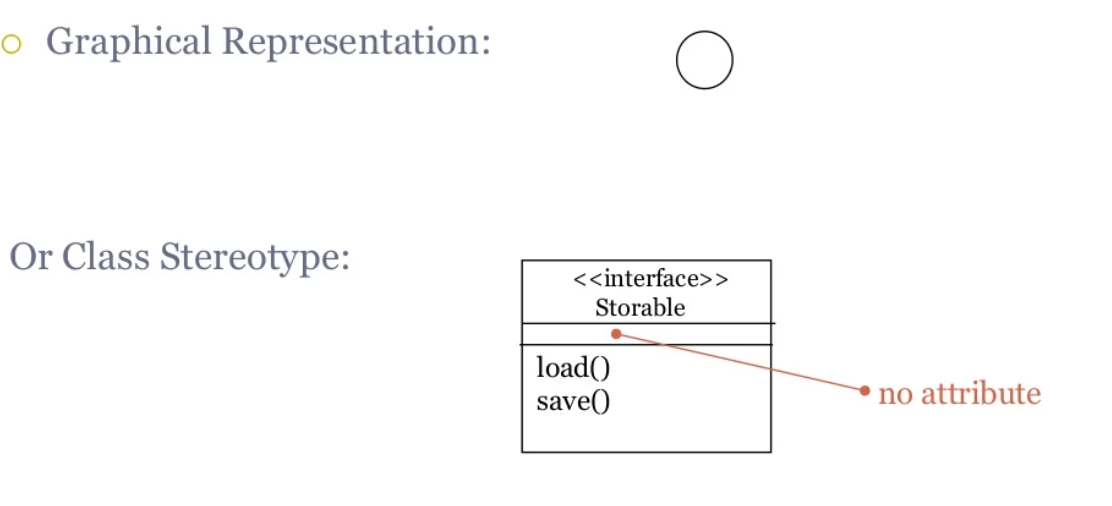
Interface Relationship
● Participate in: Participate in the following activities: generalisation, association dependence, and realisation.
● Realization: A class or component can implement one (or more) of the following interfaces:
○ All of the interfaces it realises have a set of methods that implement their operations.
Example
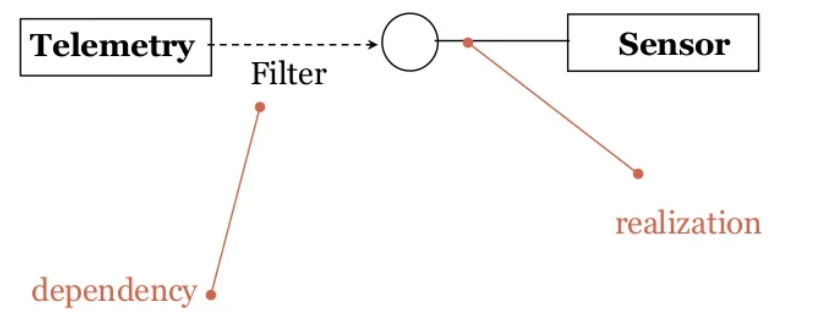
Types and Role
Types:
● Interface + Attributes is the same thing.
● Allows you to model an abstraction's semantics as well as its adherence to a certain interface.
Roles:
● An instance may only show one of its interfaces in a given environment. Each interface represents a specific function that the object does.

Class Diagrams
A class diagram explains the static structure of a system. It depicts how a system is structured rather than how it behaves. The static structure of a system consists of a number of class diagrams and their dependencies. The main elements of a class diagram are classes and their relationships: generalization, aggregation, association, and different kinds of dependencies.
Classes:
Class is a blueprint with which we can create “n” number of objects. The classes represent entities with same features, i.e. attributes and operations. Classes are shown by solid outline rectangles with compartments. Classes have a compulsory name compartment where the name is written centered in boldface. The class name is usually written using mixed case convention and starts with an uppercase. The class names are usually chosen to be singular nouns. Classes have optional attributes and operations compartments. A class may present on various diagrams.
Attributes:
It is a named property of a class. It represents the kind of data that an object might contain. Attributes are listed with their names, and may optionally contain specification of their type, an initial value, and constraints. The type of the attribute is written by attaching a colon and the type name after the attribute name. Basically, the first letter of a class name is a small letter. An example for an attribute is given.
BookName: String
Operation:
Operation is the fulfillment of a service that can be requested from any object of the class to affect behavior. An object’s data or state can be changed by requesting an operation of the object. A class may have any number of operations or no operation at all. Basically, the first letter of an operation name is a small letter. Abstract operations are written in italics. The parameters of an operation (if any), may have a kind specified, which may be ‘in’, ‘out’ or ‘inout’. An operation may have a return type containing a single return type expression. An example for an operation is given.
IssueBook(in bookName):Boolean
Association:
Associations are needed to enable objects to interact with one another. An association explains a connection between classes. The association relation between two objects is called object connection or link. Links are instances of associations. A link is a physical or conceptual connection between object instances.
For example, suppose Amit has borrowed the book Graph Theory. Here, borrowed is the connection between the objects Amit and Graph Theory book. Mathematically, a link can be considered to be a tuple, i.e. an ordered list of object instances. An association describes a group of links with a common structure and common semantics. For example, consider the statement that Library Member borrows Books. Here, borrows is the association between the class LibraryMember and the class Book. Usually, an association is a binary relation (between two classes).
However, three or more different classes can be involved in an association. A class can have an association relationship with itself (called recursive association). In this case, it is usually assumed that two different objects of the class are linked by the association relationship. Association between two classes is represented by drawing a straight line between the concerned classes.
Figure illustrates the graphical representation of the association relation. The name of the association is written alongside the association line. An arrowhead may be placed on the association line to indicate the reading direction of the association. The arrowhead should not be misunderstood to be indicating the direction of a pointer implementing an association.
On each side of the association relation, the multiplicity is noted as an individual number or as a value range. The multiplicity indicates how many instances of one class are associated with each other. Value ranges of multiplicity are noted by specifying the minimum and maximum value, separated by two dots, e.g. 1.5. An asterisk is a wild card and means many (zero or more). The association of figure should be read as “Many books may be borrowed by a Library Member”. Observe that associations (and links) appear as verbs in the problem statement.

Fig 7: Association between two classes

Fig 8: Association between two classes (Example)
Associations are usually recognized by assigning suitable reference attributes to the classes involved. Thus, associations can be implemented using pointers from one object class to another. Links and associations can also be implemented by using a separate class that saves how objects are linked.
Aggregation:
Aggregation is a special type of association where the involved classes represent a whole-part relationship. The aggregate takes the job of forwarding messages to the suitable parts. Thus, the aggregate takes the responsibility of delegation and leadership. When an instance of one object contains instances of some other objects, then aggregation (or composition) relationship exists between the composite object and the component object. Aggregation is represented by the diamond symbol at the composite end of a relationship. The number of instances of the component class aggregated can also be shown as in figure.

Fig 9: Representation of Aggregation
Aggregation relationship cannot be reflexive (i.e. recursive). That is, an object cannot contain objects of the same class as itself. Also, the aggregation relation is not symmetric. That is, two classes A and B cannot contain instances of each other. However, the aggregation relationship can be transitive. In this case, aggregation may consist of an arbitrary number of levels.
Composition:
Composition is a tough form of aggregation, in which the parts are existence-dependent on the whole i.e. life of the parts closely related to the life of the whole. When the whole is created, the parts are created and in the same way when the whole is destroyed, the parts are also destroyed. A typical example of composition is an invoice object with invoice items. As soon as the invoice object is created, all the invoice of items in it is created and as the invoice object is destroyed, all invoice items in it are also destroyed. The composition relationship is represented as a filled diamond drawn at the composite-end. An example of the composition relationship is shown below:

Fig 10: Representation of Composition
For example, consider this situation in a business system. A BusinessPartner can be a Customer or a Supplier or both. Initially we might be tempted to model it as in Fig. But in fact, during its lifetime, a business partner may become a customer as well as a supplier, or it may change from one form to other. In these type of cases, we prefer aggregation instead. Here, a business partner is a Customer if it has an aggregated Customer object, a Supplier if it has an aggregated Supplier object and a "Customer_Supplier" if it has both the objects. Here, we have only two types. Hence, we are able to model it as inheritance. Also, the aggregation model allows the possibility for a business partner to be none of them - i.e. has neither a customer nor a supplier object aggregated with it.
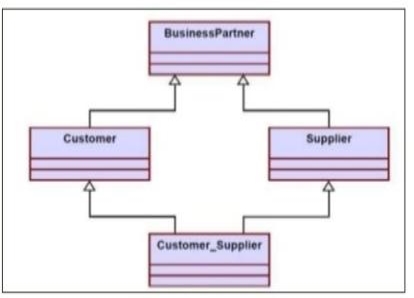
Fig 11: Representation of BusinessPartner, Customer, Supplier relationship using inheritance
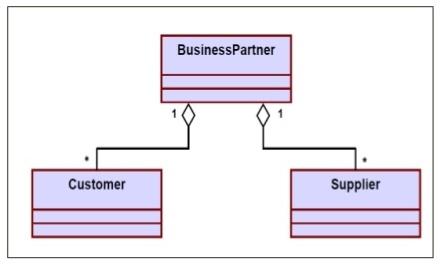
Fig 12: Representation of BusinessPartner, Customer, Supplier relationship using aggregation
Object diagram
● It's a physical representation of an abstraction on which a set of operations may be applied and which has a state that stores the operations' effects.
● The name of an object in an object diagram is highlighted in the class symbol.
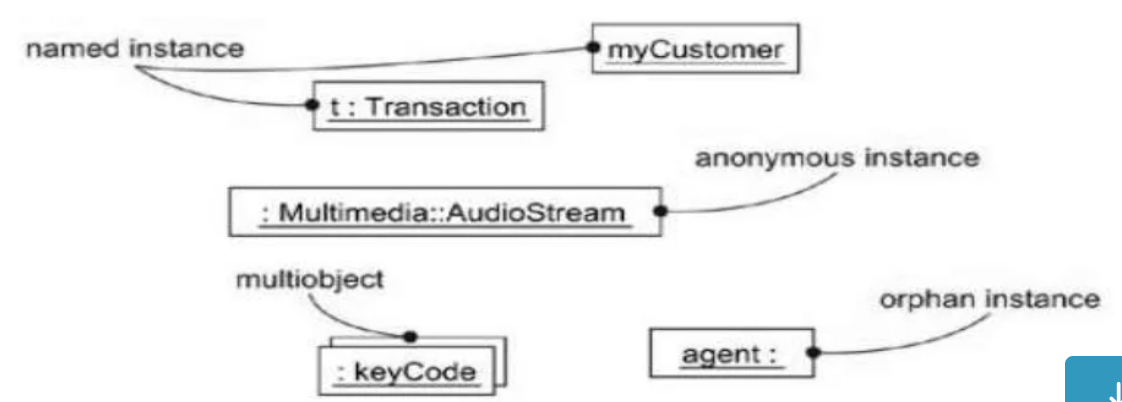
● Because an object has state, it is dynamic.
● When we visualise its condition, we're actually describing its value at a specific point in time and space.
● We generally change the state of an object when we operate on it; however, when you query an object, you do not change its state.
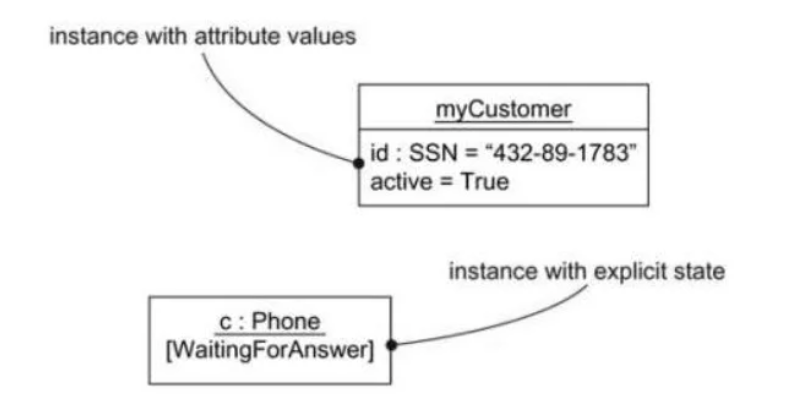
● In class diagrams, represent the instances of things.
● At a given time, it depicts a group of items and their relationships.
● Use to represent a system's static design view or static process view.
● It's vital not just for visualising, specifying, and documenting structural models,
● but also for building the static features of systems.
● A set of instances of the things contained in a class diagram is covered by an object diagram.
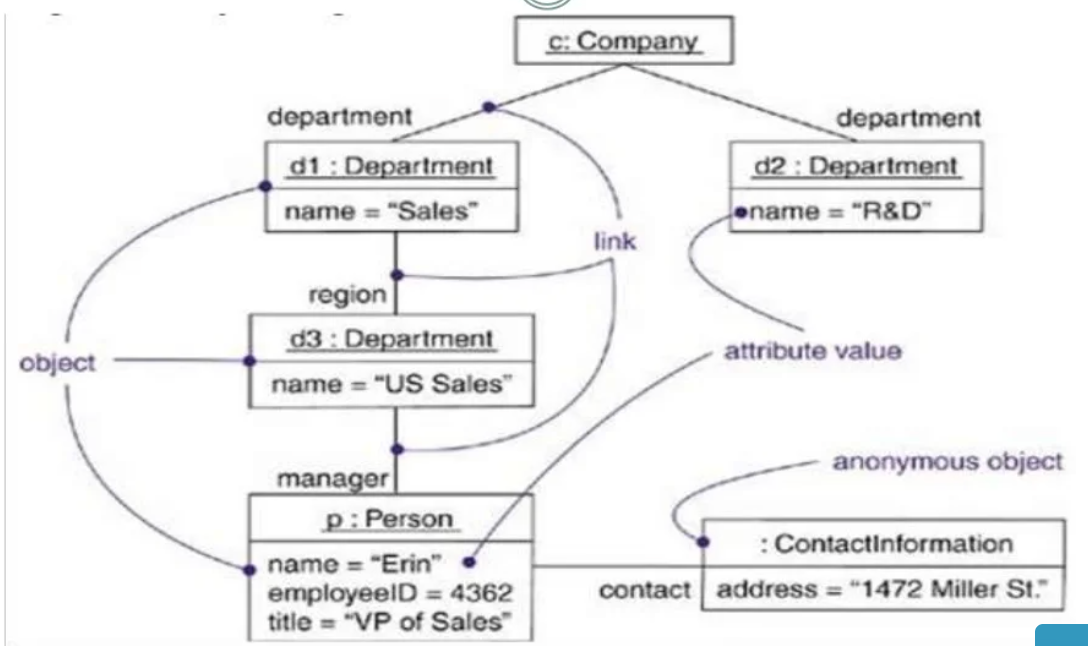
● Objects and Links are frequently present. Notes and limitations may also be included.
● If class A has a one-to-many relationship with class B, there could be five instances of B for one instance of A, but only one instance of B for another instance of A.
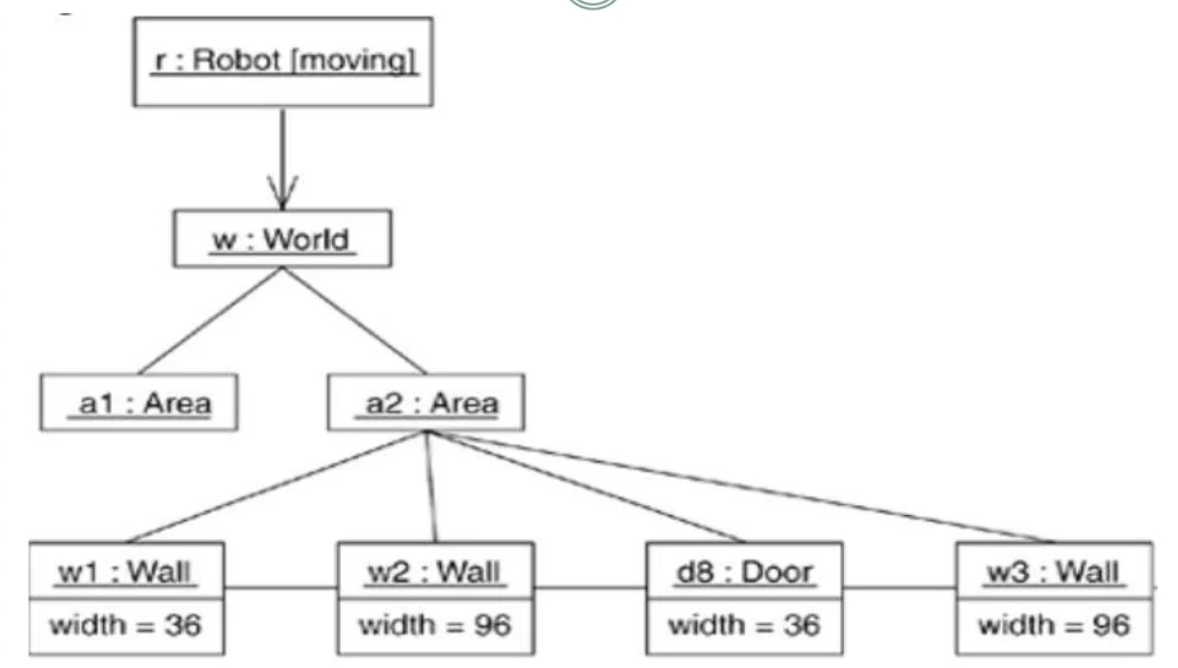
● To create a model of an object diagram,
○ Determine the mechanism you'd like to model, which should represent some function or behaviour of the component of the system you're modelling that comes from the interaction of a community of classes, interfaces, and other elements.
○ Then, to explain a mechanism, form a collaboration.
○ Identify the classes, interfaces, and other elements that participate in this cooperation for each mechanism, as well as the links between them.
○ To comprehend the circumstance, expose the state and attribute values of each such object as needed.
○ Similarly, reveal the connections between these items, which represent instances of associations.
Example
Component Diagram
Component diagrams are used to visualize the organization and relationships among components in a system. These diagrams are also used to make executable systems.
Purpose of Component Diagrams
Component diagram is a special kind of diagram in UML. It does not describe the functionality of the system but it describes the components used to make those functionalities. These components are libraries, packages, files, etc.
The purpose of the component diagram can be summarized as −
- Describes the static implementation view of a system. Static implementation represents the organization of the components at a particular moment.
- Construct executable by using forward and reverse engineering.
To Draw a Component Diagram following artifacts are to be identified:
- Files used in the system.
- Libraries and other artifacts relevant to the application.
- Relationships among the artifacts.
- Use a meaningful name to identify the component for which the diagram is to be drawn.
- Prepare a mental layout before producing the using tools.
- Use notes for clarifying important points.
Component diagrams are used during the implementation phase of an application. Initially, the system is designed using different UML diagrams and then when the artifacts are ready, component diagrams are used to get an idea of the implementation
Following is a component diagram for order management system with four files identified and their relationships are produced.
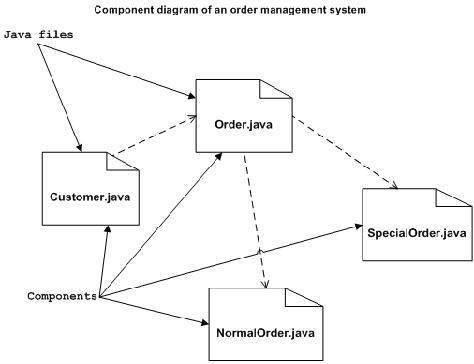
Component diagrams can be used to −
- Model the components of a system.
- Model the database schema.
- Model the executable of an application.
- Model the system's source code.
Use case Diagrams
A use case diagram is used to represent the dynamic behavior of a system. It encapsulates the system's functionality by incorporating use cases, actors, and their relationships. It models the tasks, services, and functions required by a system/subsystem of an application. It depicts the high-level functionality of a system and also tells how the user handles a system.
Purpose of Use Case Diagrams
The main purpose of a use case diagram are:
- It gathers the system's needs.
- It depicts the external view of the system.
- It recognizes the internal as well as external factors that influence the system.
- It represents the interaction between the actors.
Rules that must be followed while drawing a use case diagram:
- A pertinent and meaningful name should be assigned to the actor or a use case of a system.
- The communication of an actor with a use case must be defined in an understandable way.
- Specified notations to be used as and when required.
- The most significant interactions should be represented among the multiple no of interactions between the use case and actors.
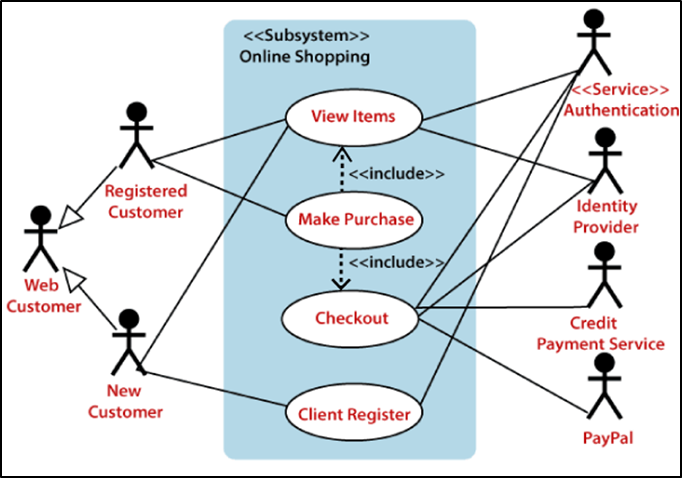
Case study example of Online Shopping website is given to draw a USE case diagram.
Actors and uses are: Web Customer actor uses online shopping website to purchase online. The top-level uses are as follows; View Items, Make Purchase, Checkout, Client Register.
The View Items use case is utilized by the customer who searches and view products.
The Client Register use case allows the customer to register itself with the website for availing gift vouchers, coupons, or getting a private sale invitation. It is to be noted that the Checkout is an included use case, which is part of Making Purchase, and it is not available by itself.
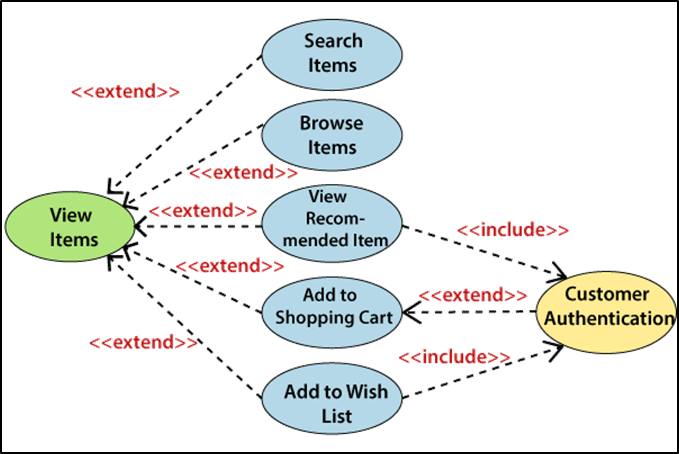
- View Items is further extended by several use cases such as; Search Items, Browse Items, View Recommended Items, Add to Shopping Cart, Add to Wish list.Both View Recommended Item and Add to Wish List include the Customer Authentication use case, as they necessitate authenticated customers, and simultaneously item can be added to the shopping cart without any user authentication.
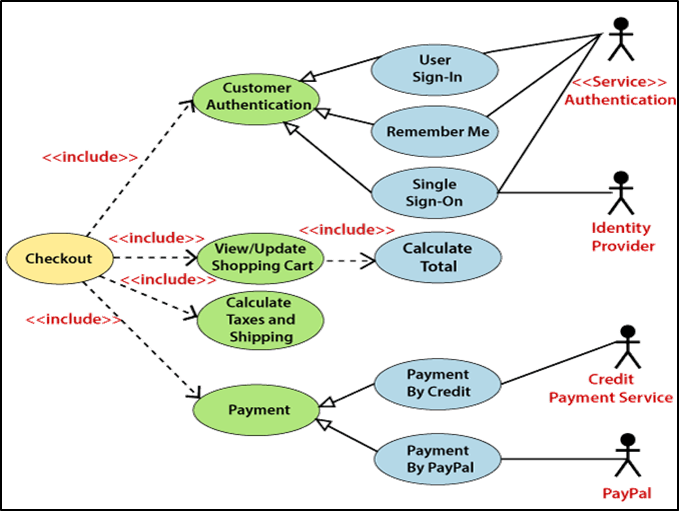
- Similarly, the Checkout use requires an authenticated Web Customer, which can be done by login page, user authentication cookie ("Remember me"), or Single Sign-On (SSO). SSO needs an external identity provider's participation, while Web site authentication service is utilized in all these use cases.
- The Checkout use case involves Payment use case that can be done either by the credit card and external credit payment services or with PayPal.
State diagrams
A state diagram is used to depict the state of a system or a section of a system at a specific point in time. It's a behavioural diagram that uses limited state transitions to illustrate the behaviour. State diagrams are sometimes known as state machines or state chart diagrams. These terms are frequently interchanged. Simply put, a state diagram is a representation of a class's dynamic behaviour in reaction to time and changing external stimuli. We can say that every class has a state, but we don't use State diagrams to model every class. We prefer to model states in groups of three or more.
Uses of State Diagram
● The dynamic aspect of the system is designed using a state diagram.
● It specifies the status of the components, as well as changes in state caused by an event. Internal and external variables influence the system through events.
● It's crucial to understand the various states of an object throughout its existence while building a system. This is accomplished through the usage of a state diagram. They are utilised to model this state and even when it is triggered, and these models are employed during the system implementation.
● It's mostly utilised to model the system's object states.
● A state diagram is also used to identify the events that cause the state to change.
● It's used to simulate a reactive system.
● Forward and reverse engineering both employ state diagrams.
Design State Diagram
The following steps will show you how to make a state diagram:
1. Initial State
It's shown by a filled circle. It depicts the diagram's starting point or first activity. This state is also known as a pseudo-state because it lacks variables and activities.
Symbol

2. Final State
It's shown by a filled circle with a boundary. It depicts the conclusion of the state diagram. This is likewise a pseudo-state because no variables or actions are specified. There can be zero or more final states in a state diagram.
Symbol

3. State
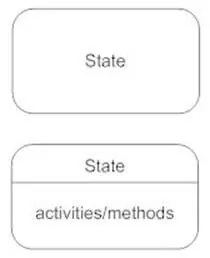
It depicts the state of an object at a specific point in time. The state is an identifiable circumstance that lasts for a specific amount of time. To describe the state name, variable, and actions, a specified rectangle and compartment are used.
Symbol
4. Transition
A transition occurs when a person moves from one state to another. It's indicated by an arrow. The arrow is followed by the event and action that caused the transition, which are separated by a slash. A trigger less transition is one that occurs after the state has completed its activity. The guard condition is indicated by square brackets around the description of the event or action in the form of a Boolean expression if an event does not occur after the completion of another event or action. Following the guard condition, the transition takes place.
Symbol

5. Event and Action
An event or action is a trigger that causes a transition to occur and alters the state. An event that takes place at a specific time has no duration. The transition that an event or action produces is written above it.
6. History State
Flow may require the object to enter a wait state and then return to its previous state when a specific event occurs. This is demonstrated by enclosing the letter H in a circle.
7. Signal
When an event sends a message or trigger to a state that induces a transition, the message sent by the event is referred to as a signal. The Signal>> icon appears above the action or occurrence to indicate this.
8. Self Transition
A self transition is a transition that returns a state to its original state. When a transition is linked to an effect, this is especially important.
9. Action Inside State
Actions can be used to run a function, set a value for a data variable, or start a new transaction. Each of these internal operations should be specified on a separate line. Internal activities are processed without changing the state of the system. It is expressed as an action-label or an action-expression.
The label for the action can be any of the following:
● Entry: When a state is entered, the accompanying action-expression is executed. For instance, entry/count: 0; sum: 0
● Exit: When the state is exited, it executes the corresponding action expression. Exit/ring the bell, for example.
● Do: Upon state entry, it executes the corresponding action expression and continues until state exit. Do/display flashing light, for example.
● Include: Finite automation must be the name of this action expression. Automation is a placeholder for a nested state diagram with the name Automation. Include, for example, / Order processing.
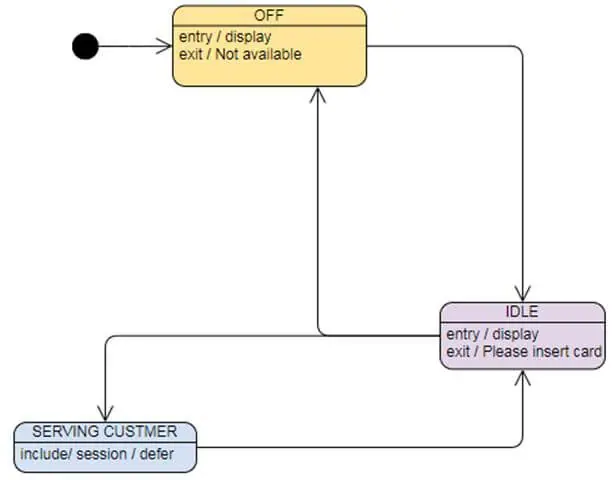
Fig 13: Example of ATM and draw a state diagram
Interaction diagrams
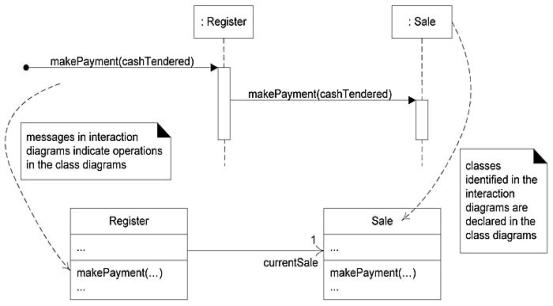
When we draw interaction diagrams, a set of classes and their methods emerge from the creative design process of dynamic object modeling. For example, if we started with the (trivial for explanation) makePayment sequence diagram in figure below, we see that a Register and Sale class definition in a class diagram can be obviously derived.
Thus, from interaction diagrams the definitions of class diagrams can be generated. This suggests a linear ordering of drawing interaction diagrams before class diagrams.
Note: A good UML tool should automatically support changes in one diagram being reflected in the other. If wall sketching, use one wall for interaction diagrams, and an adjacent wall for class diagrams.
Sequence diagrams
The Unified Modelling Language (UML) is a software engineering modelling language that tries to standardise how to depict a system's design. UML is used to create a variety of diagrams, including interface, structural, and behaviour diagrams. The most common type of interaction diagram is a sequence diagram. Interaction diagram - An interaction diagram is a diagram that depicts a system's interacting behaviour. We utilize several types of interaction diagrams to capture various features and components of interaction in a system since visualising the interactions in a system can be difficult.
A sequence diagram displays the interactions between items in a sequential order, that is, the order in which they occur. A sequence diagram can also be referred to as an event diagram or an event scenario. Sequence diagrams show how and in what order the components of a system work together. Businesspeople and software engineers frequently use these diagrams to document and understand requirements for new and current systems.
Purpose of a Sequence Diagram
● To represent the high-level interaction between active objects in a system.
● To simulate the interaction of items within a collaboration that is implementing a use case.
● It either simulates general interactions or specific interaction cases.
Advantages
● It investigates real-time applications.
● It displays the flow of information between the various objects.
● It is simple to maintain.
● It is simple to make.
● Both forward and reverse engineering should be used.
● It can quickly update to reflect new system changes.
Disadvantages
● The sequence diagram might become more complicated if there are too many lifelines.
● If the order of the messages changes, an inaccurate result may be produced.
● Because each sequence requires its own set of notations, the diagram may become more complicated.
● The type of message determines the type of sequence.
Notations of a Sequence Diagram
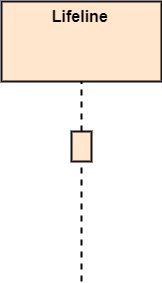
● Lifeline
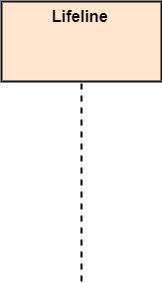
A lifeline represents an individual participant in the sequence diagram. It is at the very top of the diagram.
● Actor
An actor is a character who interacts with the subject and plays a part. It isn't covered by the system's capabilities. It depicts a role in which human users interact with external devices or subjects. An actor may or may not portray a physical entity, but it always portrays the role of a physical being. An actor can take on a variety of roles, or vice versa.

● Activation
On the lifeline, it is represented as a thin rectangle. It describes the time period during which an element performs an operation, with the top and bottom of the rectangles representing the start and completion times, respectively.
● Messages
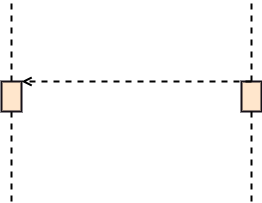
The messages are displayed by arrows and indicate the interaction between the items. On the lifeline, they are in the correct order. Messages and lifelines comprise the core of the sequence diagram.
The following are examples of message types:
● Call Message: It shows that the target lifeline has invoked an operation by defining a specific communication between the interaction's lifelines.

● Return Message: It denotes a specific communication between the interaction's lifelines, which reflect the flow of data from the receiver of the matching caller message.
● Self Message: It indicates a communication that has been induced, particularly between the lifelines of an encounter that symbolises a message of the same lifeline.

● Recursive Message: A recursive message is a self-message sent for recursive purposes. In other words, because it represents recursive calls, the recursive message might be considered a particular case of the self message.

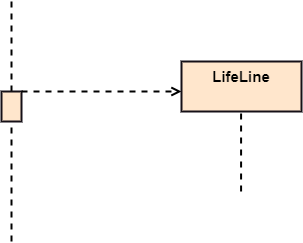
● Create Message: It specifies a communication between the lifelines of an interaction, specifically between the lifelines describing that the target (lifeline) has been instantiated.
● Destroy Message: This is a communication that displays a request to destroy the target's lifecycle, notably between the lifelines of an interaction.

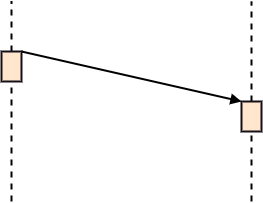
● Duration Message: A communication between the lifelines of an interaction that depicts the time passing of the message while modelling a system is referred to as a message.
Note
A note is the ability to attach multiple comments to one element. It mostly contains information that is beneficial to modellers.

References:
- Roger S Pressman, Bruce R Maxim, “Software Engineering: A Practitioner’s Approach”, Kindle Edition, 2014.
- Ian Sommerville,” Software engineering”, Addison Wesley Longman, 2014.
- James Rumbaugh. Micheal Blaha “Object oriented Modeling and Design with UML”, 2004.
- Ali Behforooz, Hudson, “Software Engineering Fundamentals”, Oxford, 2009.
- Charles Ritcher, “Designing Flexible Object Oriented systems with UML”, TechMedia, 2008.