UNIT-1
UNIFORM FLOW IN OPEN CHANNEL
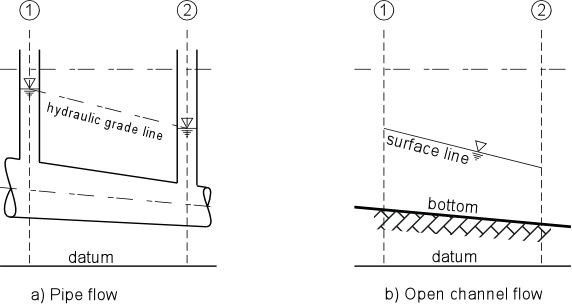
Open Channel Flow is defined as fluid flow with a free surface open to the atmosphere. Examples include streams, rivers, and culverts not flowing full. Open channel flow assumes that the pressure at the surface is constant and the hydraulic grade line is at the surface of the fluid
Steady and unsteady flow depends on whether flow depth and velocity change with time at a point. In general, if the quantity of water entering and leaving the reach does not change, then the flow is considered steady.
Steady flow in a channel can be either Uniform or Non-uniform (varied). When the average velocities in successive cross-sections of a channel are the same, the flow is uniform. This occurs only when the cross-section is constant. Non-uniform flow results from gradual or sudden changes in the cross-sectional area.
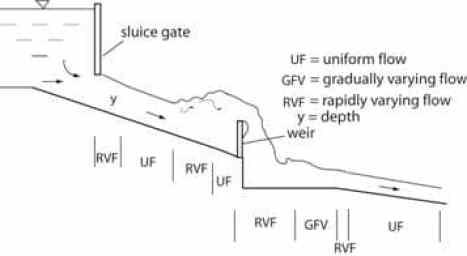
Uniform flow and varied flow describe the changes in-depth and velocity concerning distance. If the water surface is parallel to the channel bottom flow is uniform and the water surface is at normal depth. Varied flow or non-uniform flow occurs when depth or velocity changes over a distance, like in a constriction or over a riffle. Gradually varied flow occurs when the change is small, and rapidly varied flow occurs when the change is large, for example, a wave, waterfall, or the rapid transition from a stream channel into the inlet of a culvert.
The terms open-channel flow or free-surface flow, Fig. 1-1(a) are used synonymously. The free surface is usually subjected to atmospheric pressure. Groundwater or subsurface flows are excluded. If there is no free surface and the conduit is flowing full, then the flow is called pipe flow, or pressurized flow. Fig. 1-1(b)
|
Fig1 Natural Open-Channel Flow
In a closed conduit, it is possible to have both free-surface flow and pressurized flow at different times. It is also possible to have these flows at a given time in different reaches of a conduit. For example, the flow in a storm sewer section. Pipe or pressurized flow may be free-surface flow at a certain time. Then, due to large inflows produced by a sudden storm, the sewer may flow full and pressurize it. Similarly, the flow in a closed conduit may be free in part of the length and pipe flow in the remaining length. This type of combined free-surface, pressurized flow usually occurs in a closed conduit when the downstream end of the conduit is submerged (Fig. 1-3)
|
Figure 1-1 Flow in closed cross-section and with free surface
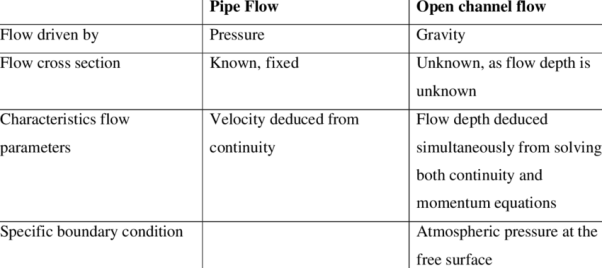
Pipe flow, a branch of hydraulics and fluid mechanics, is a type of liquid flow within a closed conduit (conduit in the sense of a means of containment). The other type of flow within a conduit is open channel flow. These two types of flow are similar in many ways but differ in one important aspect. Pipe flow does not have a free surface which is found in open-channel flow. Pipe flow, being confined within a closed conduit, does not exert direct atmospheric pressure but does exert hydraulic pressure on the conduit.
Not all flow within a closed conduit is considered pipe flow. Storm sewers are closed conduits but usually maintain a free surface and therefore are considered open-channel flow. The exception to this is when a storm sewer operates at full capacity and then can become pipe flow.
The energy in pipe flow is expressed as head and is defined by the Bernoulli equation. To conceptualize head along the course of flow within a pipe, diagrams often contain a hydraulic grade line (HGL).
The differences between pipe flow and open channel flow are as follows:
|
Open-channel flow is usually categorized based on steadiness. Flow is said to be steady when the velocity at any point of observation does not change with time; if it changes from time to time, flow is said to be unsteady. At every instant, if the velocity is the same at all points along the channel, flow is said to be uniform; if it is not the same, flow is said to be non-uniform. Non-uniform flow which is also steady is called varied flow; unsteady non-uniform flow is called variable flow. Flow occurs from a higher to a lower concentration with the aid of gravity.
Usually, the man-made and artificial open channels don't have a rectangular cross-section. The most common shapes of open channels are circular and trapezoidal.
Open Channels are classified as:
- Rigid boundary open channels
- Loose boundary open channels
- Prismatic open channels
Rigid boundary open channels can be said to be the open channels with non-changeable boundaries. While on the other hand if an open channel has boundaries that change due to scouring action or deposition of sediments, such channels are said to be loose boundary open channels. The open channels in which shape, size of cross-section, and slope of the bed remain constant are said to be prismatic channels. Opposite o these channels are non-prismatic. Natural channels are the example of non-prismatic channels while man-made open channels are the example of prismatic channels.
- Open channels are natural or manmade conveyance structure which has a free surface at atmospheric pressure. For example, flow in rivers, streams, flow in sanitary and storm sewers flowing partially full.
- A flume is a channel made of wood, metal, concrete, or masonry usually supported on or above to carry out water across a depression.
- A chute is a channel having steep slopes.
- A drop is similar to a chute but the change in the elevation is affected in a short distance.
- A culvert when partially full is a covered channel installed to drain water through highways or railways embankment.
- A channel in which the cross-sectional shape, size, and bottom slope are constant is termed a prismatic channel.
- All-natural channels generally have varying cross-sections and consequently are non-prismatic.
- Most of the man-made channels are prismatic channels over long stretches. The rectangle, trapezoid, triangle, and circle are commonly used shapes in manmade channels.
- Rigid channels are those in which the boundary is not deformable. The shape and roughness magnitudes are not functions of flow parameters. For example, lined canals and no erodible unlined canals.
- In Rigid channels, the flow velocity and shear stress distribution will be such that no major scouring, erosion, or deposition will take place in the channel and the channel geometry and roughness are essentially constant concerning time.
- When the boundary of the channel is mobile and flow carries considerable amounts of sediment through suspension and is in contact with the bed. Such channels are classified as mobile channels.
- In the mobile channel, not only depth of flow but also bed width, the longitudinal slope of the channel may change with space and time depending on the type of flow.
- The resistance to flow, the quantity of sediment transported and channel geometry all depend on the interaction of flow with channel boundaries.
- A general mobile boundary channel can be considered to have four degrees of freedom. In the rigid channel, we have one degree of freedom.
The flow in the channel can be classified as:
In an open channel flow, if the flow parameters such as depth of flow, the velocity of flow, and the rate of flow at a particular point on the fluid do not change concerning time, then it is called steady flow.
If v is the velocity of the fluid, Q is the rate of flow and d is the depth of flow, then for a steady flow:
dv/dt = 0; dQ/dt = 0; dy/dt = 0;
And is at any point on the open channel flow, the flow parameters like depth of flow, the velocity of flow, and rate of flow do change their value concerning time, then it is called an unsteady flow. It is hence given by:
dV/dt, dQ/dt and dy/dt not equal to Zero
2. Uniform Flow and Non-Uniform Flow
The flow in the channel is said to be uniform, if, for a given length of the channel, the velocity of flow, the depth of flow remains constant. i.e.
dy/dS = 0 ; dv/dS=0;
In a Non-uniform flow, the flow parameters like velocity, depth of flow, etc do not remain constant for a given length of the channel.
dy/dS and dv/dS not equal to zero.
The Non-uniform flow can be again defined as Rapidly varying flow (R.V.F) and Gradually Varied Flow (G.V.F). In the case of R.V.F, the depth of flow rapidly changes over a smaller length of the channel. It rises suddenly for a short length and settles back. While in a G.V.F, the depth of flow changes gradually over a longer length of the channel.
|
Fig1-2 Open Channel Flow Types Illustration
3. Laminar Flow and Turbulent Flow
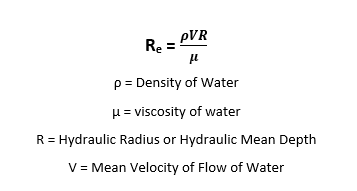
Laminar and turbulent flow in open channel flow is defined based on the Reynolds Number, Re. The Reynolds number is given by the relation:
|
If the Reynolds number Re is less than 500 or 600, then the flow is called laminar flow. If the Reynolds number is more than 2000, then the flow is said to be turbulent.
A flow that has a Reynolds number between 500 and 2000 is said to be in the transition state.
4. Critical, Sub-Critical, and Super – Critical Flow
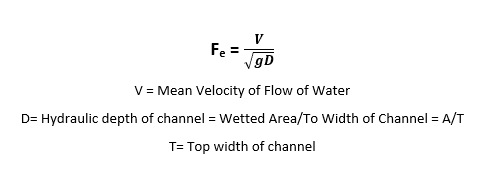
The open channel flow is categorized as critical or sub-critical or super-critical based on the Froude number Fe. Froude number is given by the relation:
|
Open channel flow is Sub-critical if the Froude number is less than 1. Sub-Critical open channel flow is also defined as a tranquil or streaming flow.
An open channel flow with a Froude number equal to one is a critical flow. And super-critical flow in an open channel has a Froude number greater than 1. A supercritical flow is also termed as rapid flow or torrential flow or shooting flow.
Key Takeaways:
- Open Channel Flow is defined as fluid flow with a free surface open to the atmosphere. Examples include streams, rivers, etc.
- Steady and unsteady flow depends on whether flow depth and velocity change with time at a point. Steady flow in a channel can be either Uniform or Non-uniform (varied). Uniform flow and varied flow describe the changes in-depth and velocity concerning distance. If the water surface is parallel to the channel bottom flow.
- If there is no free surface and the conduit is flowing full, then the flow is called pipe flow, or pressurized flow. Pipe flow does not have a free surface which is found in open-channel flow. Pipe flow, being confined within a closed conduit, does not exert direct atmospheric pressure but does exert hydraulic pressure on the conduit.
- Open Channels are classified as Rigid boundary open channels, Loose boundary open channels, Prismatic open channels.
- The flow in the channel can be classified as Steady and unsteady flow, Uniform and non-uniform flow, Laminar and turbulent flow, Critical and sub-critical flow.
A channel section is defined as the cross-section that is taken perpendicular to the main flow direction. Referring to Figure 1-3, the geometric elements of an open channel are defined as follows:
Flow depth, y | The vertical distance from the channel bottom to the free surface. |
Depth of flow section, d | Flow depth measured perpendicular to the channel bottom. The relationship between d and y is d ¼ y cos. For most manmade and natural channels cos 1.0, and therefore yd. The two terms are used interchangeably. |
Top width, T | Width of the channel section at the free surface. |
Wetted perimeter, P | Length of the interface between the water and the channel boundary. |
Flow area, A | The cross-sectional area of the flow. |
Hydraulic depth, D | Flow area divided by top width, D ¼A/T. |
Hydraulic radius, R | Flow area divided by the wetted perimeter, R ¼ A/P. |
Bottom slope, S0 | The longitudinal slope of the channel bottom, S0¼ tan sin. |
Table 1.1
Table 1.1 presents the relationship between various section elements. A similar, more detailed table was previously presented by Chow (1959).
|
Fig1-3 Definition sketch for section elements
|
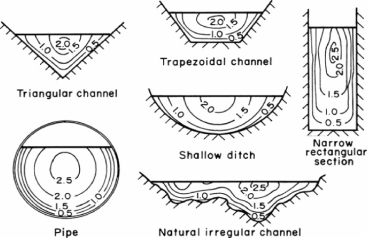
Fig 1-4 Velocity distribution in different channel sections
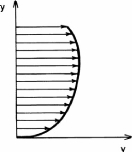
The flow velocity may have components in all three Cartesian coordinate directions. However, the components of velocity in the vertical and transverse directions are usually small and may be neglected. Therefore, only the flow velocity in the direction of flow needs to be considered. This velocity component varies with depth from the free surface. A typical variation of velocity with depth is shown in Fig. 1-5.
|
Fig. 1-5 Typical velocity variation with depth
Energy Coefficient
As discussed, the flow velocity in a channel section usually varies from one point to another. Therefore, the mean velocity head in a channel section, (V 2/2g)m, is not the same as the velocity head, Vm2 /(2g), computed by using the mean flow velocity, Vm, in which the subscript m refers to the mean values. This difference may be taken into consideration by introducing an energy coefficient, α, which is also referred to as the velocity- head, or Coriolis coefficient. An expression for this coefficient is derived.
Referring to Fig. 1-6, the mass of liquid flowing through area ΔA per unit time = ρV ΔA, in which ρ = mass density of the liquid. Since the kinetic energy of mass m traveling at velocity V is (1/2)mV2, we can write
Hence, Kinetic energy transfer through area ΔA per unit time = = Kinetic energy transfer through an area A per unit time=
Fig. 1-6. Definition sketch
|
It follows from Eq. 1.1 that the kinetic energy transfer through area ΔA per unit time may be written as (γV ΔA)V2/(2g) = weight of liquid passing through area ΔA per unit time velocity head, in which γ = specific weight of the liquid. Now, if Vm is the mean flow velocity for the channel section, then the weight of liquid passing through the total area per unit time =γVm dA; and the velocity head for the channel section =αVm2/(2g), in which α = velocity-head coefficient. Therefore, we can write
Kinetic energy transfer through the area per unit time
= ραVmVm2/2dA (1.4)
Hence, it follows from Eqs. 1.3 and 1.4 that
α= ( ∫ V3.dA)/Vm3.∫dA (1.5)
Figure 1-7 shows a typical cross-section of a natural river comprising of the main river channel and the flood plain on each side of the main channel. The flow velocity in the floodplain is usually very low as compared to that in the main section. Also, the variation of flow velocity in each subsection is small. Therefore, each subsection may be assumed to have the same flow velocity throughout. In such a case, the integration of various terms of Eq. 1.5 may be replaced by summation as follows:
α= (V13A1+V23A2+V33A3)/Vm3A1+A2+A3 (1.6)
in which
Vm=(V1A1+V2A2+V3A3)/A1+A2+A3 (1.7)
By substituting Eq. 1.7 into Eq. 1.6 and simplifying, we obtain
α =(V13A1+V23A2+V33A3)(A1+A2+A3)2/ V1A1V2A2V3A3 3 (1.8)
Note that Eq. 1.8 is written for a section that may be divided into three subsections each having uniform velocity distribution. For a general case in which total area A may be subdivided into N such subareas each having uniform velocity, an equation similar to Eq. 1.8 may be written as
Fig. 1-7 Typical river cross-section
|
Momentum Coefficient
The mass of liquid passing through area ΔA per unit time = ρV ΔA. Therefore, the momentum passing through area ΔA per unit time = (ρV ΔA)V = ρ ΔA. By integrating this expression over the total area, we get
Momentum transfer through area A per unit time
= ρ ∫ V2 dA (1.10)
By introducing the momentum coefficient, β, we may write the momentum transfer through area A in terms of the mean flow velocity, Vm, for the channel section, i.e.,
Momentum transfer through an area A per unit time= βρV2 ∫ dA (1.11)
Hence, it follows from Eqs. 1.10 and 1.11 that
|
(1.12)
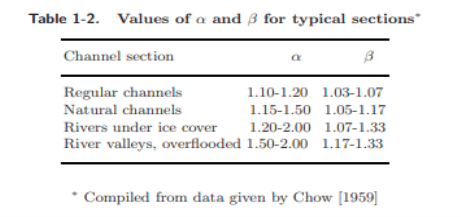
Theoretical values for α and β can be derived from the power-law and the logarithmic law for velocity distribution in wide channels. Chen (1992) derived the theoretical values of α and β using the power-law distribution. The values of α and β for typical channel sections [Temple 1986; Watts et al. 1967; Chow 1959] are listed in Table 1-2. For turbulent flow in a straight channel having a rectangular, trapezoidal, or circular cross-section, α is usually less than 1.15 [Henderson, 1966]. Therefore, it may not be included in the computations since its value is not precisely known and it is nearly equal to unity.
|
Key Takeaways:
- The flow velocity in a channel section varies from one point to another. This is due to shear stress at the bottom and at the sides of the channel and due to the presence of a free surface.
- The velocity head coefficient is given by
|
3. The moment coefficient is given by
|
Example 1-1
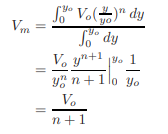
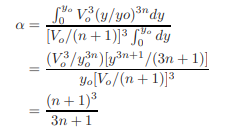
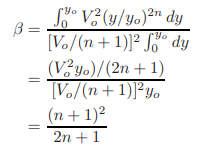
The velocity distribution in a channel section may be approximated by the equation, V = VO(y/yo)n, in which V is the flow velocity at depth y; VO is the flow velocity at depth yo, and n = a constant. Derive expressions for the energy and momentum coefficients.
Solution:
Let us consider the unit width of the channel. Then, we can replace area A in the equations for the energy and momentum coefficients by the flow depth y. Now,
Vm For a unit width, this equation becomes Vm= By substituting the expression for V into this equation, we obtain
By substituting V = Vo(y/yo)n , Vm = Vo/(n + 1), and dA = dy into Eq. 1.5, we obtain
Substitution of V = Vo(y/yo)n and Vm = Vo/(n + 1) into Eq. 1.12 yields
|
|
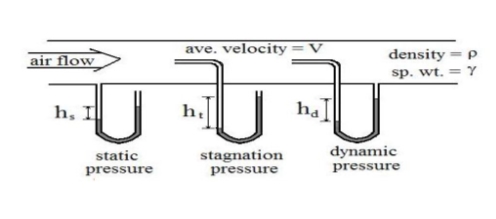
Fig1-8 Types of pressures
Pitot tubes are used in a variety of applications for measuring fluid velocity. This is a convenient, inexpensive method for measuring velocity at a point in a flowing fluid. Pitot tubes (also called pitot-static tubes) are used, for example, to make airflow measurements in HVAC applications and for aircraft airspeed measurements.
Static Pressure, Stagnation Pressure, and Dynamic Pressure - Definitions
Understanding the terms, static pressure, stagnation pressure, and dynamic pressure is very helpful in the explanation of pitot tubes, so they are being defined in this section.
Stagnation pressure is also a measure of the amount that fluid pressure exceeds local atmospheric pressure, but it includes the effect of the fluid velocity converted to pressure. It is measured through a flat opening that is perpendicular to the direction of fluid flow and facing into the fluid flow. Stagnation pressure (also called total pressure) measurement is illustrated with the second U-tube manometer in Fig.1-8.
Dynamic pressure (also called velocity pressure) is a measure of the amount that the stagnation pressure exceeds static pressure at a point in a fluid. It can also be interpreted as the pressure created by reducing the kinetic energy to zero. Its measurement is illustrated with the third U-tube in Fig.1-8.
Static Pressure, Stagnation Pressure, and Dynamic Pressure - Relationships
The symbol, P, is often used for static pressure. Dynamic pressure is given by the expression, ½ ρV2. The stagnation pressure is then given by the following equation:
Pstag = P + ½ ρV2 + γh
Where: ρ is the fluid density (slugs/ft3), γ is the specific weight of the fluid (lb/ft3), h is the height above a specified reference plane (ft), V is the average velocity of the fluid (ft/sec). With the specified units for the other parameters, the pressure will be in lb/ft2.
Velocity Measurement with a Pitot Tube
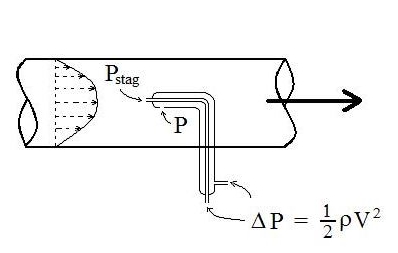
|
Fig. 1-9
For pitot tube measurements and calculations, the reference plane is taken to be at the height of the pitot tube measurements, so the equation for stagnation pressure becomes:
Pstag = P + ½ ρV2 , which can be rearranged to: V = (2ΔP/ρ)1/2
Where ΔP = Pstag – P.
The pressure difference, Δp, (or Pstag – P), can be measured directly with a pitot tube like the third U-tube in the figure above, or with a pitot tube like that shown in the figure at the right. This is a concentric pitot tube. The inner tube has a stagnation pressure opening (perpendicular to the fluid flow) and the outer tube has a static pressure opening (parallel with the fluid flow).
Consider a pitot tube is used to measure air velocity in a heating duct. The air is at 85 oF and 16 psi. The pitot tube registers a pressure difference of 0.021 inches of water (Pstag – P). Calculate the velocity of the air at that point in the duct?
Solution: Convert the pressure difference of 0.021 inches of water to lb/ft2 (psf) using the conversion factor, 5.204 psf/in water.
0.021 inches of water = (0.021)(5.204) psf = 0.1093 psf
The density of air at 85°F and 16 psi can be calculated using the ideal gas law, to be 0.002468 slugs/ft3.
Now V can be calculated: V = (2ΔP/ρ)1/2 = [(2)(0.1093)/0.002468] 1/2 = 9.41 ft/sec.
Key Takeaways:
- Static pressure is a measure of the amount that fluid pressure exceeds local atmospheric pressure. Stagnation pressure is also a measure of the amount that fluid pressure exceeds local atmospheric pressure, but it includes the effect of the fluid velocity converted to pressure. Dynamic pressure (also called velocity pressure) is a measure of the amount that the stagnation pressure exceeds static pressure at a point in a fluid.
- The relationship between static pressure and stagnation pressure is given by
Pstag = P + ½ ρV2 + γh
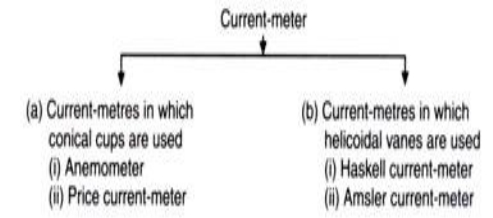
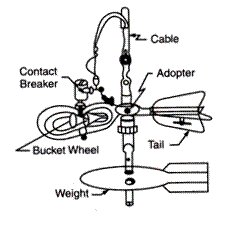
The velocity of flow at any point in the open channel can be most accurately and conveniently determined using a mechanical device named current-meter. Current-meter of common use may be classified into two categories according to the type of revolving part used.
|
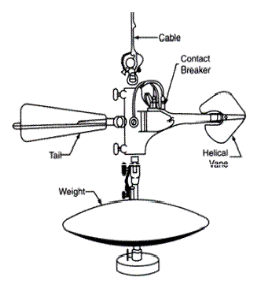
Fig. 1-10 Price current meter
|
Fig.1-11 Amsler current meter
Figures 1-10 and 1-11 give a clear idea about two types of current-meters. In Fig. 1-10, the Price current-meter is shown in which a wheel of conical cups (6 to 8) is mounted on arms of a vertical axis. In Fig. 1-11, Amsler's current-meter is shown in which a series of helicoidal vanes are mounted on a horizontal axis.
The first type of current-meter is better in the following respects:
i. Frictional resistance is usually less.
ii. It starts working even in a current of small velocity.
iii. It does not revolve too rapidly under high-velocity flow.
iv. It tends to measure the full velocity of flow even if it is not oriented very accurately.
v. In turbulent flow it over-registers the velocity. On the other hand, propeller type current meter under registers velocities by about the same amount.
The only disadvantages of conical type current-meter are that while lowering the cup wheel starts rotating even if the water is still.
The current-meter with conical cups is more popular because of its accuracy and efficient working.
In principle the working of the two types is based on the same theory and can be outlined as mentioned below:
1. Working of Current-Meters:
When the meter is lowered in water and when it faces the current of water in the channel the wheel rotates. To keep the meter facing the direction of flow a tail is attached. This tail aligns the meter in the direction of flow. The meter is also fitted with a streamlined weight (fish weight) which keeps the meter in a vertical position. The rate of rotation of the wheel depends on the velocity of flow. A dry battery is kept on the shore or in a boat and an electric current is passed to the wheel from it. A commutator is fixed to the shaft of the revolving wheel.
It makes and breaks the contact in an electrical circuit at each revolution. An automatic revolution counter is kept in the boat or on the shore with the battery which registers the revolutions. When an electric circuit is broken an electric bell in the boat rings or a headphone m the boat buzzes. Then the time taken for a required number of revolutions may be noted. The velocity of flow can be read from a rating table. The rating table is always provided with the meter.
2. Rating of Current-Meter:
The speed of rotation of the cup wheel is a function of the velocity of flow. The cup wheel rotates due to the relative velocity between water and the cup wheel. This fact is utilized in the calibration of the current-meter. Current-meter is rated in a long tank (say 150 m long) with a sectional area of 4 m x 2.5 m. On both sides of the tank, rails are provided. A trolley runs over the rails with known velocities.
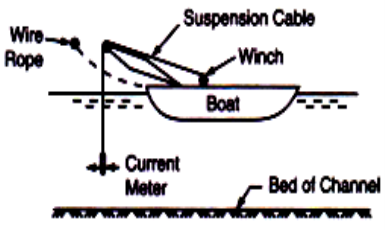
3. Methods of Supporting Current-Meters:
|
Fig. 1-12 Current meter measurement in rivers
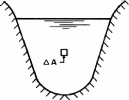
The boat is moored to the wire rope which is stretched across the river, at the determined point in the river. When the channel carries water at shallow depths the suspension cable and the weight are removed and the current-meter is mounted on a wading rod. The rod is made to rest on the channel bed at a required position for taking measurements. In this method as the water is shallow boat is not required. The current-meter may be fixed at any depth on the wading rod for observing velocity.
4. Methods of Measuring Velocity:
When the velocity is measured by the current-meter at 0.5 D then to get the mean velocity of the section the observed velocity should be multiplied with a coefficient of 0.96. Alternatively, to obtain the mean velocity of flow at a particular section, velocities may be observed at 0.2 and 0.8 of depth from the water surface. The mean of these two readings gives the mean velocity of flow at that section. Generally, mean velocity of flow at a section is obtained by keeping the meter at 0.6 B. In the observed velocity, corrections are made for any obliquity of the current with the cross-section line and also for drift. It is necessary to conduct a vertical velocity distribution experiment at each site to decide the point of average velocity.
Key Takeaways:
1) The velocity of flow at any point in the open channel can be most accurately and conveniently determined using a mechanical device named current-meter.
2) The Current-meter of common use may be classified into two categories according to the type of revolving part used: The Price current-meter in which a wheel of conical cups (6 to 8) is mounted on arms of a vertical axis and, Amsler's current-meter is shown in which a series of helicoidal vanes are mounted on a horizontal axis.
(PART B)
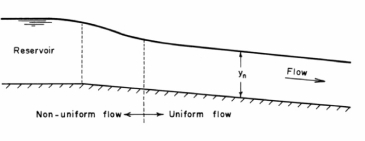
In free-surface flow, the component of the weight of water in the downstream direction causes acceleration of flow (it causes deceleration if the bottom slope is negative), whereas the shear stress at the channel bottom and sides offers resistance to flow. Depending upon the relative magnitude of these accelerating and decelerating forces, the flow may accelerate or decelerate. For example, if the resistive force is more than the component of the weight, then the flow velocity decreases and, to satisfy the continuity equation, the flow depth increases. The converse is true if the component of the weight is more than the resistive force. However, if the channel is long and prismatic (i.e., channel cross-section and bottom slope do not change with distance), then the flow accelerates or decelerates for a distance until the accelerating and resistive forces are equal. From that point on, the flow velocity and flow depth remain constant (Fig. 1-13). Such a flow, in which the flow depth does not change with distance, is called uniform flow, and the corresponding flow depth is called the normal depth. An equation relating the bottom shear stress to different flow variables is first derived. Various empirical resistance formulas used for the free-surface flows are then presented. A procedure for computing the normal depth for a specified discharge in a channel of known properties is outlined.
|
Fig1-13 Uniform and non-uniform flows
Steady and Uniform Flow in Open Channels
• Steady flow is characterized by no changes in time.
• Uniform flow is characterized by the water cross-section and depth remaining constant over a certain reach of the channel.
• For any channel of given roughness, cross-section, and slope, there exists one and only one water depth, called the normal depth, at which the flow will be uniform.
• Given steady flow conditions, the uniform flow will eventually be established in any channel which continues sufficiently far with constant slope and cross-section.
• For steady uniform channel flow, channel slope, depth, and velocity all remain constant along the channel.
For a general derivation, we first derive an equation for nonuniform flow and then simplify it for uniform flowas a special case of nonuniform flow.
- Chezy Equation
To derive the Chezy equation, we make the following assumptions:
The flow is steady;
the slope of the channel bottom is small;
and the channel is prismatic.
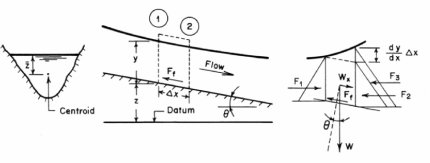
Let us consider a control volume of length Δx, as shown in Fig. 1-14. At the upstream side of this control volume, let the distance be x, flow velocity be V, and the flow depth be y. Then, the values of these variables at the
downstream side are x + Δx, V + (dV /dx)Δx, and y + (dy/dx)Δx).
The following forces are acting on the control volume: pressure force on the upstream side, F1; pressure forces on the downstream side, F2 and F3; a component of the weight of water in the control volume in the downstream direction, Wx; and the shear force, Ff, acting on the channel bottom and the sides. Referring to Fig. 1-14, the expression for these forces may be written as follows:
Pressure force, F1 = γAz¯ (1.13)
in which z¯ = depth of the centroid of flow area A below the water surface and γ = specific weight of water. The component of the weight of water in the downstream direction,
Wx = γAΔx sin θ (1.14)
in which θ = angle between the channel bottom and the horizontal axis. Since the channel-bottom slope is assumed to be small, sin θ ∗ tan θ ∗ −dz/dx.
Note that the negative sign is because z decreases as x increases. Hence, we may write Eq. 1.14 as
|
Fig. 1-14. Definition sketch
Wx = −γA dx Δx (1.15)
The pressure force acting on the downstream side of the control volume may be divided into two parts, as shown in Fig. 1-14. F2 is the pressure force due to flow depth, y, and F3 is the pressure force for the increase in depth in distance, Δx. The expressions for F2 and F3 are
F2 = γAz¯
and
F3 = γA dx Δx (1.16 )
Note that in the expression for F3, we have neglected the higher-order term, which corresponds to the small triangle at the top. If the average shear stress acting on the channel bottom and sides is τo, then the shearing force,
Ff = τoP Δx (1.17)
in which P = wetted perimeter. Referring to Fig. 1-14, the resultant force, Fr, acting on the control volume in the downstream direction is
Fr = ΣF = F1− (F2+ F3) + Wx – Ff (1.18)
Substituting Eqs. 1.13 through 1.17 into Eq. 1.18, and simplifying, we obtain
|
(1.19)
To apply the Reynolds transport theorem, 1the intensive property,β = V.
Therefore,
 (1.20)
Since the flow is assumed to be steady, the first term on the right-hand side of this equation is zero. By substituting for Fr from Eq. 1.19 into Eq. 1.20, dividing both sides by γAΔx, and applying the mean value theorem to the right-hand side, we obtain
It follows from this equation that
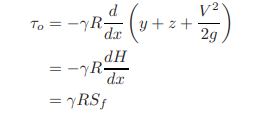
in which R = A/P = hydraulic radius. This equation may be simplified as
|
in which Sf = slope of the energy grade line = -dH/dx. Note that we are using a negative sign since H decreases as x increases.
If the flow is steady and uniform, then by definition dV /dx = 0 and
dy/dx = 0.
Also, since So = −dz/dx, Eq. 1.23 may be written as
Τ0 = γRSo (1.24)
Based on dimensional analysis, we may write
Τ0 = kρV2 (1.25)
in which k is a dimensionless constant that depends upon the Reynolds number, the roughness of the channel bottom and sides, etc. It follows from Eqs. 1.23 and 1.25 that
 (1.26)
This equation may be written as
V = C√RSf (1.27)
in which C = Chezy constant. This equation was introduced by a French engineer named Antoine Chezy, in 1768 while designing a canal for the water- supply system of Paris. [Henderson, 1966; Chow, 1959] Note that Eq. 1.27 is valid for nonuniform, steady flow. For uniform flow we use Eqs. 4-8 and 4-9 in-stead of Eqs. 1.24 and 1.25. As a result, we obtain the following equation instead of Eq. 1.27:
V = C√RSo (1.28)
Note that Eq. 1.27 for non-uniform flow and Eq. 1.28 for uniform flow are similar except that we use the slope of the energy grade line, Sf, for nonuniform flow, but we use the slope of the channel bottom, So, (which has the same value as the slope of the energy grade line or the slope of the water surface) for the uniform flow.
It is clear from Eq. 1.27 or 1.28 that C has dimensions of √length/time as compared to the Darcy Weisbach friction factor, f, which is dimensionless. However, like f, C depends upon the channel roughness and the Reynolds number, Re. It may depend upon the channel cross-sectional shape as well, although this dependence appears to be small and may be neglected. Because the channel roughness may vary over a wide range, its effect on C has not been as thoroughly investigated as that on f.
Let us now compare the Chezy equation, Eq. 1.27, for open channels with the Darcy-Weisbach friction formula for pipes,
 (1.29)
in which hf = head loss in a pipe of diameter D and length L. The slope of the energy grade line, S = hf /L. Therefore, we may write this equation as
V= (1.30)
Noting that the hydraulic radius, R, for a pipe is equal to D/4, Eq. 1.27 becomes
V = C.√ DS/4 (1.31)
It follows from the above two equations that C = √8g/f.
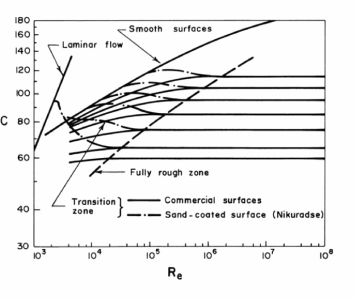
Figure 1-15 shows the Moody diagram plotted with C as the ordinate instead of f. This diagram is divided into three regions: hydraulically smooth, transition, and fully rough. A flow may be considered hydraulically smooth even though the channel surface is rough, provided the projections of the surface roughness are covered by the laminar sublayer. As the Reynolds number increases, the thickness of this layer decreases, and the effect of roughness projections on flow becomes important. Then, the flow is in the transition region. However, when the roughness projections are not covered by the viscous sub-layer and dominate the flow because losses are due to form drag, flow may be classified as fully rough. These flow types may be classified based on the value of a dimensionless number, Rs = kV*/ν. In this expression, ν is the kinematic viscosity of the liquid; k is a characteristic length parameter for the size of the channel-surface roughness; and, V* is the shear velocity, which is defined as
 (1.32)
|
Fig. 1-15. Modified Moody diagram
The flow is considered smooth if Rs < 4; transition if 4 < Rs< 100; and fully rough if Rs > 100. The expressions for C for smooth and rough flows derived from the experimental data on flow through pipes are:
Smooth flows
C = 28.6Re1/8 if Re < 105 (1.33) and (1.34)
Rough flows
|
The preceding equations are valid only for small channels with fairly smooth surfaces since these are based on pipe data. Empirical relationships and field observations should be employed for large channels with rough flow surfaces.
- Manning Equation
Since the derivation of the Chezy equation in 1768, several researchers have tried to develop a rational procedure for estimating the value of the Chezy constant, C. However, unlike the Darcy-Weisbach friction factor for the closed conduits, these attempts have not been very successful, because C depends upon several parameters in addition to the channel roughness. Based on the field observations, Ganguillet and Kutter [Chow, 1959] proposed a complex formula for C. Later, Gauckler and Hagen independently showed that
C ∝ R1/6 (1.36)
According to Henderson [1966], a French engineer named A. Flamant incorrectly attributed the above equation to an Irishman, R. Manning, and expressed it in the following form in 1891
|
(1.37)
in which n = Manning coefficient. This is the Manning equation, which has been very widely used in English-speaking countries.
Again note that n is not a dimensionless constant and has the dimensions of (length)1/3/time. Therefore, we convert this equation so that the value of n is the same in both SI and English units.
Equation 1.37 is valid for SI units, i.e., V is in m/s, and R is in m. In the foot-pound-second units, this equation becomes
|
(1.38)
in which V is in ft/sec and R is in ft. As a result of this conversion, the value of n is the same in both systems of units.
The value of n depends mainly upon the surface roughness, amount of vegetation, and channel irregularity, and, to a lesser degree, up on stage, scour and deposition, and channel alignment.
Table 1.3 lists the typical values of n for different materials, compiled from an extensive table presented by Chow [1959], listing maximum, minimum, and normal values of n.
Material
Metals | n |
Steel | 0.012 |
Cast iron | 0.013 |
Corrugated metal | 0.025 |
Non-metals Lucite |
0.009 |
Glass | 0.010 |
Cement | 0.011 |
Concrete | 0.013 |
Wood | 0.012 |
Clay | 0.013 |
Brickwork | 0.013 |
Gunite | 0.019 |
Masonry | 0.025 |
Rock cuts | 0.035 |
Natural streams Clean and straight |
0.030 |
Table 1.3 Typical values∗ of Manning n
Christensen [1984a] investigated the range of validity of the Manning equation assuming that the Nikuradse’s equations [1932] for the friction factors of closed conduits are valid for the free-surface flows. By substituting the approximation
for rough turbulent flows in circular conduits into Eq. 1.30 and noting that for closed conduits R = D/4, we obtain
(1.40)
|
A comparison of Eqs. 1.37 and 1.40 show that they are identical if we replace 1/n of Eq. 1.37 with 8.25√g/k1/6 of Eq. 1.40. This relationship between n and ks is almost identical to Strickler’s formula reported by Forchheimer in 1930.
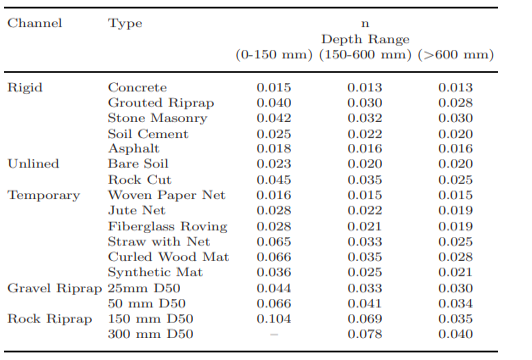
Equation 1.40 has the following advantages over Eq.1.37: Manning n is difficult to estimate since it does not have any physical meaning. On the other hand, k is physically based and is directly related to the size of surface roughness, which can be measured. Also, since k is raised to the one-sixth power, an error in estimating its value has a considerably less effect on the computed value of V as compared to that introduced by a similar error in the estimation of n. Manning coefficient, n, increases for very shallow depths where the lining roughness height approaches the depth of flow. For lined channels, a constant n value is acceptable; however, to account for shallow flow depths, a higher n value should be considered [Chen and Cotton, 1988]. Henderson [1966] presented an equation for n that is a function of the riprap size only.
n = Cm(3.28d50) 1/6 (1.41)
where d50 = mean gravel diameter, in m. For Cm for gravel-bed streams, Henderson [1966] recommended a value of 0.034, Hager [2001] suggested 0.039 and Maynord [1991] recommended 0.038. Based on the experimental data of Blodgett and McConaught [1985], Chen and Cotton [1988] presented an equation for n as a function of hydraulic radius and tractive force
|
(1.42)
where R = hydraulic radius, in m.
For vegetation-lined channels, a constant n may not be suitable due to significant variation in the amount of submergence of the vegetation with changes in inflow and the resulting shear stress. Therefore, Chen and Cotton [1988] presented the following equation for n for grass-lined channels as a function of hydraulic radius and tractive force, based on the studies of Kouwen et al. [1969 and 1980]
|
(1.43)
where So is the channel bottom slope, and C is a dimensionless factor depending on the class of vegetation and R is in m. Soil Conservation Service (SCS) classified various types of vegetation into five categories [1954] depending on the maturity of grass, with Retardance Class A corresponding to the highest resistance and Class E to the lowest resistance. Table 1.4 [Akan, 2006] shows various Retardance Classes of common grass types with the corresponding C values taken from the design charts presented by Chen and Cotton [1988] utilizing the data of Kouwen et al. [1980].
|
Table 1.4 Manning n for Different Channel Linings∗
Key Takeaways:
C = 28.6Re1/8 if Re < 105 and
For rough flows,
3. Mannings coefficient is given by:
|
To analyse open channel flow, it is usually necessary to know the normal depth, yn. Several procedures for computing the normal depth in a given channel for a specified discharge are discussed in this section. We will consider only the Manning equation in our discussions since it is very widely used in English-speaking countries. These discussions are valid for the Strickler equation as well if we replace n by 1/ks. The Manning equation for uniform flow in terms of discharge may be written as
|
(1.44)
in which Co = 1.49 in Customer English units and Co = 1 in SI units.
In this equation, A and R are a function of the flow depth, y, and of the channel cross-section, whereas n is a function of the flow surface and other factors discussed in the previous section. Thus, for a given channel section and specified bottom slope, only one discharge is possible for a given normal depth. However, if the value of this depth is known, then we can determine the corresponding discharge directly from Eq. 1.44. We may write this equation as
Q =KSo1/2 (1.45)
in which the conveyance factor, K, for the channel section is defined as
|
(1.46)
Note that K is a function of the normal depth, properties of the channel section, and Manning n.
Equation 1.44 may be written as
|
(1.47)
in which the left-hand side is referred to as the section factor. Thus, for the specified values of n, Q, and So, we solve this equation to determine the normal depth in a given channel. This may be done by using the design charts presented by Chow [1959], by a trial-and-error procedure, or by using numerical methods for the solution of a nonlinear algebraic equation.
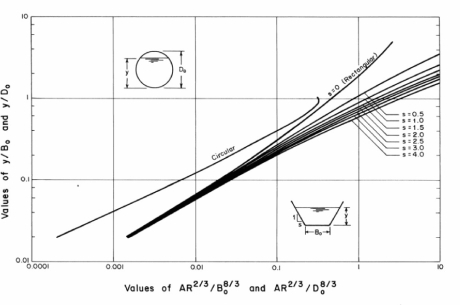
Design Curves
These curves are presented in Fig. 1-16 for a trapezoidal and a circular channel section. If we want to determine the normal depth for a specified discharge in a given channel section, then we know Q, n, and So. Therefore, we can compute the right-hand side of Eq.1.47. Let us divide this computed value by Bo8/3 if the channel section is trapezoidal and by Do8/3 if the channel cross-section is circular. The resulting value is then equal to AR2/3/Bo8/3 for a trapezoidal section and equal to AR2/3/Do8/3 for a circular cross-section. Now, yn/Bo or yn/Do corresponding to the value of AR2/3/Bo2/3 or AR2/3/Do8/3 may be directly read from Fig. 1-16.
Trial-and-Error Procedure
Substitute expressions for the flow area A, hydraulic radius, R, and the values of n, Q, and So into Eq.1.47 and then, solve the resulting equation by a trial-and-error procedure.
Numerical Methods
Several methods, such as the bisection method, method of successive approximations, Newton method, are available [McCracken and Dorn, 1964; Chapra and Canale, 2006] for solving Eq. 1.47. We discuss only the Newton method. To determine yn by this method, we write Eq. 1.47 as
|
(1.48)
|
Fig. 1-16. Curves for the computation of normal depth (After Chow [1959])
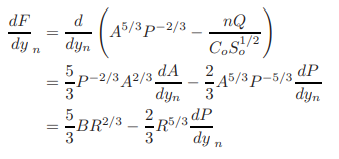
For the Newton method, we need the first derivative of function F. An expression for this derivative may be obtained as follows:
|
(1.49)
since dA/dyn = B. For a trapezoidal section having side slopes of s horizontal to 1 vertical, dP/dyn = 2√1 + s2. Similar expressions for other channel sections may be obtained.
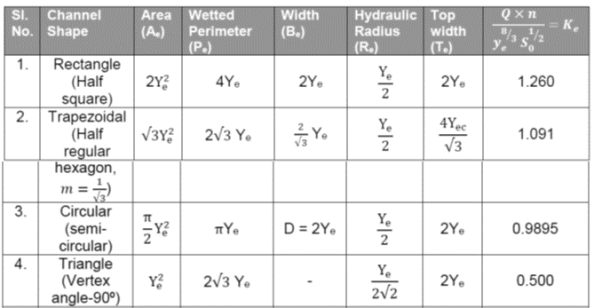
The conveyance of a channel section of a given area increases with a decrease in its perimeter. Hence a channel section having the minimum perimeter for a given area of flow provides the maximum value of the conveyance. With the slope, roughness coefficient, and area of flow fixed, a minimum perimeter section will represent the hydraulically efficient section as it conveys the maximum discharge. This channel section is also called the best section. Proportions of some most efficient sections are given in Table 1.5
Table1.5
|
Where,
n: Manning’s Coefficient
e subscript: most efficient
Ye: Depth of flow for the most efficient section in m
Qn: Discharge in m3/sec
So: Bed slope
Key Takeaways:
2. With the slope, roughness coefficient, and area of flow fixed, a minimum perimeter section will represent the hydraulically efficient section as it conveys the maximum discharge.
|
References:
1. Fluid Mechanics – Streeter-McGraw-Hill International Book Co., Auckland.
2. Flow in open channel – V. T. Chaw - McGraw-Hill International Book Co., Auckland.
3. Fluid Mechanics – K. L. Kumar – Eurasia Publication House, Delhi.

