The streamlines in the uniform and gradually varied flows we considered in the previous chapters are either parallel or maybe assumed as parallel. Therefore, the accelerations in these flows are negligible and the pressure distribution may be assumed as hydrostatic. The analyses in which the pressure distribution is hydrostatic are referred to as the shallow-water theory. However, many times the streamlines have sharp curvatures, thereby assuming hydrostatic pressure distribution invalid. Besides, the flow surface may become discontinuous if the flow depth changes rapidly such that the surface profile breaks, e. g., in a hydraulic jump.
Due to non-hydrostatic pressure distribution, rapidly varied flow can not be analyzed by using the same approach as that for parallel flow. In the past, these flows have been mainly investigated experimentally; and empirical relationships and other information in the form of charts and diagrams have been developed. Each particular phenomenon has been studied more or less in isolation, and a considerable amount of information is available for typical design applications.
The rapidly varied flows have been analyzed based on the Boussinesq and Fawer assumptions. In the Boussinesq assumption, the vertical flow velocity is assumed to vary linearly from zero at the channel bottom to the maximum at the free surface. In the Fawer assumption, this variation is assumed to be exponential. The rapidly varied flow usually occurs in a short distance. Therefore, the losses due to shear at the channel boundaries are small and maybe neglected in a typical analysis. However, because of sudden changes in the channel geometry, the flow may separate, and eddies and swirls may form. These phenomena complicate the flow pattern, and it becomes difficult to generalize the velocity distribution at a cross-section. Even in those cases where it may be possible to approximate the velocity distribution, the energy coefficient, α, and the momentum coefficient, β, are difficult to quantify and usually have a value significantly higher than unity. Because of separation zones, the formation of rollers and eddies, it becomes difficult to define the flow boundaries and to determine the average flow variables for a cross-section.
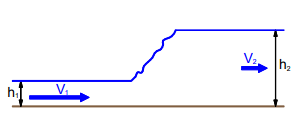
A hydraulic jump is an abrupt change from a shallow, high-speed flow to a deep, low-speed flow of lower energy.
|
Fig 3-1 Hydraulic Jump
It occurs when a depth difference is imposed by upstream and downstream conditions. Rapid, shallow flow may be created by, for example, a steep spillway or sluice. A slower and deeper downstream flow may be controlled by a downstream weir or by a reduction in slope.
The triggering of a hydraulic jump at the base of a spillway is desirable to remove surplus kinetic energy, to reduce downstream erosion.
Across a hydraulic jump:
• mass is conserved;
• the momentum principle is satisfied;
• mechanical energy is lost (mostly as heat).
Assume, for simplicity:
• velocity uniform over upstream and downstream cross-sections;
• small slope (so that the downslope component of weight can be neglected);
• the length of the jump is short (so that bed friction can be neglected);
• wide or rectangular cross-section
Continuity
The volume flow rate 𝑄 = 𝑉𝐴 is the same at each section. Velocities can thus be related to cross-sectional area 𝐴 (and hence to depth) by
V= Q/A (3.1)
Momentum:
Consider a control volume encompassing the jump. By the momentum principle: net pressure force = rate of change of momentum
|
Since streamlines are parallel there, pressures at inflow and outflow stations 1 and 2 are hydrostatic and the average pressure is the pressure at the centroid; i.e. 𝑝̅= ρ𝑔𝑑̅, where 𝑑̅is the depth of the centroid below the surface. Using this, and substituting for velocity,
|
|
Fig. 3-2
At this point, we restrict ourselves to a rectangular or wide channel (but, for different shapes, see the Examples). With 𝑏 the width of the channel (or 𝑏 = 1 unit for a “wide” channel): 𝑑̅= 1 /2 ℎ, 𝐴 = ℎ𝑏, 𝑄 = 𝑞𝑏 and the momentum principle reduces to
Dividing by ρ𝑏:
Divide through by 𝑔(ℎ1 − ℎ2) (non-zero by assumption) and then multiply by ℎ1ℎ2:
Since we are looking for the depth ratio ℎ2⁄ℎ1, divide through by ℎ1 3 :
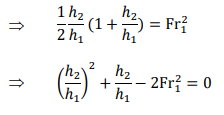
Since 𝑞 = 𝑉ℎ, the RHS is 𝑉12 /𝑔ℎ1 or Fr12. Hence,
(3.5)
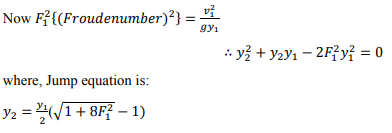
This is a quadratic equation for the depth ratio ℎ2⁄ℎ1 and its positive root gives the downstream depth in terms of upstream quantities:
|
Key Takeaways:
- A hydraulic jump is an abrupt change from a shallow, high-speed flow to a deep, low-speed flow of lower energy. It occurs when a depth difference is imposed by upstream and downstream conditions.
- The triggering of a hydraulic jump at the base of a spillway is desirable to remove surplus kinetic energy, to reduce downstream erosion.
- The downstream depth is given by
|
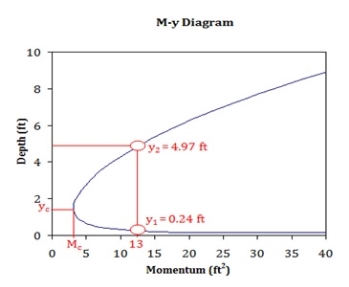
In fluid dynamics, the conjugate depths refer to the depth (y1) upstream and the depth (y2) downstream of the hydraulic jump whose momentum fluxes are equal for a given discharge (volume flux) q. The depth upstream of a hydraulic jump is always supercritical. It is important to note that the conjugate depth is different from the alternate depths for the flow which are used in energy conservation calculations.
|
Fig. 3-3 M–y diagram.
Beginning with an equal momentum flux M and discharge q upstream and downstream of the hydraulic jump:
(3.7) Rearranging terms gives:
Multiply to get a common denominator on the left-hand side and factor the right-hand side:
The (y2−y1) term cancels out:
Divide by y12
Thereafter multiply by y2 and expand the right-hand side:
Substitute x for the constant y2/y1:
Solving the quadratic equation and multiplying it by √4/2 gives:
Substitute the constant y2/y1 back in for x to get the conjugate depth equation
Note that this equation is only applicable to hydraulic jumps over flatbeds.\
|
- The ratio of Sequent Depths
|
The above Equation relates the flow depths on the upstream and downstream sides of a classical jump in terms of the Froude number at the entrance to the jump, Fr1. Let's say Fr1 is the approach Froude number. From this equation, it can be proved that for Fr1 > 2,
|
in which the ratio of the sequent depths, yr = y2/y1. This is a linear relationship between the ratio yr and the approaching Froude number. The viscous effects become important as the Reynolds number Re1 = V1y1/ν becomes small or as both Fr1 and y1/B (B = channel width) become too large [Hager and Bremen, 1989]. Such a condition is possible on the scale models. As a rough guide, the equations derived by neglecting the viscous losses may be used with confidence for Fr1 < 12 if Re1 > 105.
- Length of Jump
The length of a jump is needed to select the apron length and the height of the sidewalls of a stilling basin. To determine the length of a jump during laboratory investigations, it is difficult to mark the beginning and the end of a jump because of the highly turbulent flow surface, the formation of roller and eddies, and air entrainment. Besides, the surface disturbances are random, and the time-averaged quantities may not always give consistent results. The length of the roller may be taken to the point where the flow velocity at the top reverses and the jet continues.
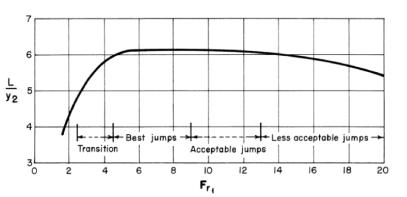
For practical applications, experimental data have been summarized in a non-dimensional form relating the approach Froude number, Fr1, and L/y1 or L/y2, where L = length of the jump. Although a satisfactory correlation has been observed for L/y1, a considerable amount of disagreement exists between the data reported by different researchers for L/y2. Figure 3-4 shows the curve recommended by the Bureau of Reclamation. The following equation for the length of the roller, Lr gives good results if y1/B < 0.1
|
Also, by using the criterion that the turbulence has diminished at the end of the jump, Hager [1991a] developed the following equation for the length of the jump
|
or simply, L = 6y2 for 4 < Fr1 < 12.
|
Fig. 3-4. Length of hydraulic jump
- Jump Profile
The information on the jump profile is needed to determine the weight of water in a dissipator to counteract the uplift force if the basin floor is laid on a permeable foundation. Also, the height of the sidewalls may be varied for economic reasons if the water profile is known.
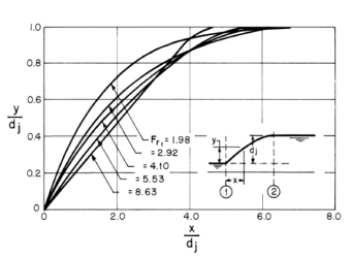
Figure 3-5 shows the jump profiles for different approach Froude numbers. For design purposes, the vertical pressure on the basin floor may be assumed to be the same as that corresponding to the hydrostatic pressure for the profile depth. This has been confirmed by several experimental investigations.
Based on extensive laboratory experiments, Hager [1991a] developed the following empirical relationship for the flow depth, y, at distance, x, from the beginning of the jump
Y = tanh(1.5X) (3.12)
in which X = x/Lr; Y = (y − y1)/(y2 − y1) and Lr = length of the roller.
|
Fig. 3-5. Jump profile
- Jump types
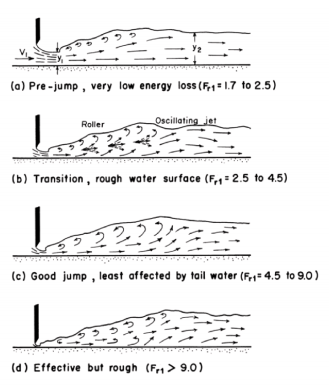
The hydraulic jump occurs in four distinct forms [Peterka, 1958] depending upon the approach Froude number, Fr1, as shown in Figure 3-6. Each of these forms has a distinct flow pattern, formation of rollers and eddies, etc. The energy dissipation in the jump depends upon the flow pattern and the strength of the rollers. The range of Froude numbers listed in the following paragraphs for various types of jumps is not precise, and there is some overlap from one type to the other.
Weak jump ( 1 < Fr1 < 2.5)
For 1 < Fr1 < 1.7, y1 and y2 are approximately equal to each other and only a slight ruffle is formed on the surface. This undulation results in very little energy dissipation. However, as Fr1 approaches 1.7, many small rollers are formed on the water surface, although the downstream water surface remains smooth. The energy loss is low in this jump.
Oscillating jump (2.5 < Fr1 < 4.5)
The jet at the entrance to the jump oscillates from the bottom to the top at an irregular period. Turbulence may be near the channel bottom at one instant and the water surface at the next. These oscillations result in the formation of irregular waves, which may persist for a long-distance downstream of the jump. They may cause considerable damage to the channel banks. Therefore, this range of Fr1 should be avoided while designing an energy dissipator.
Steady jump (4.5 < Fr1 < 9)
For this range, the jump forms steadily at the same location, and the position of the jump is least sensitive to the downstream flow conditions. The jump is well-balanced and the energy dissipation is considerable.
Strong jump (Fr1 > 9)
In this case, the difference between the conjugate depths is large. At irregular intervals, slugs of water roll down the front of the jump face into a high-velocity jet and generate additional waves. The jump action is very rough and the dissipation rate is high.
|
Fig. 3-6. Jump types
- Energy loss
The difference between the total head upstream and downstream of the jump is the energy loss in the jump. For a horizontal channel bottom, this is the same as the difference in the specific energy upstream and downstream of the jump. We may derive an expression for this head loss, hl, as follows:
|
in which the subscripts 1 and 2 refer to the quantities upstream and downstream of the jump. By substituting q = V1y1 = V2y2 and doing several algebraic manipulations, Eq. 3.13 may be written as
|
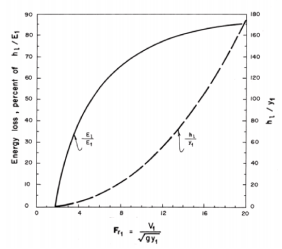
This is a theoretical expression for the head losses in a classical jump. Figure 3-7, based on experimental results, shows the energy dissipation in a jump for different values of the approach Froude number.
|
Fig. 3-7. Energy dissipation in jump
Jump Location
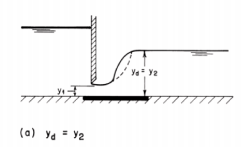
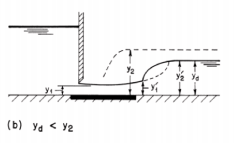
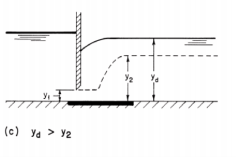
A hydraulic jump is formed at a location where the flow depths upstream and downstream of the jump satisfy the equation for the sequent depth ratio. We will illustrate the location of jump formation by considering the flow downstream of a sluice gate. Let the flow depth at the sluice outlet be y1 and the sequent depth corresponding to this depth be y2. There are several different possibilities for the formation of the jump, depending upon the tailwater depth, yd.
|
The jump is formed on the apron if the downstream depth, yd, is equal to the depth y2 required by below Eq (Fig.3-8a).
If yd is less than y2, then the jump moves downstream to a point where the upstream depth y1 is the sequent depth to yd, (Fig. 3-8b). In this figure, we have used a broken line to show the sequent depth y2 required for the depth y1 at the sluice outlet. However, if the tailwater depth is higher than the required amount, then the jump is pushed back, as shown in Fig. 3-8(c). This is called submerged, or drowned, jump.
|
Fig. 3-8 Jump location
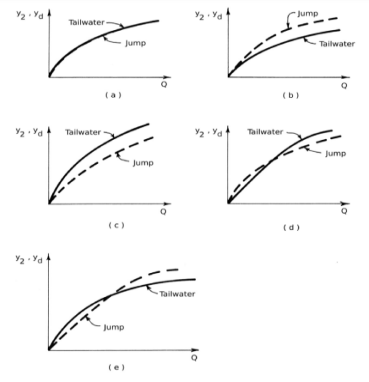
Tailwater level plays a significant role in the formation of jump at a particular location. In most practical situations, the tailwater level depends upon the channel discharge, Q. A curve between Q and the tailwater level is referred to as the tailwater rating curve. Similarly, we may prepare a curve between y2 and Q, which we will refer to as the jump curve. Depending upon these two curves, five different flow situations are possible [Leliavsky, 1955]. These are shown in Fig. 3-9, in which a full line is used for the tailwater curve and a broken line is used for the jump curve. These five cases are discussed in the following paragraphs.
In case (a), the tailwater rating curve and the jump curve coincide for all rates of discharge. The requirements for the sequent depth are always satisfied and the jump forms at the same location. This is an ideal situation that rarely occurs in nature.
The jump curve is always above the tailwater curve for case (b). The downstream depth is less than the required sequent depth and the jump moves further downstream. To ensure jump formation on the apron, a sill may be used.
In case (c) the tailwater curve is always above the jump curve. Thus the downstream depth is more than that required by the sequent depth. The jump moves upstream and may drown. The jump may be controlled at the desired location by providing a drop in the channel bottom or by letting the jump form on a sloping apron.
The tailwater curve is below the jump curve at low discharges and above it for higher discharges in case (d). The stilling basin may be designed so that the jump is formed in the basin at low rates of discharges and the jump moves on to a sloping apron at higher discharges.
Case (e) is opposite to case (d) in the sense that the tailwater curve is above the jump curve at low discharges and below the jump curve at high discharges. A stilling pool may be designed in this case to form the jump at high discharges.
|
Fig. 3-9. Effect of tailwater level on jump formation
- Control of Jump
The location of a jump may be controlled by providing several appurtenances, such as baffle blocks, sill, drop or rise in the channel bottom. The sill may be sharp- or broad-crested weir. Typically, the flow in the vicinity of these appurtenances is rapidly varied and the velocity distribution is not uniform. As a result, it becomes difficult to apply the momentum equation to analyze accurately the formation of jump. Therefore, laboratory experiments are done to develop empirical relationships for universal applications, and model studies are conducted for specific projects.
Key Takeaways:
- The conjugate depths refer to the depth (y1) upstream and the depth (y2) downstream of the hydraulic jump whose momentum fluxes are equal for a given discharge (volume flux) q.
- It is given by equation
|
3. Some of the characteristics of Hydraulic jump are
|
- The hydraulic jump is the most commonly used choice of design engineers for energy dissipation below spillways and outlets. A properly designed hydraulic jump can provide for 60-70% energy dissipation of the energy in the basin itself, limiting the damage to structures and the streambed. Even with such efficient energy dissipation, stilling basins must be carefully designed to avoid serious damage due to uplift, vibration, cavitation, and abrasion. An extensive literature has been developed for this type of engineering.
- While traveling down the river, kayaking, and canoeing paddlers will often stop and playboat in standing waves and hydraulic jumps. The standing waves and shock fronts of hydraulic jumps make for popular locations for such recreation.
Similarly, kayakers and surfers have been known to ride bores up rivers.
- Usually, a hydraulic jump reverses the flow of water. This phenomenon can be used to mix chemicals for water purification.
- Hydraulic jump usually maintains the high water level on the downstream side. The water level can be used for irrigation purposes.
- The hydraulic jump can be used to remove the air from the water supply and sewage lines to prevent the air locking.
The flow velocity at the toe of a high-head spillway is usually high and may cause serious scour and erosion of the downstream channel if proper precautions are not taken. For this purpose, energy dissipators are provided to dissipate a sufficient amount of energy before the water enters the downstream channel.
|
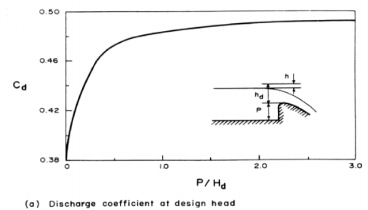
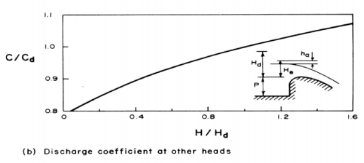
Fig. 3-10. Discharge coefficient
To have an idea about the amount of energy dissipation, let us consider an example.
The Grand Coulee dam, located on the Columbia River in the United States of America. The design discharge for the spillway is 28,320 m3/s, and the upstream and the tailwater levels for this flow are 393.8 m and 308.23 m respectively. Assuming no losses on the spillway face, the amount of energy at the toe = ρgQH, where H is the difference between the headwater and tailwater levels. Substitution of the values of different variables into this expression yields energy of 23 GW. This should give us an idea about the amount of energy involved and clearly shows that even excellent rock may be eroded if proper measures are not taken.
Three types of energy dissipators [Hager, 1992; Hager and Vischer, 1992] have been commonly used: stilling basins, flip buckets, and roller buckets [Mason, 1982]. Each dissipator has certain advantages and disadvantages and may be selected for a particular project depending upon the site characteristics.
|
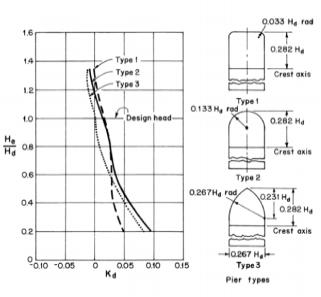
Fig. 3-11. Pier coefficient
|
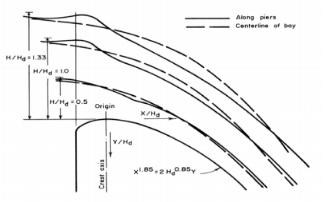
Fig. 3-12. Water-surface profile
Key Takeaways:
- Energy dissipators are provided to dissipate a sufficient amount of energy before the water enters the downstream channel.
- Three types of energy dissipators have been commonly used: stilling basins, flip buckets, and roller buckets
The sudden changes of flow in the open channel result in the increase or decrease of flow depth are called the "surge" in an open channel. This could take place when there is a breaching of dams due to earthquakes or regulating the hydropower sluice gates. Hence results in positive and negative surges in the downstream river channel or the downstream tail channel of hydropower projects. This phenomenon also governs when there would be flood (unsteady flow) during the monsoon period in natural river channels and the hydrograph significantly varies with rising and falling as the rainfall takes its peak period. The flood wave generates during the positive or negative surges is called the celerity (wave velocity) of the flood in an unsteady flow situation.
This positive or negative surge sometimes travels downstream or upstream depending on the situation. The increase in flow depth would become the crest of the surges and the decrease in the flow depth would become the trough of the surges.
|
Fig. 3-13 Propagation of low wave in channel
The celerity or speed of propagation relative to the water is given by √gy where y is the water depth. Therefore the velocity of the wave relative to a stationary observer is:
c= √gy+-v (3.15)
This can be noted that the Froude number Fr expressed by v/√gy is the ratio of water velocity to wave celerity. If the Froude number is greater than unity, which corresponds with the supercritical flow, a small gravity wave cannot be propagated upstream. Waves of finite height are dealt with in a section of open channel surges.
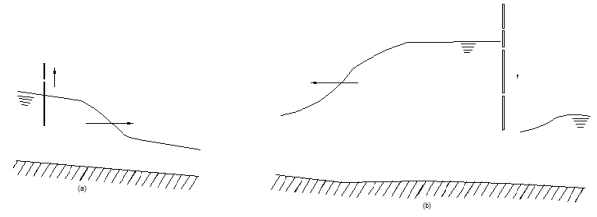
A surge is produced in the channel by a rapid change in the rate of flow, for example, by the rapid opening or closure of sluice gates of the project. The former causes a positive surge wave to move downstream (Fig. 3-14a) and the latter produces a positive surge wave that moves upstream. (Fig. 3-14b)
|
Fig 3-14 Positive surge waves
A stationary observer, therefore, sees an increase in depth as the wavefront of a positive surge wave passes. A negative surge wave, on the other hand, leaves a shallower depth as the wavefront passes. (Shown in fig. 3-15)
|
Fig 3-15 Negative Surge Waves
Negative Surge waves in the downstream River Channel are produced to a 12MW Jhimruk hydropower plant when the sluice gates are suddenly being closed (shown in fig. 3-15). It is illustrated from the figure that each type of surge can move upstream or downstream.
Analytical Methods
The upstream positive surge wave
Consider the propagation of a positive wave upstream in a frictionless channel resulting from gate closure (shown in fig 3-16)
|
Fig 3-16 Upstream Positive Surges
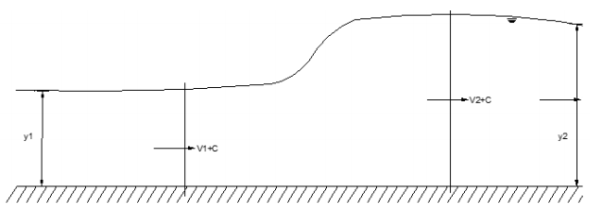
The front of the surge wave is propagated upstream at celerity, c, relative to the stationary observer. To the observer, the flow situation is unsteady as a wavefront passes; to an observer traveling at a speed, c, with the wave the flow appears steady although non-uniform. The following fig shows the surge reduced to a steady state.
|
Fig. 3-17
The continuity equation is: A1(V1+c)= A2(V2+c) (3.16) The momentum equation is:
Where y1ˉ and y2ˉ are respective depths of the centers of the area. From simplification, we get
In the special case of the rectangular channel,
From the above equation, it can be written as
then; The hydraulic jump in a stationary surge. Putting c=0, in the above equation
In the case of a low wave where y2 approaches y1 then the equation becomes Then c=√gy=v1 (3.20) And in still water (v1=0) c=√gy (3.21)
|
The downstream positive surge
This type of wave may occur in the channel downstream from a slice gate at which the opening is rapidly increased. See figure 3-18
|
Fig 3-18 Downstream Positive Surges
Reducing the flow to steady-state. From continuity equation:
Momentum:
|
Negative Surge Waves
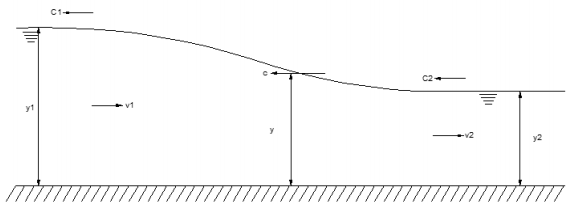
The negative surge wave appears to a stationary observer as a lowering of the liquid surface. Such wave occurs in the channel downstream from the control gate the opening of which is rapidly reduced or in the upstream channel as the gate is opened. The wavefront can be considered to be composed of a series of small waves superimposed on each other. Since the uppermost wave has the greatest depth it travels faster than those beneath; the retreating wavefront, therefore, becomes flatter. As shown in fig 3-19
|
Fig.3-19 Propagation of Negative Surges
The above figure shows a small disturbance in a rectangular channel caused by a reduction in downstream discharge; the wave propagates upstream as described below:
|
Fig 3-20 Neglecting the product of small quantities
The momentum equation is
Equating the above equations;
Where, C=√gy=v (3.27) Substituting for (v +c) from above equations;
And in the limit as ∂y→ 0
For a wave of finite height, integration of the above equation yields V=-√2gy+constant
|
|
Fig 3-21 Negative surges of finite height
From equation c=√gy=v and substituting in the above equation then it becomes;
In the case of a downstream negative surge in a frictionless channel as shown below a similar approach yields;
|
|
Fig 3-22 Downstream negative surges
Key Takeaways:
- The sudden changes of flow in the open channel result in the increase or decrease of flow depth are called the ‘surge’ in an open channel.
- An observer sees an increase in depth as the wavefront of a positive surge wave passes. A negative surge wave, on the other hand, leaves a shallower depth as the wavefront passes.
- The positive upstream jump equation is given by
|
4. The positive downstream jump equation is given by
|
5. The negative upstream wave speed at the crest is
|
6. The negative downstream wave speed at the crest and trough are
|
(PART B)
The flow rate in a channel may vary along the length of the channel. This type of flow is known as spatially varied open channel flow. That is, the flow rate varies in space. In general, all open channel flow occurring during a runoff event is spatially varied. The best example of spatially varied flow in highway drainage design applications is the flow in a street gutter. Here the flow rate varies from zero at the high point of the pavement, to a maximum at the first down-stream inlet. The spatial variations of open channel flow are considered in the design of some highway drainage facilities.
Spatially-varied flow equations
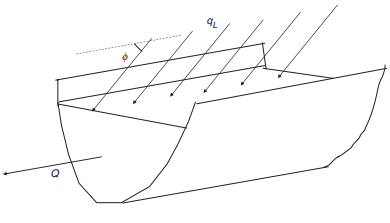
Flow in an open channel is said to be spatially varied if there is lateral flow into (or out of) the channel, as shown schematically in Figure 3-23. For steady spatially-varied flow, the continuity equation becomes
dQ/dx= qL
|
Figure 3-23 Definition sketch for spatially-varied flow
where qL= lateral inflow rate per unit length of the channel. Note that the dimension of qL is {length}2 /{time}.
As demonstrated by Yen and Wenzel (1970), for β=1, the momentum equation for steady spatially-varied flow can be written as
|
where UL = velocity of lateral flow and ø is the angle between the lateral flow and channel flow directions. If lateral flow joins (or leaves) the channel in a direction perpendicular to the main flow direction, the equation becomes
|
Yen and Wenzel (1970) also demonstrated that, for α=1, the energy equation can be written as
|
where h= zb+y = piezometric head of the main channel flow, and hLAT = piezometric head of the lateral inflow. If h = hLAT, and V = UL, Equation 3.32 is simplified to obtain
|
Note that the third term in the numerator of the right side of Equation 1.59 is different from that of Equation 3.31 by a factor of 2.0. This discrepancy is due to the different assumptions involved in the two equations.
The momentum and the energy equations are obtained by using different laws of physics. Also, the friction slope, Sf, and the energy slope, Se, appearing in these equations are fundamentally different. However, it is not practical to evaluate either Sf or Se based on their strict definitions. In practice, we employ the same empirical equations to evaluate Sf and Se. Therefore, Se in the energy equation is often replaced by Sf. If we also assume that α=1 and β=1, then, for gradually-varied flow, the momentum, and energy equation become identical.
For spatially-varied flow, however, the momentum and the energy equations are different even if we assume Se = Sf and α=β=1.0. We can use the momentum equation, Equation 3.30, only if we know the direction of the lateral flow. If the lateral inflow joins a channel at an angle close to 90°, as in most natural and manmade systems, the use of Equation 3.31 is appropriate. The direction of the lateral flow is irrelevant in the energy equation since energy is a scalar quantity. However, where lateral flow joins the main channel, some energy loss occurs due to the local mixing. This loss is not accounted for in Equation 3.33, so Equation 3.33 should not be used for lateral inflow situations. In cases involving lateral outflow, on the other hand, the assumptions of Equation 3.33 are satisfied for the most part, and the use of Equation 3.33 is allowed.
Key Takeaways:
- The flow rate in a channel may vary along the length of the channel. This type of flow is known as spatially varied open channel flow. The best example of spatially varied flow in highway drainage design applications is the flow in a street gutter. Here the flow rate varies from zero at the high point of the pavement, to a maximum at the first down-stream inlet.
- For steady spatially-varied flow, the continuity equation becomes dQ/dx= qL.
References:
1. Fluid Mechanics – Streeter-McGraw-Hill International Book Co., Auckland.
2. Flow in open channel – V. T. Chaw - McGraw-Hill International Book Co., Auckland.
3. Fluid Mechanics – K. L. Kumar – Eurasia Publication House, Delhi.


