UNIT-4
NOTCHES AND WEIRS
Notches
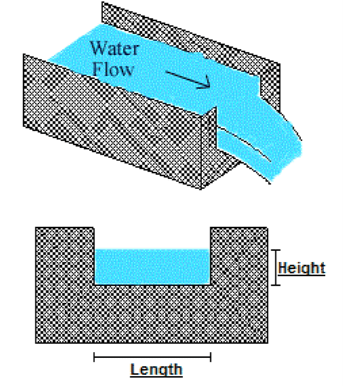
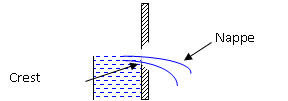
Notches can be of different shapes such as triangular, rectangular, trapezoidal, stepped notch, etc. The bottom of the notch over which the water flows is known as crest or sill and the thin sheet of water flowing through the notch is known as nappe or vein. The edges of the notch are beveled on the downstream side to have a sharp-edged side and crest resulting in minimum contact with the flowing fluid.
|
Fig. 4-1
A weir is a small barrier built across a stream or river to raise the water level slightly on the upstream side; essentially a small-scale dam. Weirs allow water to pool behind them while allowing water to flow steadily over top of the weir. Additionally, the term weir can be used to refer to the crest of a spillway on a large embankment dam.
Weirs can be constructed out of several different materials, depending on their age and purpose. Wood, concrete, or a mixture of rocks, gravel, and boulders can all be used to construct a weir.
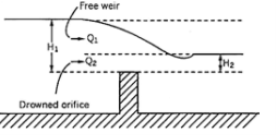
In a weir, the surface over which the water flows is known as the crest. The flow of water that moves over the top of this crest is known as the nappe, which is simply the water that makes it overtop the weir. This nappe does not exist with dams, as dams permit no flow of water over the structure. If this nappe falls a significant distance through the air - meaning that the weir increases the elevation of the water before the weir - the weir is said to have free discharge. However, if water flows partially underwater as a result of little elevation increase from the weir it is said to be submerged or drowned.
|
Fig. 4-2
Notches
It takes its name from the shape of its notch. The discharge through a weir or notch is directly related to the water depth or head (H). This head is affected by the condition of the crest, the contraction, the velocity of the approaching stream, and the elevation of the water surface downstream from the weir.
|
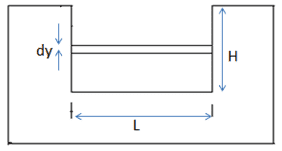
Fig. 4-3 Rectangular notch
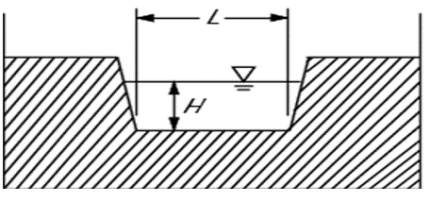
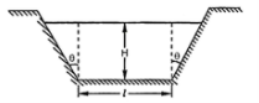
2. Trapezoidal or Cipolletti notch:
The Cipolletti notch is trapezoidal. The slope of the sides, inclined outwardly from the crest and should be one horizontal to four vertical.
|
Fi.4-4 Trapezoidal notch
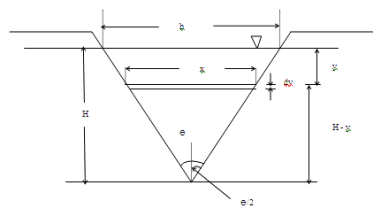
V-Notch
In this case, the notch is "V" in shape. The depth of water above the bottom of the V is called head (H). The V-notch design causes small changes in discharge hence causing a large change in depth and thus allowing more accurate measurement than with a rectangular notch.
|
Fig. 4-5 V notch
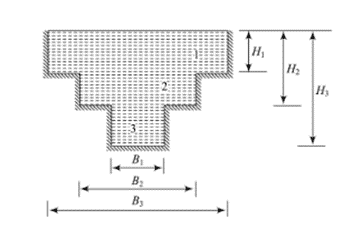
Stepped notch:
A stepped notch is a combination of rectangular notches as shown in figure 4-6. It is thus obvious that the discharge over such a notch will be the sum of the discharges over the different rectangular notches.
|
Fig. 4-6 Stepped notch
1. Proportional Weir:
This is a weir whose shape is so designed that the discharge over the weir is proportional to the head of water over the crest. The crest of the weir is horizontal.
|
Fig. 4-7 Proportional weir
2. The Cippoletti Weir:
A weir that is so compensated to make up for the loss of discharging capacity due to end contractions is called a Cippoletti weir.
|
Fig. 4-8 Cippoletti weir
3. Submerged Weir:
Fig. 4-9 shows a submerged weir. In this case, the water level on the downstream side also is above the crest of the weir.
|
Fig. 4-9 Submerged weir
4. Anicut or Raised Weir or Barrage:
An anicut is a masonry dam provided across a river to raise the water level on the upstream side to a sufficient extent in the dry season so that the water can be carried by gravitation to places where it otherwise could not reach.
5. Broad Crested Weir:
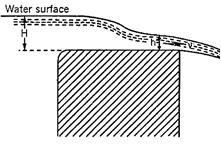
This is a weir having a very broad sill so that the flow of water over the sill may be compared to the flow of water in a channel. Consider the broad crested weir shown in Fig. 4-10.
|
Fig. 4-10 Broad crested weir
6. Ogee Weir:
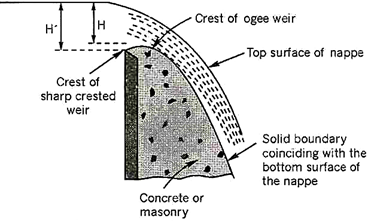
We know, in the case of a sharp-crested weir the nappe as it leaves the crest springs or rises slightly at the lower surface. In this way, it reaches a maximum rise of 0.115 H’ above the crest and then falls. (H’ is the head over the sharp crest). Suppose the space below the bottom surface of the nappe is filled with masonry or concrete.
The consequent weir formed is shown in Fig. 4-11. Such a weir is called an ogee weir. Thus in an ogee weir, the solid boundary of the weir exactly coincides with the bottom surface of the nappe of the sharp-crested weir under the designed head.
|
Fig.4-11 Ogee weir
7. Separating Weir:
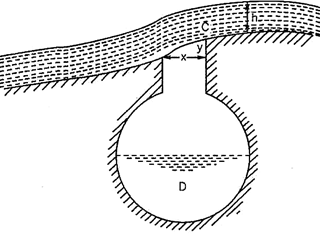
A separating weir is an arrangement provided in the case of town water supply, where it may become necessary to divert the discolored floodwater from the supply channel. When the discharge is moderate, the water drops over the lip C into a culvert D which communicates with the supply channel.
But during floods, the velocity of flow will be greater due to greater depth and this causes the water to leap across the opening into the waste channel.
|
Fig. 4-12 Separating weir
Key Takeaways:
- A Notch is a device used for measuring the rate of flow of a liquid through a small channel or a tank. It may be defined as an opening in the side of a tank or vessel such as liquid surface in the tank is below the level of opening. Notches can be of different shapes such as triangular, rectangular, trapezoidal, stepped notch, etc.
- A weir is a small barrier built across a stream or river to raise the water level slightly on the upstream side; essentially a small-scale dam. Weirs allow water to pool behind them while allowing water to flow steadily over top of the weir. Various types of weirs are Proportional, Cippoleti, submerged, ogee, broad crested, etc.
|
Fig. 4-13
H = Height of water above the sill of a notch b = Width or length of the notch Cd = Coefficient of discharge
The theoretical velocity of water through the strip
Discharge through the strip,
The total discharge over the whole notch may be found out by integrating the above equation within the limits 0 and H.
|
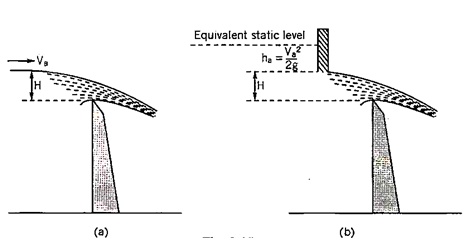
Let va be the velocity of approach. This condition is equivalent to a condition in which the free water surface is static at a higher level, at a height ha = va2/2g. The head ha is called the head due to the velocity of approach. If the head of the actual flowing water level over the crest is H, the weir opening may be taken as equivalent to a large orifice in which the heads of still water above the top and bottom edges are respectively, ha and H + ha.
|
Fig. 4-14
Accordingly, the discharge is given by,
|
The quantity H + ha is called still water head.
The corresponding head due to the velocity of the approach is calculated. Now a more accurate value of the discharge is calculated from the above equation. This process may be repeated to get a more accurate value of the discharge.
For a rectangular notch of length l, the discharge over the notch is given by,
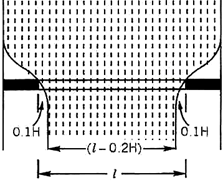
When the length of the weir is less than the width of the stream, we find there will be a lateral contraction at each end such a weir is called a contracted weir. According to Francis, each lateral contraction (also called end contraction) is equal to 0.1 H.
|
|
Fig. 4-15
If the actual length of the weir is l, then the effective length of the weir will be (I – 0.2 H). In some cases, there may be intermediate obstacles like piers over the weir. In such a case if l is the length of the weir after making deductions for the widths of the obstacles and if there are n lateral contractions the effective length of the weir will be (l – 0.1 nH).
Hence the discharge over the weir will be –
The above formula is called the Francis formula. If the velocity of approach is also considered, then q = 1.84 [l – 0.1 n (H + ha)] [(H + ha)3/2 – ha 3/2] (4.5) If the length of the weir is exactly equal to the width of the approaching stream, there will not be any end contractions. Such a weir is called a suppressed weir, and for such a weir Francis's formula simplifies to q = 1.84 I H3/2.
|
Key Takeaways:
The discharge equation is given by:
Consider a weir provided across a river. The water which is approaching the weir possesses a certain velocity known as the velocity of approach.
|
Calibration of the Rectangular, Triangular, and Trapezoidal Notches.
|
Fig. 4-16
Procedure
The pump sucks the water from the sump tank and discharges it to a small flow channel. The notch is fitted at the end of the channel. All the notches and weirs are interchangeable. The water flowing over the notch falls in the collector. Water coming from the collector is directed to the measuring tank for the measurement of flow. The following notches can be considered:
1. Rectangular notch (Crest length L = 0.050m)
2. Triangular notch (Notch Angle – 60° )
3. Trapezoidal notch (Crest length L = 0.075m; Slope = 4V:1H)
The following procedure is followed for calibration:
1. Fit the required notch in the flow channel.
2. Fill up the water in the sump tank.
3. Open the water supply gate valve to the channel and fill up the water in the channel up to the sill level.
4. Take down the initial reading of the crest level (sill level)
5. Now start the pump and open the gate valve slowly so that water starts flowing over the notch
6. Let the water level become stable and note down the height of the water surface at the upstream side by the sliding depth gauge.
7. Close the drain valve of the measuring tank, and measure the discharge.
8. Take the reading for different flow rates.
9. Repeat the same procedure for other notches also.
Calculations:
Rectangular Notch
1. Head over the notch, H = (h − s) in meter
2. Actual Discharge , Qact = L /t in m3 /sec
3. Crest length of notch = 0.05 m
4. Theoretical discharge, Qth = 2 /3 L. √2g H 3/2 in m3 /sec
5. Coefficient of discharge Cd = Qact/ Qth
Triangular notch
1. Head over the notch, H = (h − s) in meter
2. Actual Discharge, 𝑄𝑎𝑐𝑡 = 0.01/𝑡 𝑖𝑛 𝑚3 /𝑠𝑒𝑐
3. Crest length of notch = 0.075 m
4. Theoretical discharge, Qth = 8/15 √2g tan 60/2 H 5/2 in m3 /sec
5. Coefficient of discharge Cd = Qact /Qth
Trapezoidal Notch
1. Head over the notch, H = (h − s) in meter
2. Actual Discharge, 𝑄𝑎𝑐𝑡 = 0.01/𝑡 𝑖𝑛 𝑚3 /𝑠𝑒𝑐
3. Crest length of notch = 0.070 m
4. Theoretical discharge, Qth = 1.84. L.H 3/2 in m3 /sec
5. Coefficient of discharge Cd = Qact/Qth
The usefulness of the flow rate measurement is greatly enhanced if a statement of possible error accompanies the result. The error may be defined as the difference between the true flow rate and the flow rate which is calculated from the measured water level (upstream head) with the aid of the appropriate head-discharge equations.
It is not relevant to give an absolute upper bound to the value of error. Due to chance, such bounds can be exceeded. Taking this into account, it is better to give a range that is expected to cover the true value of the measured quantity with a high degree of probability. This range is termed the uncertainty of measurement, and the confidence level associated with it indicates the probability that the range quoted will include the true value of the quantity being measured
Nature of errors
Three types of error must be considered:
a. Spurious errors (human mistakes and instrument malfunctions);
b. Random errors (experimental and reading errors);
c. Systematic errors (which may be either constant or variable).
Spurious errors are errors that invalidate a measurement. Such errors cannot be incorporated into a statistical analysis with the object of estimating the overall accuracy of a measurement and the measurement must be discarded. Steps should be taken to avoid such errors or to recognize them and discard the results. Alternatively, corrections may be applied.
Random errors are errors that affect the reproducibility of the measurement. It is assumed that data points deviate from the mean by the laws of chance as a result of random errors. The mean random error of a summarized discharge over a period is expected to decrease when the number of discharge measurements during the period increases. As a result, the integrated flow over a long period of observation will have a mean random error that approaches zero. It is emphasized that this refers to time-dependent errors only and that the length of time over which observations should be made has to be several times the period of fluctuations of flow.
Systematic errors are errors that cannot be reduced by increasing the number of measurements so long as equipment and conditions remain unchanged. Whenever there is evidence of a systematic error of a known sign, the mean error should be added to (or subtracted from) the measurement results. A residual systematic error should be assessed as half the range of possible variation that is due to this systematic error.
A strict separation of random and systematic errors has to be made because of their different sources and the different influence ‘they have on the total error. This influence will depend on whether the error in a single measurement is concerned, or that in the sum of a series of measurements.
Sources of errors
For discharge measurement structures, the sources of error may be identified by considering a generalized form of the head-discharge equation:
Q = wCdCvf√gb.h,” (4.6)
where w and u are numerical constants that are not subject to error. The acceleration due to gravity, g, varies from place to place, but the variation is small enough to be neglected in flow measurement. So the following errors remain to be considered:
∂C = error in product CdCv
∂f = error in drowned flow _reduction factor f
∂b = error in dimensional measurement of the weir; e.g. the width of the weir b,
∂h = error in h, and/or ∆h or the weir notch angle theta
These errors are considered to be constant and systematic. This classification is not entirely correct because Cd and Cv are functions of h1. However, the variations of the errors in Cd and Cv as a function of h1 usually are sufficiently small to be neglected.
When the flow is modular, the drowned flow reduction factor f is constant (f = 1.0) and is not subject to error. As a result, for modular flow ∂f = 0. When the flow is nonmodular the error ∂f consists of a systematic error, ∂fn is the error in the numerical value off, and of systematic and random errors caused by the fact that f is a function of the submergence ratio Sh = H2/HI ≈h2/h1.
The error ∂b depends on the accuracy with which the structure as constructed can be measured, and is also a systematic error. In practice, this error may prove to be insignificant in comparison with other errors.
The error ∂h1 has to be split into a random error ∂hR and a systematic error ∂hS. Those errors may contain many contributory errors. Possible sources of contributory errors are:
1. Internal friction of the recording system;
2. Inertia of the indication mechanism;
3. Instrument errors;
4. Zero settings;
5. Settling or tilting sideways of the structure with time;
6. The crest not being level, or other construction faults not included in ∂b;
7. Improper maintenance of the structure (this also may cause an extra error ∂C);
8. Reading errors.
We have to be careful in recognizing whether an error is random or systematic. Some sources can cause either systematic or random errors, depending on circumstances.
Errors in measurements of head
The head measurement station should be located sufficiently far upstream of the structure to avoid the area of surface drawdown, yet it should be close enough for the energy loss between the head measurement station and structure to be negligible. In practice, however, it very often happens that this station is located incorrectly, resulting in very serious errors in the head.
Insufficient depth of the foundation of the structure or the head measurement device, or both, can cause errors in the zero-setting since ground-frost and changes in soil-moisture may move the structure and device. To limit errors in zero settings it is recommended that the setting be repeated at least twice a year; for example, after a period of frost, after a rainy season, or during summer or a dry season. The reading error of a staff-gauge is strongly influenced by the reading angle and the distance between the gauge and the observer, the turbulence of the water, and the graduation unit of the gauge.
Since reading a gauge in standing water causes a smaller reading error than one read in streaming water, the use of a stilling well must be considered whenever the accuracy of head readings has to be improved.
When a float-operated automatic water level recorder is used great care should be given to the selection of the cable, although it is recommended that a calibrated float tape be used instead. The cable or tape should not stretch and should be made of corrosion-resistant material.
Coefficient errors
The coefficient errors are valid for well-maintained clean structures. To obtain the accuracies listed, sediment, debris, and algal growth must be removed regularly. To keep the structure free of weed, fungicides can be used. The best method is probably to add, say, 0.5 percent by weight of cement copper oxide to facing concrete during mixing. Copper sulfate or another appropriate fungicide can be applied to existing concrete but frequent treatment will be required. Algal growth on non-concrete structural parts can be prevented by regular treatment with an anti-fouling paint such as that used on yachts.
Error in discharge volume over a long period
If during a 'long' period a great number of single discharge measurements (n > 15) are made and these measurements are used in combination with head readings, to calculate the discharge volume over an irrigation season or hydrological year, the percentage random error Xvol. R tends to zero and can be neglected. The systematic error Xvol.S of a volume of water measured at a particular station is a function of the systematic percentage error of the discharge (head) at which the volume was measured. Since the systematic percentage error of a single measurement decreases if the head increases, a volume measured over a long period of low discharges will be less accurate than the same volume measured over a (shorter) period of higher discharge.
Key Takeaways:
- Three major types of errors are considered while taking mesurement
a. Spurious errors (human mistakes and instrument malfunctions);
b. Random errors (experimental and reading errors);
c. Systematic errors (which may be either constant or variable).
2. Other types of errors include coefficient error, error in measurement of the head, error in discharge volume, etc.
WEIRS
Sharp crested weirs (or notches) are generally used to measure the discharge in small open channels where accuracy is required. Because such weirs can be accurate to ±2% or even ±l %, they are often used as measuring devices in hydraulics laboratories, but they also have practical applications. For instance, the seepage through a dam may be measured by channeling it over a sharp-crested weir. Because the weirs have thin, sharp crests they are not suitable for measuring the discharge in large rivers where they would be prone to damage by the impact of floating debris. Concrete structures like the broad crested weir are used for this, and they operate on a different principle from those described here. The two types of the weir should not be confused.
A sharp-crested weir is usually formed from a sheet of metal that will not rust. A notch is then cut out of the plate, the shape of which defines the geometry of the weir
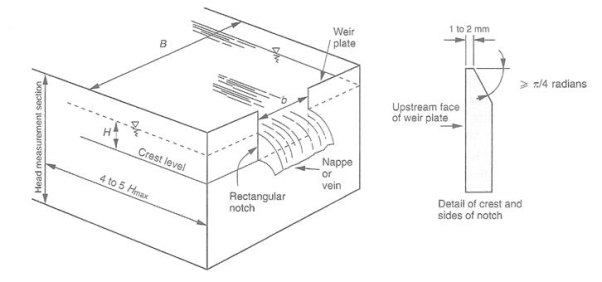
Common shapes for sharp-crested weirs (see diagram 4-17) are rectangular, triangular and another shape is trapezoidal (Cipolletti Weir). The weir must have an accurately finished square upstream edge, a crest width of less than 2mm with a bevel on the downstream side, (see diagram 4-18). With prolonged use, the crest may become worn and rounded, and this can adversely affect the accuracy.
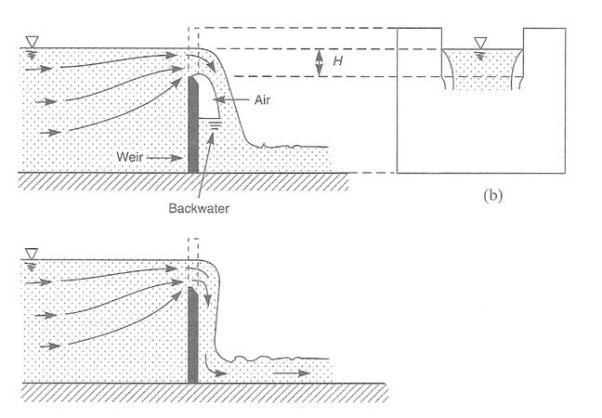
The weir plate must be installed with the upstream face vertical. Normally the length of the weir crest is less than the width of the channel (b < B) so, in a plan, the flow has to contract to pass through it. Similarly, the crest is usually set above the bottom of the channel, so the streamlines have to rise upwards to pass over the weir. The crest, or sill, of the weir, has to be high enough for the water to fall freely into the downstream channel so that the flow over the weir is not affected by the downstream water level. The water flowing over the crest, that is the nappe, should spring clear of the downstream face of the weir plate. This is the 'free' condition in which both the upper and lower surfaces of the nappe are exposed to the atmosphere. This enables a convenient assumption to be made, that is the pressure distribution throughout the nappe is close to atmospheric.
If the kind of weir plate in the diagram below is used, then the free condition should exist naturally at all but the smallest of discharges. However, if the weir crest spans the full width of the channel so that b = B, this is called the suppressed condition. This maximizes the discharge over the weir for a particular channel width, which may be desirable in some circumstances, but means that the air under the nappe is now trapped. Gradually the air becomes entrained in the nappe and is carried away. This leaves air at low pressure under the nappe, which enables the backwater to rise. When most or all of the air has been removed, the nappe collapses and adheres to the face of the weir plate, forming a clinging nappe (as in diagram 4-19).
This is undesirable because the weir will not function as an accurate measuring device like this. To prevent the formation of a clinging nappe with the suppressed condition, it is necessary to provide an air vent or pipe to admit air to the underside of the nappe.
If the discharge in a relatively wide channel is to be measured, then more than one weir plate may be used. In this case, the individual weir plates would be attached to vertical posts.
It may then be desirable to set the weir crests at different heights, forming a compound weir. This is often done to improve accuracy: when the discharge is small all the water passes over only the lowest crest, but as the flow increases the other weirs come into use.
The relationship that is always sought with a weir is between the head, H, over the weir crest and the discharge, Q. Note that H is always the head above the weir crest (not the total depth of water in the channel). Note also that because the weir has a smaller cross-sectional area of flow than the approach channel, the continuity equation Q = AV dictates that the velocity over the weir crest must be higher than the velocity in the approach channel. This increase in velocity means that the velocity head increases so, assuming that the total energy line is horizontal, the water surface falls towards the weir as the flow accelerates.
Consequently, the head over the weir is usually measured some distance upstream where the velocity head is still relatively small. A distance of at least 4 x Hmax is desirable, where Hmax is the maximum head that will occur over the weir. The head is usually measured in a stilling well or tube which is located to one side of the channel and connected to it by a pipe.
Derivation of the discharge equation for a rectangular weir
The equation is derived in the same way as that for a large rectangular orifice, this simply being the situation where the water surface has fallen below the top of the opening. The basis of the method is to apply the energy equation (Bernoulli) to two points on a streamline, point 1 being on the water surface some distance upstream of the weir, and point 2 being in the nappe as it passes over the weir crest at a depth, h, below the water surface. Several assumptions should be listed in connection with the derivation since they are of significance later on. They are:
(i) That the water discharges over the weir from the surface of a large reservoir, so it can be assumed that the velocity of approach is negligible and the pressure is atmospheric. In other words, V1 = 0 and P1 = 0.
(ii) That the nappe is at atmospheric pressure. Thus if the atmospheric pressure is used as a datum, P2 = 0.
(iii) There are no energy losses.
(iv) The velocity in the nappe varies with depth, h, that is V = (2gh)1/2 but there is no variation in velocity across the
length, b, of the weir crest.
(v) The nappe is as wide as the weir crest, that is it also has a length, b.
(vi) The streamlines are horizontal as they pass over the weir crest.
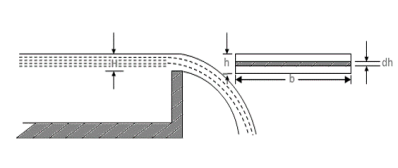
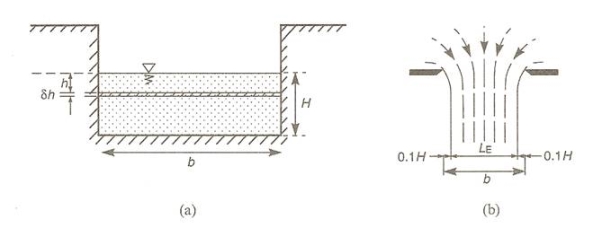
If a thin horizontal strip of length, b, and thickness, δh, is taken across the nappe at a depth, h, see diagram below, then:
Area of the strip, δA = bδh
The velocity of flow through the strip = (2gh)1/2
Discharge through the strip, δQ = area x velocity
= b(2gh)1/2δh
|
Fig. 4-17
To determine the total theoretical discharge, QT, the above expression must be integrated to obtain the sum of all the horizontal strips covering the entire depth of the nappe as defined by the limits h = 0 and h = H. Note that b and g are both constants. QT = b(2g)1/2 The 2/3 arises from the integration. To obtain the actual discharge QA, a coefficient of discharge, CD, is introduced so that:
A typical value for CD is between 0.60 and 0.62. However, the value of the coefficient of discharge is found to vary slightly with discharge. This is because the nappe contracts when seen in the plan, resulting in the effective length (LE) of the weir changing with discharge. Therefore CD is not constant. For an accurate measurement of the discharge, LE should be used in the above equation instead of b. Francis discovered by experiment, that for a rectangular weir, the side contractions average 0.1H for every side that is affected, where H is the head over the weir crest. Therefore the effective length of the weir becomes: LE = (b – 0.1nH) (4.9) Where n is the number of side contractions. There will be more than 2 if using a compound weir made up of several rectangular notches. For a standard weir, n = 2, and for a suppressed weir, n = 0. The suppressed weir has a crest length equal to the width of the channel.
|
|
Fig.4-18
|
Fig. 4-19
|
Fig. 4-20
|
|
|
Fig. 4-21
Only rectangular broad crested weirs will be considered, although there are a variety of possible shapes: triangular, trapezoidal, and round crested all being quite common. If a standard shape is used when there is a large body of literature available relating to their design, operation, calibration, and coefficient of discharge. However, if a unique design is adopted, then it will have to be calibrated either in the field by river gauging or using a scaled-down model in the laboratory.
Head-discharge relationship
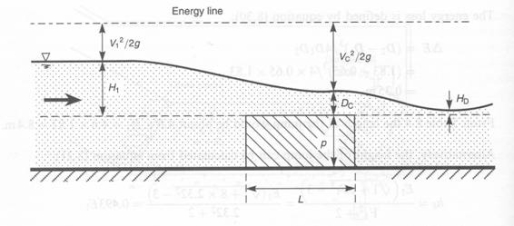
A rectangular broad crested weir is shown above. When the length, L, of the crest is greater than about three times the upstream head, the weir is broad enough for the flow to pass through critical depth somewhere near its downstream edge. Consequently, this makes the calculation of the discharge relatively straightforward. Applying the continuity equation to the section on the weir crest where the flow is at critical depth gives: Q = Ac Vc. Now assuming that the breadth of the weir (b) spans the full width (B) of the channel and that the cross-sectional area of flow is rectangular, then: Ac = b x Dc and Vc = (g x Dc)1/2 Thus from the continuity equation, However, equation 1 does not provide a very practical means of calculating Q. It is much easier to use a stilling well located in a gauging hut just upstream of the weir to measure the head of water, H1, above the crest than to attempt to measure the critical depth on the crest itself. To eliminate Dc from the equation, we can use the fact that in a rectangular channel So, Thus, If you substitute this expression into Eqn 1, it gives: The term |
The broad crested weir will cease to operate according to the above equations if a backwater from further downstream causes the weir to submerge. Equations 2 and 3 can be applied until the head of water above the crest on the downstream side of the weir, HD exceeds the critical depth on the crest. This is often expressed as the submergence ratio, HD/H1. The weir will operate satisfactorily up to a submergence ratio of about 0.66, that is when HD = 0.66H1. For sharp-crested weirs, the head-discharge relationship becomes inaccurate at a submergence ratio of around 0.22, so the broad crested type has a wider operating range. Once the weir has submerged, the downstream water level must also be measured and the discharge calculated using a combination of weir and orifice equations. However, this requires the evaluation of two coefficients of discharge, which means that the weir must be calibrated by river gauging during high flows. This can be accomplished using a propeller-type velocity (current) meter.
Minimum height of a broad crested weir
A common mistake made by many students in design classes is to calculate the head that will occur over a weir at a particular discharge without considering at all the height of the weir required to obtain critical depth on the crest. For example, suppose the depth of flow approaching the weir is 2 m. If the height, p, of the weir crest above the bottom of the channel is only 50 mm, the weir is so low that the flow would be unaffected by it and certainly would not be induced to pass through critical depth. Equally ridiculously, if the weir is 4 m high it would behave like a small dam and would raise the upstream water level vary considerably and cause a quite serious flooding.
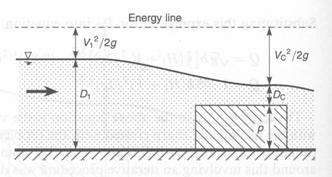
The optimum height for the weir can be obtained by applying the energy equation to two sections (See diagram below). One some distance upstream of the weir and the second on the weir crest where critical depth occurs In this case, the bottom of the channel is used as the datum level. Assuming that the channel is horizontal over this relatively short distance, that both cross-sectional areas of flow are rectangular, and that there is no loss of energy, then:
| ||
|
| |
Fig. 4-22
where
|
This is usually sufficient to enable equation 4.13 to be solved for p when Q and D1 are known. Alternatively, the depth, D1, upstream of the weir can be calculated if Q and p are known. When calculating the 'ideal' height of the weir, it must be appreciated that it is only ideal for the design discharge. The weir cannot adjust its height to suit the flow, so at low flows, it may be too high, and at high flows, it may be too low. Consequently 'V' shaped concrete weirs are often used or compound crump weirs that have crests set at different levels.
Ramamurthy et al. found that the discharge coefficient of round-nosed broad-crested weirs can be calculated based on the upstream head, due to its relationship with the radius of the upstream crested corner, and that the flow characteristic depends on the ratios of H/L and R/P, where H is the upstream head, R is the radius of the upstream top corner, L is the length of the weir, and P is the height of the weir. When R/P is between 0.000 and 0.094, the presence of a rounded upstream corner does not affect the natural outflow over the weir. As R/P increases from 0.094 to 0.250, the discharge coefficient increases gradually. Formulation of the discharge coefficient for free flow based on momentum relationships was proposed.
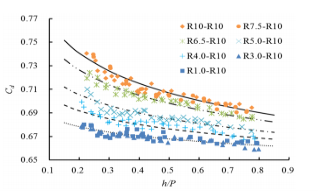
As shown in Figure 4-23, the change rule of the discharge coefficient with the height head was obvious, and the rules for different radii were similar. The formulation for the discharge coefficient was derived from experimental data, which should be a function of the dimensionless parameters listed in the discharge equation given by:
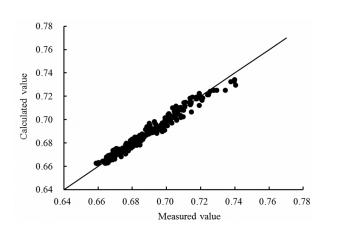
According to experimental data distribution and Equation (4.14), the best fit function of the discharge coefficient was assumed to be of the following form: Cd = k1(h/P)k2 (4.15) where k1 and k2 are parameters that are calculated by r/b. It can be seen from Figure 4.23 that when r/b increases from 0.30 to 0.75, k1 increases, and k2 decreases. b is the half-width of the round weir, and the half-width of the weir near the downstream was not in contact with the flow and did not affect the nappe. The equations for k1 and k2 can be written as follows: k1 = f1(r/b) (4.16) k2 = f2(r/b) (4.17) Based on a multivariate optimization approach, the best-fit parameters can be derived by using five data sets of the present experiment in the range of a round-crested weir, and two calculated expressions can be obtained: k1 = 0.05 r/b + 0.645 (4.18) k2 = −0.075 r/b + 0.0055 (4.19) Incorporating Equations (4.17) and (4.18) into the flow rate equation, the formula for the discharge coefficient can be written as Cd = (0.05 r/b + 0.645) × (h/P) (−0.075 r/b +0.0055) (4.20) where h = 0.05–0.20 m, and r/b = 0.30–0.75. As shown in Figure 4-24, the measured Cd and the calculated Cd matched well. All data points were within ±2% of the total error. The error of the calculated value was within an acceptable range. It is clear from the above discussions that Equation (4.19) derived by empirical fit can be used for calculating the discharge coefficient for a round-crested weir. |
|
Fig. 4-23 Variation of Cd with h/P for the round‐crested weir: five lines are drawn by the power function with different parameters for different radii of rounded upstream
|
Fig. 4-24 Comparison of the measured value to calculated value of Cd for the round-crested weir
1. Rectangular-Notch Weir
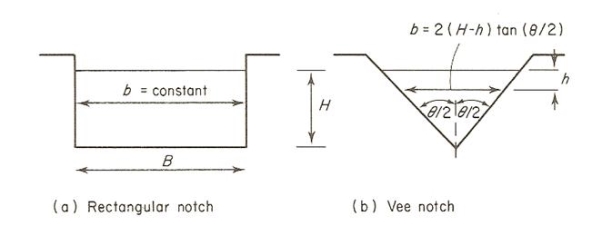
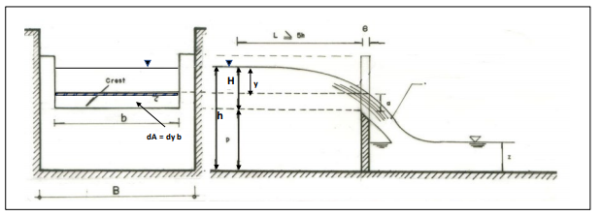
Consider the flow through a rectangular notch or sharp-crested weir as shown in Figure 4-25. A horizontal differential element is taken at a depth y below the free surface. The area of the element is given by,
dA = b dy (4.21)
Fig. 4-25 The velocity through the element is given by, v = √2gy (4-22) Therefore, the theoretical discharge through the element is, 𝑑Q = 𝑏 Integrating Eq. 4-23 yields the theoretical discharge, 𝑄t = 𝑏√2𝑔 0∫H 𝑦1/2dy (4-24) or, 𝑄𝑡 = 2/3 𝑏√2𝑔𝐻3/2 (4-25) The actual discharge is given by, 𝑄𝑎 = 𝐶𝑑 2 /3 𝑏√2𝑔𝐻3/2 (4-26) where Cd = the coefficient of discharge. 2. V-Notch Weir
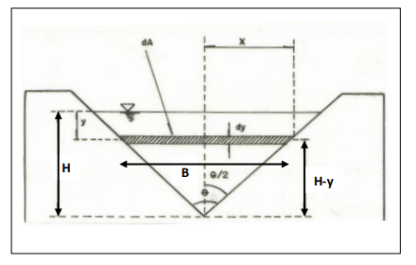
Fig. 4-26 Consider the flow through the triangular notched weir shown in Figure 4-26. Consider an element at depth y. The breadth of the element is given by, B = 2 (H - y) tan θ (4-27) and the area of the differential element is then given by, dA = 2 (H - y) tan θ dy (4-28) while the velocity through the element is given by, v = √2gy (4-29) The discharge through the element is, 𝑑 = 2(𝐻 − 𝑦)√2𝑔y 𝑡an 𝜃 dy (4-30) and the total theoretical discharge is obtained by integrating Eq. 4-30,
which yields, Qt = 8/15 tan θ√2gH5/2 (4.32) The actual discharge is given by, 𝑄𝑎 = 𝐶𝑑 8/15 𝑡an 𝜃 √2𝑔𝐻 5/2 (4-33) in which Cd = the coefficient of discharge, θ = 1/2 of the machined angle = 45° N = 5/2 (triangle), and K = 8/15 √2g tanθ
|
Procedure
• Measure the width of the weir. • Turn on the pump and open the control valve until water discharges over the weir plate. • Close the control valve and turn off the pump and allow the water level to drop until water flow over the weir stops. • Set Vernier height gauge to datum reading (water surface in the channel). • Position the gauge at about halfway between the plate and the stilling baffle. • Turn on the pump, open the control valve and adjust it to obtain the head H. • After the conditions are stable, for each flow rate measure and record H. • Take readings of the volume discharged and time of discharge using the volumetric tank. • Repeat five times for each weir type. Rectangular Weir In a rectangular weir: 𝑄 = 2/3 ∗ 𝐶𝑑 ∗ 𝑏 ∗ √2𝑔 ∗ 𝐻 3/2 Determine discharge coefficient as follows (take measurements for at least 4 different discharges (Q) and 2 to 3 trials to determine each value of Q): 1. Tabulate discharge, head, and discharge coefficient. 2. By plotting a graph of the logarithm of the flow rate vs. the logarithm of the depth, compare the theoretical power law and coefficient with those obtained from the graph. Comment on your results. 3. Plot 𝐶𝑑 vs Q for each measured Q. 4. Fit a function of the form Y=cX3/2 for the data in 2. And from this c and the weir formula above determine Cd. V-notch Weir In a V-notch weir: 𝑄 = 8/15 ∗ 𝐶𝑑 ∗ tan 𝜃/2 ∗ √2𝑔 ∗ ℎ 5/2 Determine discharge coefficient as follows (take measurements for at least 4 different discharges (Q) and 2 to 3 trials to determine each value of Q): 1. Tabulate discharge, head, and discharge coefficient. 2. By plotting a graph of the logarithm of the flow rate vs. the logarithm of the depth, compare the theoretical power law and coefficient with those obtained from the graph. Comment on your results. 3. Plot 𝐶𝑑 vs Q for each measured Q. 4. Fit a function of the form Y=cX5/2 for the data in 2. And from this c and weir formula above determine Cd.
|
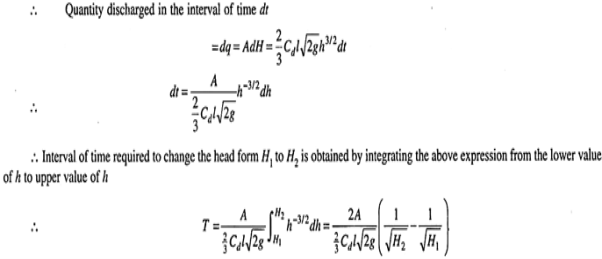
Let a reservoir of plan area A be provided with a rectangular weir of length I. Let it be required to find the time taken for the head of water over the weir to fall from a value H1 to a value H2.
Let at any instant the head of water over the weir be h. Let the fall in water level be dh in a small interval of time dt
|
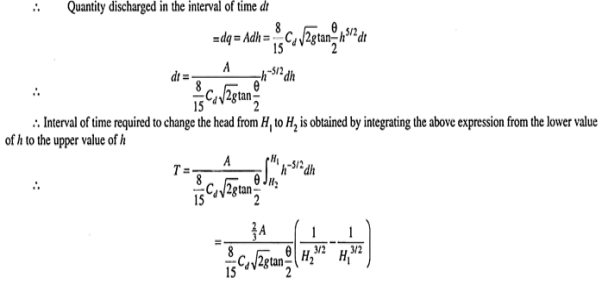
Time of Emptying a Reservoir by a Triangular Notch:
Let a reservoir of plan area A be provided with a triangular notch of angle θ. Let it be required to find the time taken for the head of water over the notch to fall from a value H1 to a value H2. Let at any instant the head of water over the notch be h. Let the fall in water level be dh in a small interval of time dt.
|
Key Takeaways:
2. 2. Broad crested weirs are robust structures that are generally constructed from reinforced concrete and which usually span the full width of the channel. They are used to measure the discharge of rivers and are much more suited for this purpose than the relatively flimsy sharp-crested weirs. The discharge equation is given by
3. 3. The formula for discharge coefficient of round crested weirs is given by Cd = (0.05 r/b + 0.645) × (h/P) (−0.075 r/b +0.0055)
|
References:
1. Fluid Mechanics – Streeter-McGraw-Hill International Book Co., Auckland.
2. Flow in open channel – V. T. Chaw - McGraw-Hill International Book Co., Auckland.
3. Fluid Mechanics – K. L. Kumar – Eurasia Publication House, Delhi.
