Unit -1
Measurement of distances and elevations
BASIC PRINICPLE
Tachometric is a branch of surveying in which horizontal and vertical distances are determined by taking angular observation with an instrument known as a tachometer. Tachometric surveying is adopted in rough in rough and difficult terrain where direct levelling and chaining are either not possible or very tedious. The accuracy attained is such that under favourable conditions error will not exceed 1/100. and if the purpose of a survey does not require accuracy, method is unexcelled. Tachometric survey also can be used for Railways, Roadways, and reservoirs etc.
Methods of Tachometry:
The underlying principle common to different methods of tachometry is that horizontal distance between an instrument station and a point as well as the elevation of point relatively to the instrument can be determined from angle subtended at the instrument station by a known distance at point and vertical angle from instrument to the point.
The various tachometric methods employ principle in different ways and differ one another in methods of observation and reduction, but may be classified under two heads:
(i) The stadia system.
(ii) The tangential system.
In the stadia system, observation is taken with the stadia wires of the tachometer and in the tangential system the angles of elevation are measured from instrument station to the points with a theodolite and their tangents are used to determine horizontal of the telescope for necessary but stadia system needs only one and is more commonly used.
The Stadia System of Tachometry:
In the stadia system of tachometry there are two methods of surveying viz:
(i) Fixed hair method, and
(ii) Moveable hair method.
(i) Fixed Hair Method:
In this method, distance between the stadia hairs is fixed. When a staff is sighted through the telescope, its certain length is intercepted by stadia hair and from tins value of staff intercept, the distance from instrument to the staff can be determined. The staff intercept varies with its distance from instrument. This method is most commonly used in tachometry.
(ii) Moveable Hair Method:
In this methods, stadia hair are not fixed but can be moved by means of micrometre screws. The stall is provided with two vanes or targets fixed at a known distance apart. The variable stadia distance is measured, and from this value required horizontal distance may be found out. The method is now rarely used.
TACHEOMETRIC EQUATION FOR HORIZONTAL LINE OF SIGHT AND INCLINED LINE OF SIGHT IN FIXED HAIR METHOD
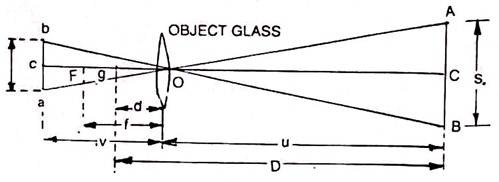
The principle of stadia tachometry is explained as follows: (Fig.
|
Let O= the optical centre of the object – glass
a, b and c= the bottom, top and central hairs at diagram
A, B and C= the points on the staff cut by three lines
a b= i the interval between stadia lines.
(ab is the length of the image of AB)
AB=S=the staff intercept (the differences of the stadia hair readings)
f= the focal length of object – glass i.e., the distance between the centre (O) to the principal focus (FG) of the lens.
u – the horizontal distance from the optical centre (O) to the staff.
v = the horizontal distance from the optical centre (O) to the image of the staff, u and v being called the conjugate focal length of the lens.
d = the horizontal distance form optical centre (O) to the vertical axis of the tachometer.
D = the horizontal distance from the vertical axis of the instrument to the staff,
|
The constant f/i is called the multiple constant and its value is usually 100, while constant (f+d) is called the additive constant and its value varies from 30 cm to 60 cm in case of external focussing telescope, it is very small varying from 10 cm to 20 cm and is therefore often ignored.
To make value of additive constant zero, an additional convex lens, known as anallatic lens, is provided in the telescope between the object – glass and eye piece at a fixed distance from former. By this arrangement, calculation work is reduced considerably.
The equation is applicable only when the line of sight is horizontal and staff is held vertical.
Determination of Stadia Constants of a Tacheometer:
There are two methods available for finding values of the stadia constant f/i and f + d of a given instrument.
First method:
In this method, values of the constants are obtained by the computations form the field measurements.
Procedure:
(i) Measure accurately a line OA about 300 m long, on a fairly level ground and fix pegs along it at intervals of say, 30m.
(ii) Set up the instrument at O and obtained the staff intercepts by taking stadis reading on the staff held vertically at each of pegs.
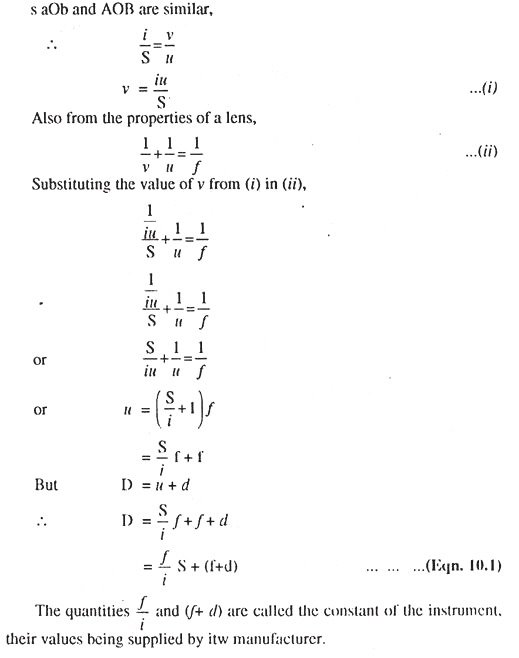
On substituting the values of D and S in the Equations 10.1, we get a number of equations which when solved in pairs, give several values of the constants:
|
their mean value being adopted to the values of constants. Thus, if D1,D2, D3, etc.=the distances measured from instrument, and S1, S2, S3 etc.= the corresponding staff intercepts.
Then we have:
|
Second Method:
In this method, the value of multiplying constant f/i is found by computations from the field measurements and that of additive constant (f+) is obtained by the direct measurements at telescope.
Procedure:
(i) Sight any far distant – object and focus it.
(ii) Measure accurately the distance along the top of telescope between the object -Glass and the plane of cross -hairs (diagram screw) with a rule, the measured distance being equal to focal length (f) of the objective.
(iii) Measure the distance (d) from object— glass to the vertical axis of instrument.
(iv) Measure several lengths D1, D2, D3 etc. along OA from instrument – position O and obtained the staff intercepts S1, S2, S3 ate. at each of these lengths.
(v) Add f and d find values of the additive constant (f+d).
(vi) Knowing (f+d), determined several values of f/i from the equation 10. 1.
(vii) The mean of several values gives the required value of multiple constant f/i. Calculation work is much simplified, of the instrument is placed at a distance of (f+d) beyond the beginning O of the line.
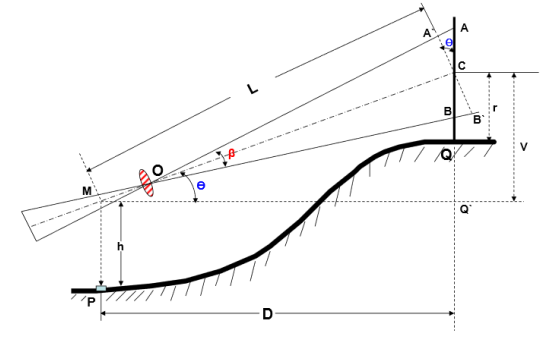
Distance and Elevation formulae for Staff Vertical: Inclined Sight
P = Instrument station;
Q = Staff station
M = position of instruments axis;
O = Optical centre of the objective
A, C, B = Points corresponding to the readings of the three hairs
s = AB = Staff intercept;
i = Stadia interval
Ө= Inclination of the line of sight from the horizontal
L= Length MC measured along the line of sight
D= MQ’ = Horizontal distance between the instrument and the staff
V= Vertical intercept at Q, between the line of sight and the horizontal line
h= height of the instrument;
r = central hair reading
β= angle between the two extreme rays corresponding to stadia hairs.
•Draw a line A’CB’ normal to the line of sight OC.
• Angle AAC = 900+ β/2, being the exterior angle of the ∆COA.
•Similarly, from ∆COB, angle OBC = angle BBC = 90o–β/2.
|
∟AA’C = ∟BB’C = 900
From ∆ACA’, A’C = AC cos Ө or A’B’ = AB cos Ө = s cos Ө..........(a)
Since the line A’B’ is perpendicular to the line of sight OC, equation
D = k s + C is directly applicable.
Hence, we have MC = L = k . A’B’ + C = k s cosӨ + C . . . . . . . (b)
The horizontal distance
D = L cosӨ = (k s cosӨ + C) cosӨ
D = k s cos2Ө + C cosӨ. . . . . . (1)
Similarly, V = L sin Ө = (k s cosӨ + C) sinӨ = k s cosӨ . sinӨ + C sinӨ
V = k s + C sinӨsin2Ө 2 . . . . . . (2)
Thus above 2 equations are the distance and elevation formulae for inclined line of sight.
a) Elevation of the staff station for angle of elevation
If the line of sight has an angle of elevation Ө, as shown in the figure,
Elevation of staff station = Elevation of instrument station + h + V – r.
(b) Elevation of the staff station for the angle of depression:
Elevation of Q = Elevation of P + h – V – r
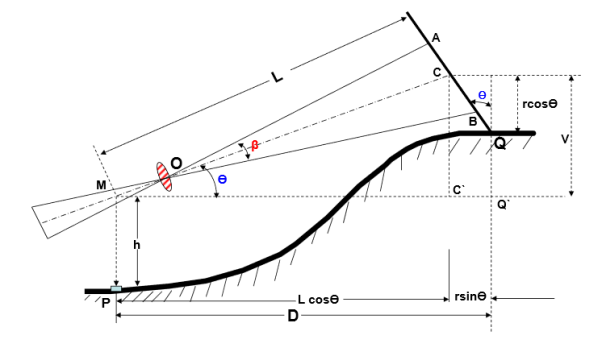
Distance and Elevation formulae for Staff Normal : Inclined Sight
|
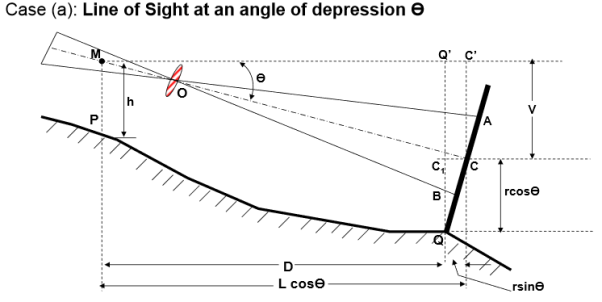
Case (a): Line of Sight at an angle of elevation Ө
Where AB = s = staff intercept;
CQ = r = axial hair reading With the same notations as in the last case,
MC = L = K s + C
The horizontal distance between P and Q is given by
D = MC’ + C’Q’ = L cosӨ + r sinӨ
= (k s + C) cosӨ + r sinӨ. . . . . (3)
Similarly, V = L sinӨ = (k s + C) sinӨ. . . . . (4)
Case (b): Line of Sight at an angle of depression
,MC = L = k s + C
D = MQ’ = MC’ –Q’C’
= L cosӨ - r sinӨ
D = (k s + C) cosӨ - r sinӨ. . . . . (5)
V = L sinӨ = (k s + C) sinӨ. . . . . (6)
Elevation of Q = Elevation of P + h – V – r cosӨ
|
An additional convex lens, called an anallatic lens, is provided in external focussing telescope between the eye — piece and object — glass at a fixed distance from the later, to eliminate the additive constant, (f+d), from the distance formula:
in order to simplify the calculation work. The anallatic lens is seldom placed in internal focussing telescope since the value of additive constant is only a few centimetres and can be neglected. The disadvantage of the anallatic a lens is reduction in brilliancy of the image due to increase observation of light.
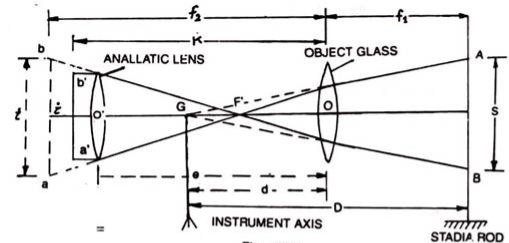
The value of the additive constant, (δ+d) can be made equal to zero by bringing the apex (G) of tachometric angle AGB (Fig. 10. 4) into exact coincidence with the centre on\f the instrument.
The theory of anallatic lens is explained ad follows:
In fig. GIVEN BELOW
|
Let, S = the staff intercept AB.
i = the length b a of the image of AB i.e. the actual stadia interval when anallatic lens is interposed.
i = the length ba of the image of AB when no anallatic lens was provided.
O = the optical centre of the object – glass.
O = the optical centre of the anallatic lens
e = the distance between the optical centre of the object glass and the anallatic lens.
f = to cel length of object glass.
f’ = focal length of the anallatic lens.
F = Principle focus of the anallatic lens.
G = the centre of the instrument.
d = the distance from the centre of the object — glass top the vertical axis of the instrument.
D – the distance from the vertical axis of the instrument to the staff.
f1and f2 = the conjugate focal length of the object —glass.
k = the distance from the optical centre of the object glass to the actual image b a.
(k— e) and (f2 —e) = the conjugate focal length of the anallatic lens.
The ray of light from A and B are refracted by the object — glass to meet at F. The anallatic lens is so placed that F is its principal focus. Thus ray of light would become parallel to the axis of the telescope after passing through the anallatic lens and give actual image b a of the staff intercept AB.
|
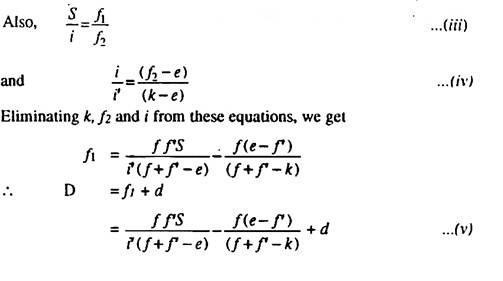
The negative sign is used in (ii) since b ‘a’ and ba are on the same side of the anallatic lengs.
|
now the conditions that D should be proportional to S requires that the 2nd and 3rd terms in (v) are equal to zero so that
|
In this condition, the apex G of the tachometric angle AGB exactly coincides with the instruments
|
In this condition, the apex G of the tachometric angle AGB exactly coincides with the instruments
|
Reduction of Readings:
In practice, horizontal and vertical distances are not calculated by the direct application of formulae, since it is much laborious.
But they are found by following means which are also based on these formulae:
(i) Tachometric tables.
(ii) Stadia diagrams.
(iii) Stadia slide rule.
The calculation work is also much reduced by the use of direct reading tachometers.
(i) Tachometric Tables:
There are various forms of taceometric tables published by different authorities. They provide horizontal and vertical distances for one metre of staff intercept when the multiplying constant of the instrument = 100 and the additive constant = 0.
The modern taceometre which are fitted with the anallatic lens give these values of the constants, horizontal distance for 1m staff intercept;
|
and vertical distances for 1m staff intercept
|
The tables provided these values for different values of varying from 0° to 30°
For example, suppose, the vertical angle is 3° 20^ and the staff intercept is 1.70m. From the tables, it is seen that horizontal and vertical distance for 1 metre staff in percept i.e.
Thus for 1.70m staff intercept, the horizontal distance = 1.70 x 99 .67 – 169.439 m and the vertical distance = 1.70 x 5.80 = 9.86 m.
(ii) Stadia Diagrams:
The stadia diagrams show graphically the quantities
|
The diagram are available in different forms but surveyors often prepare these diagrams of their own design. The use of stadia diagram is consider faster than use of tables but can be used for ordinary distance.
iii) Stadia Slide Rule:
The horizontal and vertical distances are computed conveniently by stadia slide rule. Stadia slide rules are available in different patterns but one in common use is constructed like the ordinary slide rule, except that on slide rule are given values of cos2 and 1/2 sin 2 , these qualities being plotted to a log scale. The stadia slide rule is equally suitable for field or office work.
Levelling by Stadia:
Levelling by stadia tachometry is an indirect and rapid method of levelling. It is suitable where country is rough and precision needed is not great. The transit should preferably be provided with a sensitive control level for vertical vernier so that error may be readily eliminated.
The method of running a line of levels by this method is as follows:
(i) Set up transit at a convenient point.
(ii) Take a back sight on staff held at a B.M., first by observing stadia interval and then by measuring vertical angle to some arbitrarily chosen mark on the staff.
(iii) Establish a change point in advance of transit, and take similar observations, the vertical angle being measured with horizontal cross-hari set on same mark as before.
(iv) Move trait to a new point in advance of change point and repeat the process.
(v) Record stadia distance and vertical angles and also staff reading which is used as an index when vertical angles are measured.
STADIA REDUCTION FORMULAS. —
In stadia work we are concerned with finding two values as follows: (1) horizontal distance from centre of instrument to the stadia rod and (2) vertical distance, or difference in elevation, between the centre of instrument and middle-hair reading on rod. To obtain these values, you must use stadia reduction formulas.
Stadia Formula for Horizontal Sights. — For a horizontal sight, distance that we need to determine is the horizontal distance between centre of the instrument and stadia rod. This distance is found by adding the stadia distance to instrument constant as follows:
Write ks for the stadia distance and (f + c) for instrument constant. Then the formula for computing horizontal distances when sights are horizontal becomes the following:
H=ks +(f+c)
Where:
h = horizontal distance from the centre of the instrument to a vertical stadia rod
k = stadia constant, usually 100
s = stadia interval
f + c = instrument constant (zero for internally focusing telescopes; approximately 1 foot for externally focusing telescopes)
f = focal lengths of the lens
c = distance from the centre of the instrument to the centre of the lens
Tacheometric method is adopted for contouring of very steep hills.
i) Set up the tacheometer at the top of the steep hill. Tacheometer is a theodolite fitted with stadia diaphragm. The stadia diaphragm has three horizontal parallel hairs instead of one as found in a conventional cross hair diaphragm.
ii) With the help of a tacheometer it is possible to determine the horizontal distance of the point from the telescope as well its vertical level.
iii) The steep hill is surveyed at three levels – the base of the hill, the mid-level of the hill and the top level of the hill.
iv) Using the tacheometer reading are taken all around the hill at equal angular intervals on these all 3 levels
v) The radial plot thus obtained is worked in the office to interpolate points of equal elevation for contour mapping.
Contours
Contour is a line joining the points of equal elevation.
Characteristic of Contour
Contours show distinct characteristic features of the terrain as follows:
i) All points on a contour line are of the same elevation.
ii) No two contour lines can meet or cross each other except in the rare case of an overhanging vertical cliff.
iv) Widely spaced contour lines indicate gentle slope
v) Equally spaced contour lines indicate uniform slope
vi) Closed contour lines with higher elevation towards the centre indicate hills
vii) Closed contour lines with reducing levels towards the centre indicate pond or other depression.
viii) Contour lines of ridge show higher eleva tion within the loop of the contours. Contour lines cross ridge at right angles
There are two methods of contour surveying:
- Direct method
- Indirect method
It consists in finding vertical and horizontal controls of the points which lie on the selected contour line. Vertical control levelling instrument is commonly used. A level is set on a commanding position in the area after taking fly levels from the nearby bench mark. The plane of collimation of instrument is found and the required staff reading for a contour line is calculated.
The instrument man asks staff man to move up and down in the area till the required staff reading is found. A surveyor establishes the horizontal control of that point using his instruments.
After that instrument man directs the staff man to another point where the same staff reading can be found. It is followed by establishing horizontal control.
Then several points are established on a contour line on one or two contour lines and suitably noted. After required points are established from the instrument setting, the instrument is shifted to another point to cover more area. The level and survey instrument need not be shifted at the same time. It is better if both are nearby to communicate easily.
For getting speed in levelling sometimes hand level and Abney levels are also used. This method is slow, tedious but got more precision. It is suitable for small areas.
In this the levels are taken at some selected points and their levels are reduced therefore method horizontal control is established first and then the levels of those points found.
After locating the points on the plan, reduced levels are marked and contour lines are interpolated between the selected points.
For selecting points any of the following methods can be used:
- Method of squares
- Method of cross-section
- Radial line method
I. Method of Squares
In this method area is divided into a number of squares and all grid points are marked
Commonly used size of square varies from 5 m × 5 m to 20 m × 20 m. Levels of all grid points are established by levelling. Then grid square is plotted on the drawing sheet. Reduced levels of grid points are marked and contour lines are drawn by interpolation
II. Method of Cross-Section
In this method cross-sectional points are taken at regularly. By levelling the reduced level of all those points are made. The points are marked on the drawing sheets, their reduced levels are marked and contour lines are changed.
The spacing of cross-section relies upon the nature of the ground, scale of the map and the contour interval needed. It varies from 20 m to 100 m. Closer intervals are required if ground level varies.
The cross- sectional line need not be always being at right angles to the main line.
III. Radial Line Method
In this method several radial lines are taken from a point in the area. The direction of each line is written down. On these lines at selected distances points are marked and levels determined. This method is ideally suited for hilly areas.
For interpolating contour points between the two points any one of the following method may be used:
(a) Estimation
(b) Arithmetic calculation
(c) Mechanical or graphical method
Contour maps are extremely useful for various engineering works:
- An engineer studies the contours and finds out the nature of the ground to identify. Suitable site for the project works to be taken up.
- By drawing the section in the plan, it is possible to find out profile of the ground along that line. It helps in finding out depth of cutting and filling, if formation level of road/railway is decided.
- Indivisibility of any two points can be found by drawing profile of the ground along that line.
- The routes of the railway, road, canal or sewer lines can be decided so as to minimize and balance earthworks.
- Catchment area and hence quantity of water flow at any point of nalla or river can be found. This study is very important in locating bunds, dams and also to find out flood levels.
- From the contours, it is possible to determine the capacity of a reservoir.
Reference Books:
1. Principles of Surveying. Vol. I by J. G. Olliver, J. Clendinning - Van Nostrand
Reinhold.
2. Plane Surveying by A. M. Chandra, New Age International Publishers.
3. Surveying Vol. I & II by Dr. K. R. Arora, Standard Book House.
4. Elements of Photogrammetry - Paul R. Wolf, McGraw Hill Publication.
5. Remote sensing and Geographical Information System- A. M. Chandra and S. K.
Ghosh, Narosa Publishing House.
6. Advanced Surveying -Total Station, GIS and Remote Sensing – Satheesh Gopi, R.
Sathikumar and N. Madhu, Pearson publication.
7. The GIS Book, 5Th Edition, George B. Korte, PE onwards press.
