UNIT-2
Real Time specification and design Techniques
- Natural Languages:
- Natural languages are the languages that people speak, such as English, Spanish, and French.
- They were not designed by people (although people try to impose some order on them); they evolved naturally.
2. Formal Languages:
- Formal languages are languages that are designed by people for specific applications.
- For example, the notation that mathematicians use is a formal language that is particularly good at denoting relationships among numbers and symbols.
- Chemists use a formal language to represent the chemical structure of molecules.
3. Programming Languages:
- Programming languages are formal languages that have been designed to express computations.
Key Takeaways
- Natural Languages: Natural languages are the languages that people speak, such as English, Spanish, and French.
- Programming Languages: Programming languages are formal languages that have been designed to express computations.
- A flowchart is a picture of the separate steps of a process in sequential order.
- It is a generic tool that can be adapted for a wide variety of purposes, and can be used to describe various processes, such as a manufacturing process, an administrative or service process, or a project plan.
Flowchart Symbol | Name | Description |
| Process symbol | Also known as an “Action Symbol,” this shape represents a process, action, or function. It’s the most widely-used symbol in flowcharting. |
| Start/End symbol | Also known as the “Terminator Symbol,” this symbol represents the start points, end points, and potential outcomes of a path. Often contains “Start” or “End” within the shape. |
| Document symbol | Represents the input or output of a document, specifically. Examples of and input are receiving a report, email, or order. Examples of an output using a document symbol include generating a presentation, memo, or letter. |
| Decision symbol | indicates a question to be answered — usually yes/no or true/false. The flowchart path may then split off into different branches depending on the answer or consequences thereafter. |
| Connector symbol | Usually used within more complex charts, this symbol connects separate elements across one page. |
| Off-Page Connector/Link symbol | Frequently used within complex charts, this symbol connects separate elements across multiple pages with the page number usually placed on or within the shape for easy reference. |
| Input/Output symbol | Also referred to as the “Data Symbol,” this shape represents data that is available for input or output as well as representing resources used or generated. While the paper tape symbol also represents input/output, it is outdated and no longer in common use for flowchart diagramming. |
| Comment/Note symbol | Placed along with context, this symbol adds needed explanation or comments within the specified range. It may be connected by a dashed line to the relevant section of the flowchart as well. |
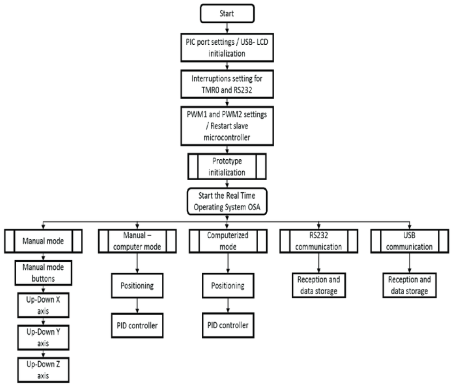
2.2.1 Structured charts
Fig.1 Structured charts |
2.2.2 Structured Charts:
- A structure chart (SC) in software engineering and organizational theory is a chart which shows the breakdown of a system to its lowest manageable levels.
- They are used in structured programming to arrange program modules into a tree.
- Each module is represented by a box, which contains the module's name.
- Structure Chart represent hierarchical structure of modules. It breaks down the entire system into lowest functional modules, describe functions and sub-functions of each module of a system to a greater detail.
- Structure Chart partitions the system into black boxes (functionality of the system is known to the users but inner details are unknown).
- Inputs are given to the black boxes and appropriate outputs are generated.
2.2.3 Modules:
- Modules at top level called modules at low level.
- Components are read from top to bottom and left to right.
- When a module calls another, it views the called module as black box, passing required parameters and receiving results.
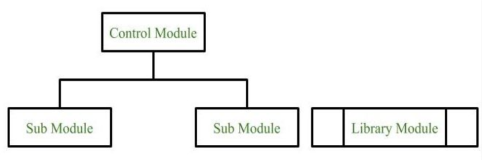
2.2.3 Symbols used in construction of structured chart:
- Module:
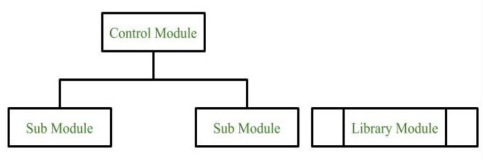
It represents the process or task of the system. It is of three types.
- Control Module:
A control module branches to more than one sub module. - Sub Module:
Sub Module is a module which is the part (Child) of another module. - Library Module:
Library Module are reusable and invokable from any module.
Fig.2 |
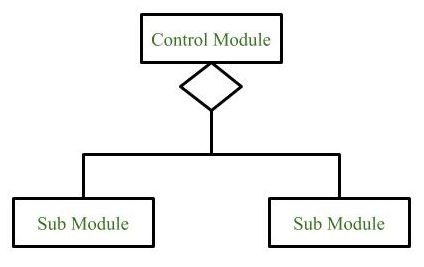
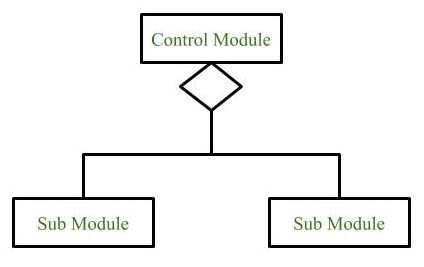
2. Conditional Call:
It represents that control module can select any of the sub module on the basis of some condition.
Fig.3 |
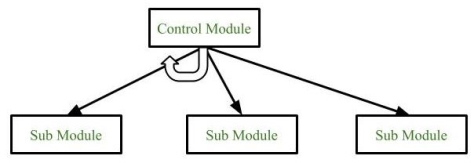
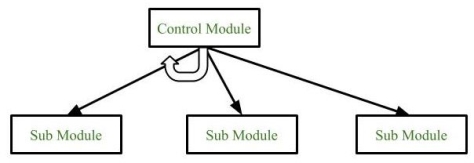
3. Loop (Repetitive call of module):
It represents the repetitive execution of module by the sub module.
A curved arrow represents loop in the module.
Fig.4 |
All the sub modules cover by the loop repeat execution of module.
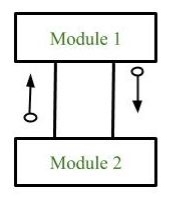
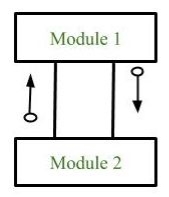
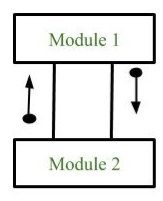
4. Data Flow:
It represents the flow of data between the modules. It is represented by directed arrow with empty circle at the end.
Fig.5 |
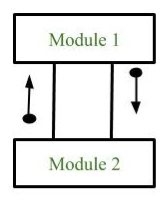
5. Control Flow:
It represents the flow of control between the modules. It is represented by directed arrow with filled circle at the end.
Fig.6 |
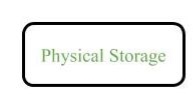
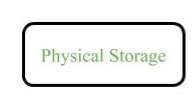
6. Physical Storage:
Physical Storage is that where all the information are to be stored.
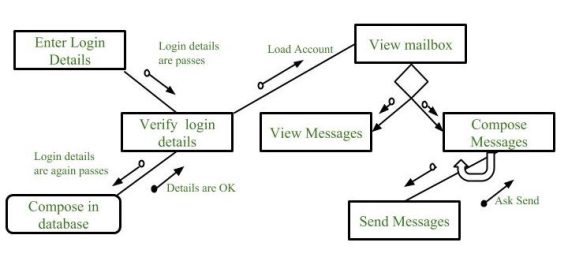
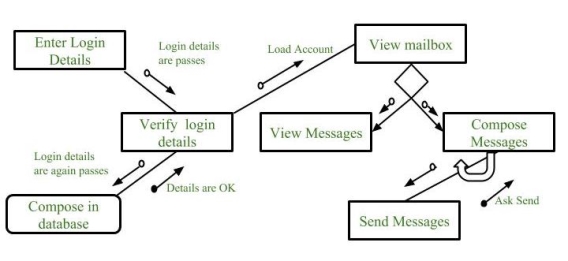
Example: Structure chart for an Email server :
Fig-7 |
2.2.3.1 Types of Structure Chart:
- Transform Cantered Structured:
These type of structure chart are designed for the systems that receives an input which is transformed by a sequence of operations being carried out by one module. - Transaction Cantered Structure:
These structure describes a system that processes a number of different types of transaction.
Key Takeaways:
- A flowchart is a picture of the separate steps of a process in sequential order.
- It is a generic tool that can be adapted for a wide variety of purposes, and can be used to describe various processes, such as a manufacturing process, an administrative or service process, or a project plan.
- Program Design Language (or PDL, for short) is a method for designing and documenting methods and procedures in software.
- It is related to pseudocode, but unlike pseudocode, it is written in plain language without any terms that could suggest the use of any programming language or library.
- Pseudo code: It is a simpler version of a programming code in plain English which uses short phrases to write code for a program before it is implemented in a specific programming language.
- Program: It is exact code written for problem following all the rules of the programming language.
2.3.1 Pseudo code:
- It is one of the methods which can be used to represent an algorithm for a program.
- It does not have a specific syntax like any of the programming languages and thus cannot be executed on a computer.
- There are several formats which are used to write pseudo-codes and most of them take down the structures from languages such as C, Lisp, FORTRAN, etc.
- Many time algorithms are presented using pseudocode since they can be read and understood by programmers who are familiar with different programming languages.
- Pseudo code allows you to include several control structures such as While, If-then-else, Repeat-until, for and case, which is present in many high-level languages.
Note: Pseudo code is not an actual programming language:
- Pseudo code for Linear Search :
FUNCTION linear Search (list, search Term): FOR index FROM 0 -> length (list): IF list [index] == search Term THEN RETURN index ENDIF ENDLOOP RETURN -1 END FUNCTION |
- In here, we haven’t used any specific programming language but wrote the steps of a linear search in a simpler form which can be further modified into a proper program.
2.3.2 Program:
- A program is a set of instructions for the computer to follow.
- The machine can’t read a program directly, because it only understands machine code.
- But you can write stuff in a computer language, and then a compiler or interpreter can make it understandable to the computer.
- Program for Linear Search :
// C++ code for linearly search x in arr[]. If x // is present then return its location, otherwise // return -1 int search(int arr[], int n, int x) { int i; for (i = 0; i < n; i++) if (arr[i] == x) return i; return -1; }
|
2.3.3 Call-by-Value and Call-by-Reference:
- The two most widely found parameter passing methods are call-by-value and call-by-reference.
- In call-by-value parameter passing, the value of the actual parameter in the subroutine or function call is copied into the procedure’s formal parameter.
- Since the procedure manipulates the formal parameter, the actual parameter is not altered. This technique is useful either when a test is being performed or the output is a function of the input parameters.
- For example, in passing accelerometer readings from the 10-ms cycle to the 40-ms cycle, the raw data need not be returned to the calling routine in changed form.
- When parameters are passed using call-by-value they are copied onto a run-time stack, at additional execution time cost.
- In call-by-reference or call-by-address the address of the parameter is passed by the calling routine to the called procedure so that it can be altered there.
- Execution of a procedure using call-by-reference can take longer than one using call-by-value, since in call-by-reference indirect mode instructions are needed for any calculations involving the variables passed.
- However, in the case of passing large data structures such as buffers between procedures it is more desirable to use call-by-reference, since passing a pointer is more efficient than passing the
data by byte.
Key Takeaways:
- Program Design Language (or PDL, for short) is a method for designing and documenting methods and procedures in software.
- The two most widely found parameter passing methods are call-by-value and call-by-reference.
- In call-by-value parameter passing, the value of the actual parameter in the subroutine or function call is copied into the procedure’s formal parameter.
- Pseudo code allows you to include several control structures such as While, If-then-else, Repeat-until, for and case, which is present in many high-level languages.
- Finite Automata (FA) is the simplest machine to recognize patterns.
- The finite automata or finite state machine is abstract machines which have five elements or tuple.
- It has a set of states and rules for moving from one state to another but it depends upon the applied input symbol.
- Basically it is an abstract model of digital computer.
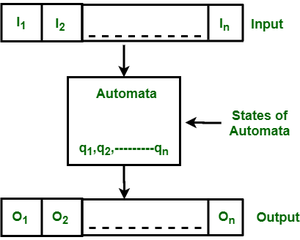
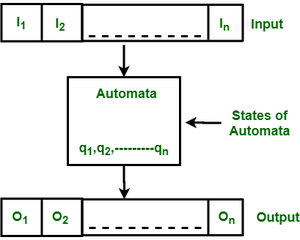
- Following figure shows some essential features of a general automation.
Fig.8: Features of Finite Automata |
The above figure shows following features of automata:
- Input
- Output
- States of automata
- State relation
- Output relation
A Finite Automata consists of the following:
Q: Finite set of states.
Σ: set of Input Symbols.
q: Initial state.
F: set of Final States.
δ: Transition Function.
Formal specification of machine is
{Q, Σ, q, F, δ}.
FA is characterized into two types:
2.4.1 Deterministic Finite Automata (DFA) :
- DFA consists of 5 tuples {Q, Σ, q, F, δ}.
Q : set of all states.
Σ : set of input symbols. (Symbols which machine takes as input)
q : Initial state. (Starting state of a machine)
F : set of final state.
δ : Transition Function, defined as δ : Q X Σ --> Q.
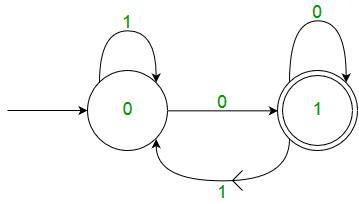
- In a DFA, for a particular input character, the machine goes to one state only. A transition function is defined on every state for every input symbol.
- Also in DFA null (or ε) move is not allowed, i.e., DFA cannot change state without any input character.
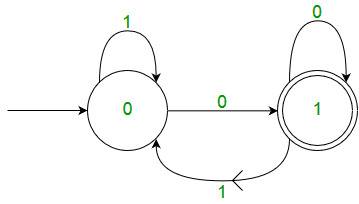
- For example, below DFA with Σ = {0, 1} accepts all strings ending with 0.
Fig.8: DFA with Σ = {0, 1}
|
- One important thing to note is, there can be many possible DFAs for a pattern. A DFA with minimum number of states is generally preferred.
2.4.2 Nondeterministic Finite Automata (NFA) :
- NFA is similar to DFA except following additional features:
1. Null (or ε) move is allowed i.e., it can move forward without reading symbols.
2. Ability to transmit to any number of states for a particular input. - However, these above features don’t add any power to NFA. If we compare both in terms of power, both are equivalent.
- Due to above additional features, NFA has a different transition function, rest is same as DFA.
δ: Transition Function
δ: Q X (Σ U ε ) --> 2 ^ Q.
- As you can see in transition function is for any input including null (or ε), NFA can go to any state number of states.
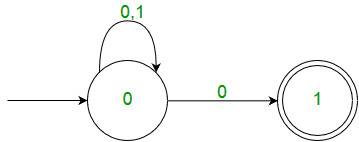
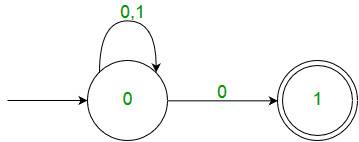
For example, below is a NFA for above problem:
Fig.9 NFA
|
- One important thing to note is, in NFA, if any path for an input string leads to a final state, then the input string accepted. For example, in above NFA, there are multiple paths for input string “00”. Since, one of the paths leads to a final state, “00” is accepted by above NFA.
2.4.3 Comparison of DFA & NFA:
- Both NFA and DFA have same power and each NFA can be translated into a DFA.
- There can be multiple final states in both DFA and NFA.
- NFA is more of a theoretical concept.
- DFA is used in Lexical Analysis in Compiler.
Key Takeaways:
- Finite Automata (FA) is the simplest machine to recognize patterns.
- The finite automata or finite state machine is abstract machines which have five elements or tuple.
- The above figure shows following features of automata:
- Input
- Output
- States of automata
- State relation
- Output relation
- Comparison of DFA & NFA:
- Both NFA and DFA have same power and each NFA can be translated into a DFA.
- There can be multiple final states in both DFA and NFA.
- NFA is more of a theoretical concept.
- DFA is used in Lexical Analysis in Compiler.
A Warnier-Orr diagram (also known as a logical construction of a program/system) is a kind of hierarchical flowchart that allows the description of the organization of data and procedures.
- They were initially developed in France by Jean-Dominique Warnier and in the United States by Kenneth Orr.
- This method aids the design of program structures by identifying the output and processing results.
- The simple graphic method used in Warnier/Orr diagrams makes the levels in the Warnier/Orr diagrams show the processes and sequences in which they are performed.
- Each process is defined in a hierarchical manner i.e. it consists of sets of sub processes that define it. At each level, the process is shown in bracket that groups its components.
- Using Warnier/Orr Diagrams To develop a Warnier/Orr diagram, the analyst works backwards, starting with and using output oriented analysis. On paper, the development moves from right to left.
- First, the intended output or results of the processing are defined.
Each step in turn is further defined. the result on the next level.
- Advantages of Warnier/Orr diagram According to Experts:
They are: Yet they are powerful design tools. that must be passed from level to level. In addition, the sequence of working backwards . This method is useful for both data and process definition.
Key Takeaways:
- A Warnier-Orr diagram (also known as a logical construction of a program/system) is a kind of hierarchical flowchart that allows the description of the organization of data and procedures.
- This method aids the design of program structures by identifying the output and processing results
References:
- Real- Time Systems Design and Analysis.. Tools for the Practitioner by Phillip A Laplante, Seppo J.Ovaska ,Wiley - 4th Edition
- Embedded Real Time Systems: Concepts, Design and Programming - Dr. K.V.K. Prasad -Black Book, Edition: 2014
- Real Time Systems Theory and Practice , Rajib Mall , Pearson Education
UNIT-2
Real Time specification and design Techniques
- Natural Languages:
- Natural languages are the languages that people speak, such as English, Spanish, and French.
- They were not designed by people (although people try to impose some order on them); they evolved naturally.
2. Formal Languages:
- Formal languages are languages that are designed by people for specific applications.
- For example, the notation that mathematicians use is a formal language that is particularly good at denoting relationships among numbers and symbols.
- Chemists use a formal language to represent the chemical structure of molecules.
3. Programming Languages:
- Programming languages are formal languages that have been designed to express computations.
Key Takeaways
- Natural Languages: Natural languages are the languages that people speak, such as English, Spanish, and French.
- Programming Languages: Programming languages are formal languages that have been designed to express computations.
- A flowchart is a picture of the separate steps of a process in sequential order.
- It is a generic tool that can be adapted for a wide variety of purposes, and can be used to describe various processes, such as a manufacturing process, an administrative or service process, or a project plan.
Flowchart Symbol | Name | Description |
| Process symbol | Also known as an “Action Symbol,” this shape represents a process, action, or function. It’s the most widely-used symbol in flowcharting. |
| Start/End symbol | Also known as the “Terminator Symbol,” this symbol represents the start points, end points, and potential outcomes of a path. Often contains “Start” or “End” within the shape. |
| Document symbol | Represents the input or output of a document, specifically. Examples of and input are receiving a report, email, or order. Examples of an output using a document symbol include generating a presentation, memo, or letter. |
| Decision symbol | indicates a question to be answered — usually yes/no or true/false. The flowchart path may then split off into different branches depending on the answer or consequences thereafter. |
| Connector symbol | Usually used within more complex charts, this symbol connects separate elements across one page. |
| Off-Page Connector/Link symbol | Frequently used within complex charts, this symbol connects separate elements across multiple pages with the page number usually placed on or within the shape for easy reference. |
| Input/Output symbol | Also referred to as the “Data Symbol,” this shape represents data that is available for input or output as well as representing resources used or generated. While the paper tape symbol also represents input/output, it is outdated and no longer in common use for flowchart diagramming. |
| Comment/Note symbol | Placed along with context, this symbol adds needed explanation or comments within the specified range. It may be connected by a dashed line to the relevant section of the flowchart as well. |
2.2.1 Structured charts
Fig.1 Structured charts |
2.2.2 Structured Charts:
- A structure chart (SC) in software engineering and organizational theory is a chart which shows the breakdown of a system to its lowest manageable levels.
- They are used in structured programming to arrange program modules into a tree.
- Each module is represented by a box, which contains the module's name.
- Structure Chart represent hierarchical structure of modules. It breaks down the entire system into lowest functional modules, describe functions and sub-functions of each module of a system to a greater detail.
- Structure Chart partitions the system into black boxes (functionality of the system is known to the users but inner details are unknown).
- Inputs are given to the black boxes and appropriate outputs are generated.
2.2.3 Modules:
- Modules at top level called modules at low level.
- Components are read from top to bottom and left to right.
- When a module calls another, it views the called module as black box, passing required parameters and receiving results.
2.2.3 Symbols used in construction of structured chart:
- Module:
It represents the process or task of the system. It is of three types.
- Control Module:
A control module branches to more than one sub module. - Sub Module:
Sub Module is a module which is the part (Child) of another module. - Library Module:
Library Module are reusable and invokable from any module.
Fig.2 |
2. Conditional Call:
It represents that control module can select any of the sub module on the basis of some condition.
Fig.3 |
3. Loop (Repetitive call of module):
It represents the repetitive execution of module by the sub module.
A curved arrow represents loop in the module.
Fig.4 |
All the sub modules cover by the loop repeat execution of module.
4. Data Flow:
It represents the flow of data between the modules. It is represented by directed arrow with empty circle at the end.
Fig.5 |
5. Control Flow:
It represents the flow of control between the modules. It is represented by directed arrow with filled circle at the end.
Fig.6 |
6. Physical Storage:
Physical Storage is that where all the information are to be stored.
Example: Structure chart for an Email server :
Fig-7 |
2.2.3.1 Types of Structure Chart:
- Transform Cantered Structured:
These type of structure chart are designed for the systems that receives an input which is transformed by a sequence of operations being carried out by one module. - Transaction Cantered Structure:
These structure describes a system that processes a number of different types of transaction.
Key Takeaways:
- A flowchart is a picture of the separate steps of a process in sequential order.
- It is a generic tool that can be adapted for a wide variety of purposes, and can be used to describe various processes, such as a manufacturing process, an administrative or service process, or a project plan.
- Program Design Language (or PDL, for short) is a method for designing and documenting methods and procedures in software.
- It is related to pseudocode, but unlike pseudocode, it is written in plain language without any terms that could suggest the use of any programming language or library.
- Pseudo code: It is a simpler version of a programming code in plain English which uses short phrases to write code for a program before it is implemented in a specific programming language.
- Program: It is exact code written for problem following all the rules of the programming language.
2.3.1 Pseudo code:
- It is one of the methods which can be used to represent an algorithm for a program.
- It does not have a specific syntax like any of the programming languages and thus cannot be executed on a computer.
- There are several formats which are used to write pseudo-codes and most of them take down the structures from languages such as C, Lisp, FORTRAN, etc.
- Many time algorithms are presented using pseudocode since they can be read and understood by programmers who are familiar with different programming languages.
- Pseudo code allows you to include several control structures such as While, If-then-else, Repeat-until, for and case, which is present in many high-level languages.
Note: Pseudo code is not an actual programming language:
- Pseudo code for Linear Search :
FUNCTION linear Search (list, search Term): FOR index FROM 0 -> length (list): IF list [index] == search Term THEN RETURN index ENDIF ENDLOOP RETURN -1 END FUNCTION |
- In here, we haven’t used any specific programming language but wrote the steps of a linear search in a simpler form which can be further modified into a proper program.
2.3.2 Program:
- A program is a set of instructions for the computer to follow.
- The machine can’t read a program directly, because it only understands machine code.
- But you can write stuff in a computer language, and then a compiler or interpreter can make it understandable to the computer.
- Program for Linear Search :
// C++ code for linearly search x in arr[]. If x // is present then return its location, otherwise // return -1 int search(int arr[], int n, int x) { int i; for (i = 0; i < n; i++) if (arr[i] == x) return i; return -1; }
|
2.3.3 Call-by-Value and Call-by-Reference:
- The two most widely found parameter passing methods are call-by-value and call-by-reference.
- In call-by-value parameter passing, the value of the actual parameter in the subroutine or function call is copied into the procedure’s formal parameter.
- Since the procedure manipulates the formal parameter, the actual parameter is not altered. This technique is useful either when a test is being performed or the output is a function of the input parameters.
- For example, in passing accelerometer readings from the 10-ms cycle to the 40-ms cycle, the raw data need not be returned to the calling routine in changed form.
- When parameters are passed using call-by-value they are copied onto a run-time stack, at additional execution time cost.
- In call-by-reference or call-by-address the address of the parameter is passed by the calling routine to the called procedure so that it can be altered there.
- Execution of a procedure using call-by-reference can take longer than one using call-by-value, since in call-by-reference indirect mode instructions are needed for any calculations involving the variables passed.
- However, in the case of passing large data structures such as buffers between procedures it is more desirable to use call-by-reference, since passing a pointer is more efficient than passing the
data by byte.
Key Takeaways:
- Program Design Language (or PDL, for short) is a method for designing and documenting methods and procedures in software.
- The two most widely found parameter passing methods are call-by-value and call-by-reference.
- In call-by-value parameter passing, the value of the actual parameter in the subroutine or function call is copied into the procedure’s formal parameter.
- Pseudo code allows you to include several control structures such as While, If-then-else, Repeat-until, for and case, which is present in many high-level languages.
- Finite Automata (FA) is the simplest machine to recognize patterns.
- The finite automata or finite state machine is abstract machines which have five elements or tuple.
- It has a set of states and rules for moving from one state to another but it depends upon the applied input symbol.
- Basically it is an abstract model of digital computer.
- Following figure shows some essential features of a general automation.
Fig.8: Features of Finite Automata |
The above figure shows following features of automata:
- Input
- Output
- States of automata
- State relation
- Output relation
A Finite Automata consists of the following:
Q: Finite set of states.
Σ: set of Input Symbols.
q: Initial state.
F: set of Final States.
δ: Transition Function.
Formal specification of machine is
{Q, Σ, q, F, δ}.
FA is characterized into two types:
2.4.1 Deterministic Finite Automata (DFA) :
- DFA consists of 5 tuples {Q, Σ, q, F, δ}.
Q : set of all states.
Σ : set of input symbols. (Symbols which machine takes as input)
q : Initial state. (Starting state of a machine)
F : set of final state.
δ : Transition Function, defined as δ : Q X Σ --> Q.
- In a DFA, for a particular input character, the machine goes to one state only. A transition function is defined on every state for every input symbol.
- Also in DFA null (or ε) move is not allowed, i.e., DFA cannot change state without any input character.
- For example, below DFA with Σ = {0, 1} accepts all strings ending with 0.
Fig.8: DFA with Σ = {0, 1}
|
- One important thing to note is, there can be many possible DFAs for a pattern. A DFA with minimum number of states is generally preferred.
2.4.2 Nondeterministic Finite Automata (NFA) :
- NFA is similar to DFA except following additional features:
1. Null (or ε) move is allowed i.e., it can move forward without reading symbols.
2. Ability to transmit to any number of states for a particular input. - However, these above features don’t add any power to NFA. If we compare both in terms of power, both are equivalent.
- Due to above additional features, NFA has a different transition function, rest is same as DFA.
δ: Transition Function
δ: Q X (Σ U ε ) --> 2 ^ Q.
- As you can see in transition function is for any input including null (or ε), NFA can go to any state number of states.
For example, below is a NFA for above problem:
Fig.9 NFA
|
- One important thing to note is, in NFA, if any path for an input string leads to a final state, then the input string accepted. For example, in above NFA, there are multiple paths for input string “00”. Since, one of the paths leads to a final state, “00” is accepted by above NFA.
2.4.3 Comparison of DFA & NFA:
- Both NFA and DFA have same power and each NFA can be translated into a DFA.
- There can be multiple final states in both DFA and NFA.
- NFA is more of a theoretical concept.
- DFA is used in Lexical Analysis in Compiler.
Key Takeaways:
- Finite Automata (FA) is the simplest machine to recognize patterns.
- The finite automata or finite state machine is abstract machines which have five elements or tuple.
- The above figure shows following features of automata:
- Input
- Output
- States of automata
- State relation
- Output relation
- Comparison of DFA & NFA:
- Both NFA and DFA have same power and each NFA can be translated into a DFA.
- There can be multiple final states in both DFA and NFA.
- NFA is more of a theoretical concept.
- DFA is used in Lexical Analysis in Compiler.
A Warnier-Orr diagram (also known as a logical construction of a program/system) is a kind of hierarchical flowchart that allows the description of the organization of data and procedures.
- They were initially developed in France by Jean-Dominique Warnier and in the United States by Kenneth Orr.
- This method aids the design of program structures by identifying the output and processing results.
- The simple graphic method used in Warnier/Orr diagrams makes the levels in the Warnier/Orr diagrams show the processes and sequences in which they are performed.
- Each process is defined in a hierarchical manner i.e. it consists of sets of sub processes that define it. At each level, the process is shown in bracket that groups its components.
- Using Warnier/Orr Diagrams To develop a Warnier/Orr diagram, the analyst works backwards, starting with and using output oriented analysis. On paper, the development moves from right to left.
- First, the intended output or results of the processing are defined.
Each step in turn is further defined. the result on the next level.
- Advantages of Warnier/Orr diagram According to Experts:
They are: Yet they are powerful design tools. that must be passed from level to level. In addition, the sequence of working backwards . This method is useful for both data and process definition.
Key Takeaways:
- A Warnier-Orr diagram (also known as a logical construction of a program/system) is a kind of hierarchical flowchart that allows the description of the organization of data and procedures.
- This method aids the design of program structures by identifying the output and processing results
References:
- Real- Time Systems Design and Analysis.. Tools for the Practitioner by Phillip A Laplante, Seppo J.Ovaska ,Wiley - 4th Edition
- Embedded Real Time Systems: Concepts, Design and Programming - Dr. K.V.K. Prasad -Black Book, Edition: 2014
- Real Time Systems Theory and Practice , Rajib Mall , Pearson Education


