UNIT–6
Graph Theory
Basic terminology-
Graph theory is a relatively new area of mathematics
Graph is the form of representing of descriptive data in the terms of verticals and edges.
Graph theory is used in various fields like computer science, information technology, genetics, telecommunication etc.
A graph is a collection of vertices and edges in which each edge is assigned to pair of points called terminal.
We can say that a graph is a network of dots connected by lines.
Mathematically we can define a graph as-
A graph is a pair of set (V, E) where-
1. V is a non-empty set whose elements are called vertices.
2. E is collection of two-element subset of V called edges.
Terminology:A graph G is an ordered pair (V, E) where V is a non-empty set and E is the set of edges in which each element of E is assigned to a unique unordered pair of elements of V.
An element of a set E is generally denoted as- e = (v,u) where u, v ∈ V.
U and v are called the end vertices of edge e.
Note- In any graph the number of vertices with odd degree must be even.
Loop: If both the end vertices of an edge are same then the edge is called a loop.
Parallel edge: If two or more edges have same terminal vertices, then these edges are called parallel edges.
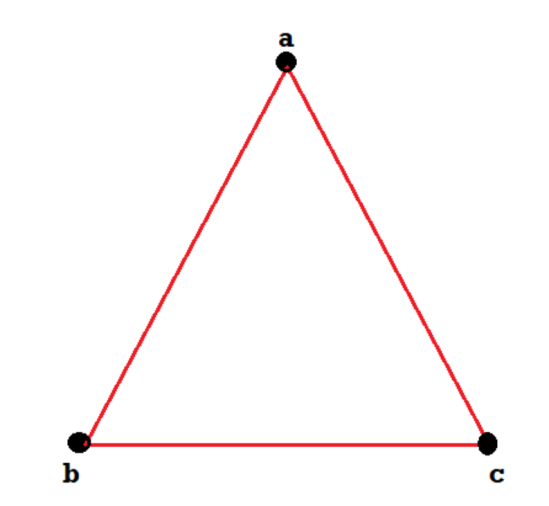
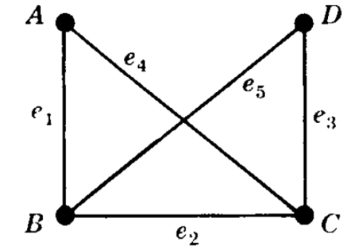
Example: Consider the graphs given below-


Check whether these graphs are same or not?
Sol.
As we can see that these graphs are not same because here  and
and  are not same since
  but a does not belongs to
  .
.
These two graphs look same but not equal.
We can draw these graphs as below-


These types of graphs are known as isomorphic graph when they are same except for the name of vertices.
Simple graph: A graph which has no loops and parallel edges is known as simple graph.
Compound graph: A graph which contains loops or parallel edges is called compound or multi-graph.
Degree of vertex: The number of edges incident on a vertex v is called degree of vertex v, with loop being counted twice.
We can denote it as-
Degree of v = d(v)
Examples of graph and multi-graph are-
Graph-

Multi-graph-

Weighted Graphs
A graph G is said to be a weighted graph if each edge e of G is assigned a non-negative number w(e) called the weight of v.
The weighted graph is given below-

Sub Graphs-
We can say that  is a sub-graph of G = (V, E), and write
  provided
 .
.
We can say that  is an induced sub-graph of G = (V, E), provided
  and every edge in E whose vertices are still in
  is also an edge in
  .
.
Isomorphic graphs-
Let  and
and  be two graphs. The graph
  and
and  are said to be isomorphic if there is a bijective function
  such that if u and v are end vertices of some edge e ∈
  then
then  end vertices of
Complete Graphs-
A simple graph G is called a complete graph, if there is an edge between each pair of vertices.
Regular Graphs-
If all vertices of a graph G have same degree, then G is called as a regular graph.
Bipartite Graphs-
A graph G(V, E) is said to be bipartite, if the vertex set V can be partitioned in to two non-empty disjoint subset  and
and  such that each edge is G had end vertex is
  and other end vertex in
There is no edge between two vertices of  as well as there is no edge between two vertices of
  .
.
Here  bipartition of V.
Applications of graph theory-
Applications in computer Science
In computer science graph theory is used for the study of algorithms like:
Dijkstra's Algorithm
Prims's Algorithm
Kruskal's Algorithm
1. Graphs are used to define the flow of computation.
2. Graphs are used to represent networks of communication.
3. Graphs are used to represent data organization.
4. Graph transformation systems work on rule-based in-memory manipulation of graphs. Graph databases ensure transaction-safe, persistent storing and querying of graph structured data.
5. Graph theory is used to find shortest path in road or a network.
6. In Google Maps, various locations are represented as vertices or nodes and the roads are represented as edges and graph theory is used to find the shortest path between two nodes.
Paths-
Let G be a non-directed graph. A sequence P of zero or more edges of the form  , where
  are the vertices of G is called a path in G.
We denote this by P
The vertex  is called the initial vertex and the vertex
  is called the terminal vertex of the path P.
Note-
1. if then the path P is called an open path and if
  then the path is called closed path.
2. If all the edges and vertices in a path P are distinct except possibly the end points then the path P is called a simple path.
Connectedness-
Let G be a graph. Two vertices v and w of G are connected if, and only if, there is a walk from v to w. The graph G is connected if, and only if, given any two vertices v and w inG, there is a walk from v to w. Symbolically,
G is connected ⇔∀vertices v,w∈V(G), ∃a walk from v to w.
We can represent a graph in matrix form in two ways-
1. Adjacent matrix
2. Incidence matrix
Adjacency matrix of a non-directed graph-
Let G be a graph with n vertices and no parallel edges. The adjacency matrix of G in a n × n. symmetric binary matrix A (G) 
Where


Where  and
and  are vertices of G.
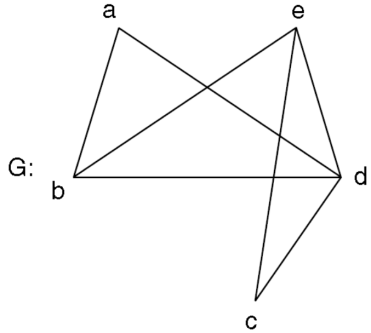
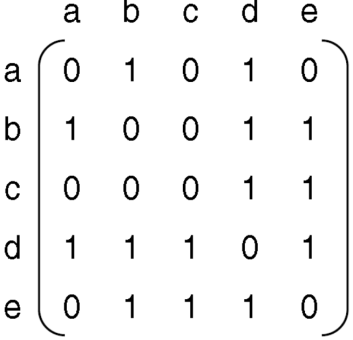
The following is a example of the adjacency matrix of the simple graph G.

Adjacency matrix x; A (G)-

Adjacency matrix of a Digraph-
Let G be a digraph with n vertices, containing non-parallel edges. The adjacency matrix A(G) of the digraph G is an n × n matrix defined by


= 0 otherwise
Example: Find the adjacency matrix of the graph-

Sol.The adjacency matrix of the above graph will be-

Incidence matrix of a non-directed graph-
Let G be a graph with n vertices and m edges. The incidence matrix denoted by X (G) is defined as the matrix X (G) is defined as the matrix


= 0, otherwise
X (G) is an n by m matrix whose n rows correspond to the n vertices, and mcolumns correspond to m edges.
Graph and its incidence matrix-

PERT stands for “Project Evaluation and Review Technique” – very typical bureaucratic doubletalk for something very simple. A PERT chart is a graph containing vertices (called events), and weighted, directed edges (called activities). The “event” represents the completion of a particular set of related tasks and all of its prerequisites – a task in complete when all of its incoming activities are completed; the edges represent individual tasks which must be performed, and are labeled with a weight that indicates how long the task takes to complete.
Program evaluation and review technique (PERT) is a technique adopted by organizations to analyze and represent the activity in a project, and to illustrate the flow of events in a project. PERT is a method to evaluate and estimate the time required to complete a task within deadlines.
1. PERT serves as an management tool to analyze, define and integrate events. 2. 2. PERT also illustrates the activities and interdependencies in a project. The main goal of PERT is to reduce the cost and time needed to complete a project.
3. PERT planning usually involves the following steps:
Identifying Tasks and Milestones: Every project involves a series of required tasks. These tasks are listed in a table allowing additional information on sequence and timing to be added later.
Placing the Tasks in a Proper Sequence: The tasks are analyzed and placed in a sequence to get the desired results.
Network Diagramming: A network diagram is drawn using the activity sequence data showing the sequence of serial and parallel activities.
Time Estimating: This is the time required to carry out each activity, in three parts:
1. Optimistic timing: The shortest time to complete an activity
2. Most likely timing: The completion time having the highest probability
3. Pessimistic timing: The longest time to complete an activity
Critical Path Estimating: This determines the total time required to complete a project.
Advantages of PERT
Here are several benefits of using PERT in project management:
It helps maximize the use of resources.
It makes project planning more manageable.
It’s useful even if there is little or no previous schedule data.
It enables project managers to better estimate or determine a more definite completion date.
Disadvantages of PERT
Like any other method, PERT comes with its share of limitations:
In complex projects, many find PERT hard to interpret, so they may also use a Gantt chart a another popular method for project management.
It can be tedious to update, modify, and maintain the PERT diagram.
It entails a subjective time analysis of activities and, for those who are less experienced or are biased, this may affect the project’s schedule.