Unit – 3
Software Design
3.1 Objective- software design
Software design is a process where software requirements are analysed in order to produce a description of the internal structure and organization of the system that serves as a basis for its construction (coding).
IEEE defines software design as “both a process of defining the architecture, components, interfaces, and other characteristics of a system or component and the result of that process”. During software design phase, many critical and strategic decisions are implemented to meet the required functional and quality requirements of a system. These decisions are taken into account to successfully develop the software.
Objectives of Software Design:
Data oriented software design
A data-centered architecture has two distinct components:
The client software accesses the data independentof any changes to the data or the actions of other client software. In this architectural style, existing components can be deleted and new clients can be added to the architecture without affecting the overall architecture. This is because clientcomponents operate independently.
Structured design is an approach based on ‘divide and conquer’ strategy where a problem is divided into several sub problems and each small problem is individually solved until the whole problem is solved. The small parts of problem are solved by means of different solution modules. Structured design emphasis on modular programming to achieve a precise ordered solution.
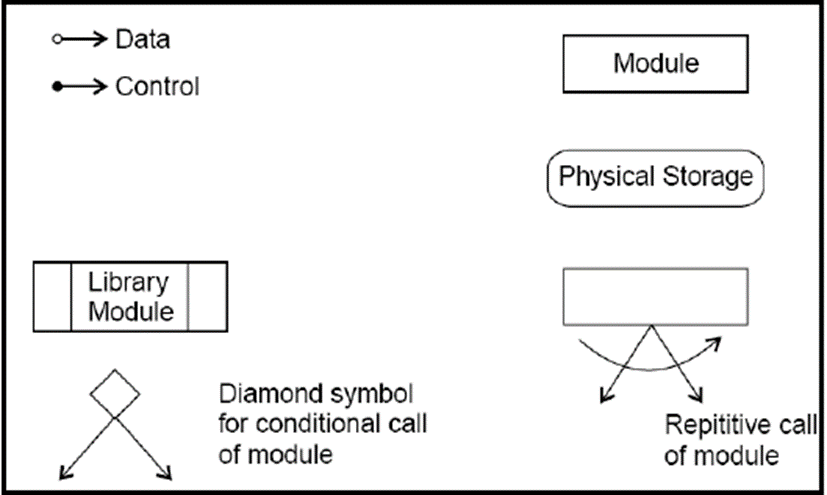
Structure chart represents hierarchical structure of modular programming. At each layer a specific task is performed. In figure below symbols are given which are used in construction of structure charts.
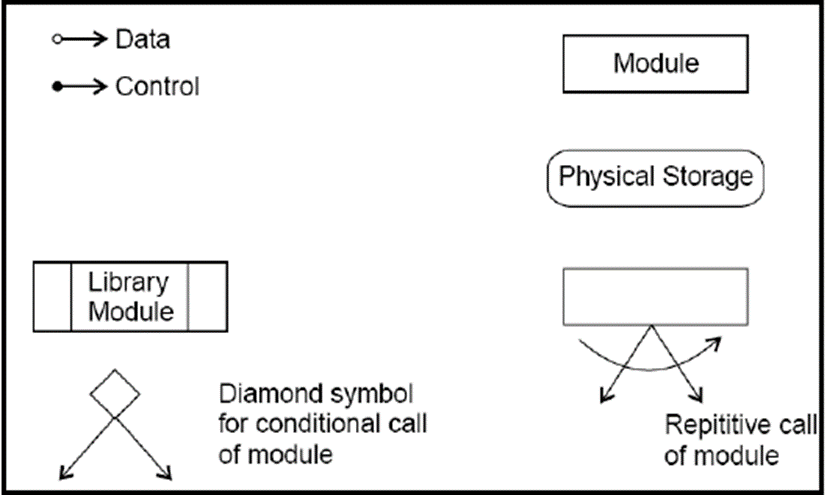
These modules are arranged in hierarchy as communicate with each other. A structured design can further be explored as namely -
Cohesion - grouping of all functionally related elements.
Coupling - communication between different modules.
Module - It represents process or subroutine or sub-task. A control module branches to more than one sub-module. Library Modules are re-usable and invokable from any module.
Coupling & Cohesion
In modular design when modules can function completely without the interaction of other module, they are called independent. As they are separable and modifiable individually. Though, all modules in a system cannot be independent of each other.
Coupling is measure of strength of interconnections between modules or a measure of interdependence between the modules. When modules are strongly connected, they are called highly coupled. On the other hand when modules have weak interconnections, they are "loosely coupled".
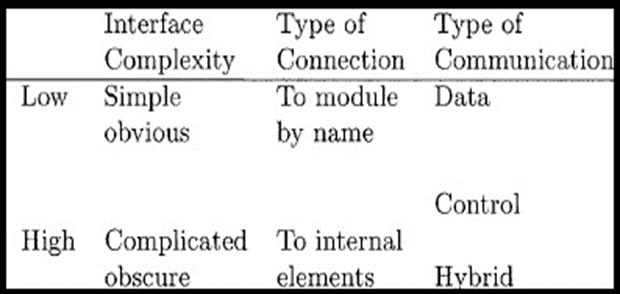
Figure : Factors affecting coupling
The more complex each interface is, the higher will be the degree of coupling.
Example: complexity of the entry interface of a procedure depends on the number of items being passed as parameters and on the complexity of the items.
Module coupling is categorized into the following types.
• No direct coupling: Two modules are no direct coupled when they are independent of each other. In Figure below, Module 1 and Module 2 are no directly coupled.
• Data coupling: Two modules are data coupled if they communicate by passing parameters. In Figure below, Module 1 and Module 3 are data coupled.
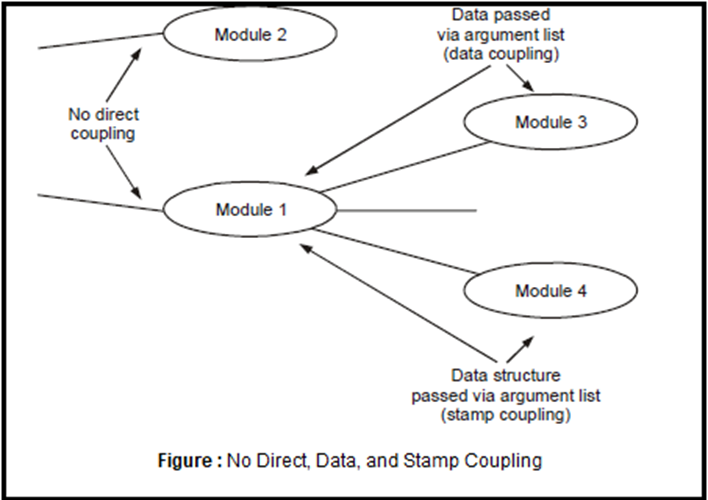
Stamp coupling: Two modules are stamp coupled if they communicate through a passed data structure that contains more information than necessary for them to perform their functions. In Figure below data structure is passed between modules 1 and 4.Therefore, Module 1 and Module 4 are stamp coupled.
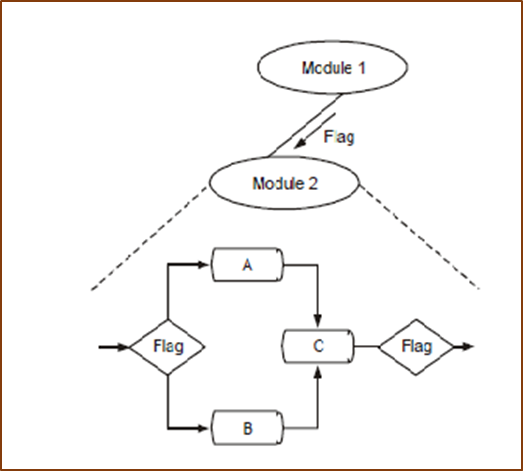
Control coupling: Two modules are control coupled if they communicate (passes a piece of information intended to control the internal logic) using at least one ‘control flag’. The control flag is a variable that controls decisions in subordinate or superior modules. In Figure 4.12, when Module 1 passes control flag to Module 2, Module 1 and Module 2 are said to be control coupled. Control coupling is shown below.
Content coupling: Two modules are content coupled if one module changes a statement in another module, one module references or alters data contained inside another module,or one-module branches into another module. In Figure 4.13, Modules B and Module D are content coupled.
Common coupling: Two modules are common coupled if they both share the same global data area. In Figure below Modules C and Module N are common coupled.
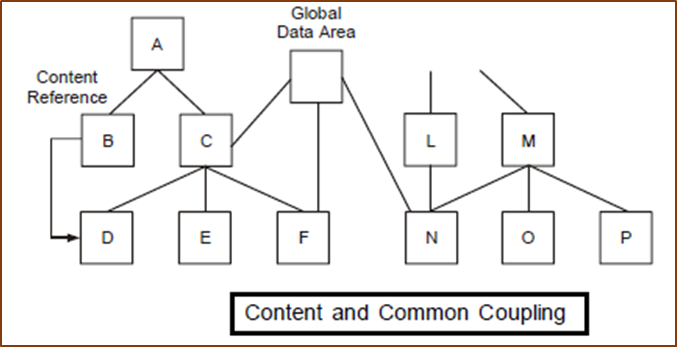
Cohesion of a module is how strongly the internal components of a module are bounded to each other. Relation between cohesion and coupling is like this greater the cohesion of each module, lower the coupling between modules.
Coupling is inter modules (between the modules) and cohesion is intra modules (within a module).
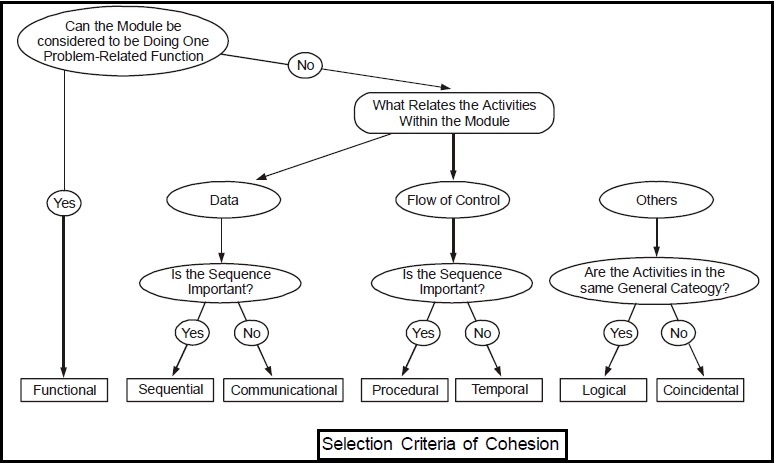
Several levels of cohesion:
• Coincidental (lowest)
• Logical
• Temporal
• Procedural
• Communicational
• Sequential
• Functional
Structured analysis uses DFD which is “a diagram that depicts data sources, data sinks, data storage, and processes performed on data as nodes, and logical flow of data as links between the nodes”.
DFD depictsflow of data from one or more processes to another and some other objectives are:
• Represents system data in hierarchical manner and with required level of detail.
• Depicts processes according to defined user requirements and software scope.
DFD depicts the flow of data within a system and considers a system that transforms inputs into the required outputs. When there is complexity in a system, data needs to be transformed by using various steps to produce an output. These steps are required to refine the information.
The objective of DFD is to provide an overview of the transformations that occur to the input data within the system in order to produce an output.
DFD are not same as flowchart. A DFD represents the flow of data whereas flowchart depicts the flow of control. Also, a DFD does not depict the information aboutthe procedure to be used for accomplishing the task. Hence, while making DFD, procedural details about the processes should not be shown. DFD helps a software designer to describe the transformations taking place in the path of data from input to output
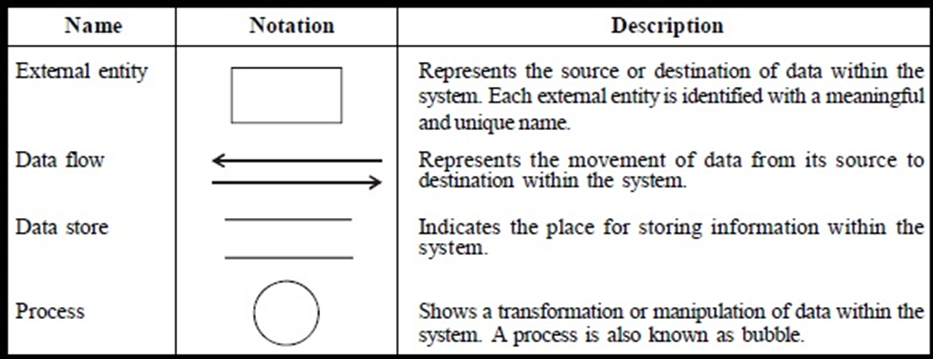
DFD comprises of four basic notations (symbols), listed in Table below:
These levels are listed below:
• Level 0 DFD (also known as context diagram): Shows an overall view of the system.
• Level 1 DFD: Elaborates level 0 DFD and splits the process into a detailed form.
• Level 2 DFD: Elaborates level 1 DFD and displays the process(s) in a more detailed form.
• Level 3 DFD: Elaborates level 2 DFD and displays the process(s) in a detailed form.
Structured Design is diagrammatic notation to help people understand the system. The basic goal of Structured Designis to improve quality and reduce the risk of System failure. It establishes concrete management specification and documentation. It focuses on solidity, pliability and maintainability of system.
Basically the approach of Structured Designis based on the Data Flow Diagram. It is easy to understand Structured Designbut it focuses on well-defined system boundary whereas Structured Design approach is too complex and does not have any graphical representation.
Structured Designis combined known as SAD and it mainly focuses on following 3 points:
Structured Design involves 2 phases:
Analysis Phase:
Analysis Phase involves data flow diagram, data dictionary, state transition diagram and entity relationship diagram.
Data Flow Diagram:
Data flow diagram model describe how the data flows through the system. We can incorporate the Boolean operators and & or to link data flows when more than one data flow may be input or output from a process.For example, if we have to choose between two paths of a process we can add an operator or and if two data flows are necessary for a process we can add and operator. The input of the process “check-order” needs the credit information and order information whereas the output of the process would be a cash-order or a good-credit-order.
Data Dictionary:
The content that are not described in the DFD are described in data dictionary. It defines the data store and relevant meaning. A physical data dictionary for data elements which flow between processes, between entities, and between processes and entities may be included. This would also include descriptions of data elements that flow external to the data stores.
A logical data dictionary may also be included for each such data element. All system names, whether they are names of entities, types, relations, attributes or services, should be entered in the dictionary.
State Transition Diagram:
State transition diagram is similar to dynamic model. It specifies how much time function will take to execute and data access triggered by events. It also describes all of the states that an object can have, the events under which an object changes state, the conditions that must be fulfilled before the transition will occur and the activities undertaken during the life of an object.
ER Diagram:
ER diagram specifies the relationship between data store. It is basically used in database design. It basically describes the relationship between different entities.
Design Phase:
Design Phase involves structure chart and pseudo code.
Structure chart:
It is created by the data flow diagram. Structure Chart specifies how DFS’s processes are grouped into task and allocate to CPU.The structured chart does not show the working and internal structure of the processes or modules, and does not show the relationship between data or data-flows. Similar to other structured design tools, it is time and cost independent and there is no error-checking technique associated with this tool.
The modules of a structured chart are arranged arbitrarily and any process from a DFD can be chosen as the central transform depending on the analysts’ own perception. The structured chart is difficult to amend, verify, maintain, and check for completeness and consistency.
It breaks down a system into block boxes. A black box means that functionality is known to the user without the knowledge of internal design.
Pseudo Code:
It is actual implementation of system.It is a informal way of programming which doesn’t require any specific programming language or technology.
To design a system in structured way, there are two possible approaches:
a) Top-down Approach
b) Bottom-up Approach
Top-down Approach: this approach begins with identification of the main components and then decomposing them into their more detailed sub-components.
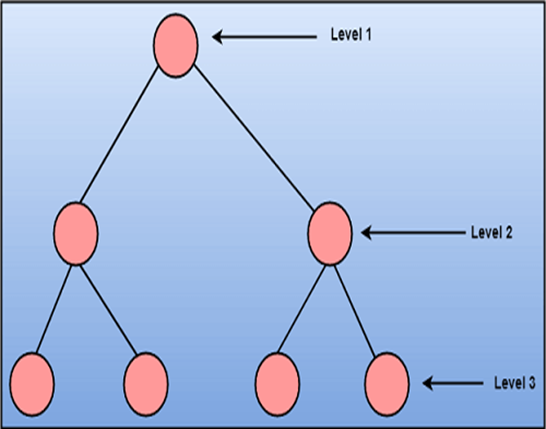
Figure: Top down
Bottom-up Approach: bottom-up approach starts with the lower details and moves towards up the hierarchy, as shown in fig. This approach is suitable in case of an existing system.
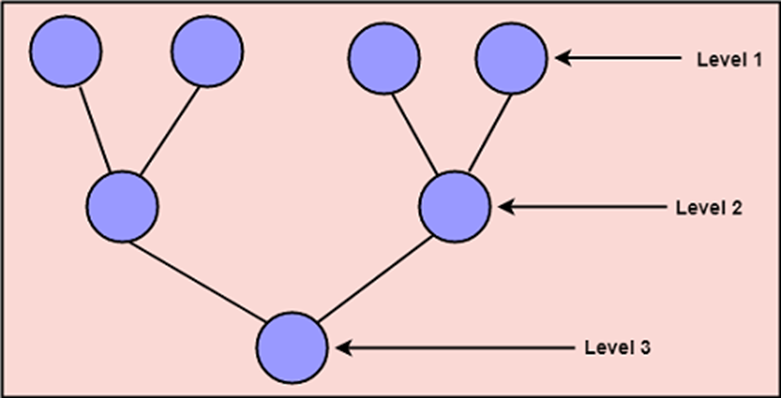
Figure: bottom up
Object-oriented design
In the object-oriented design consider system as a collection of objects (i.e., entities -real world object). Class is made which is a prototype of an object. Objects belonging to same class have same data and functions.
Elements of object oriented design
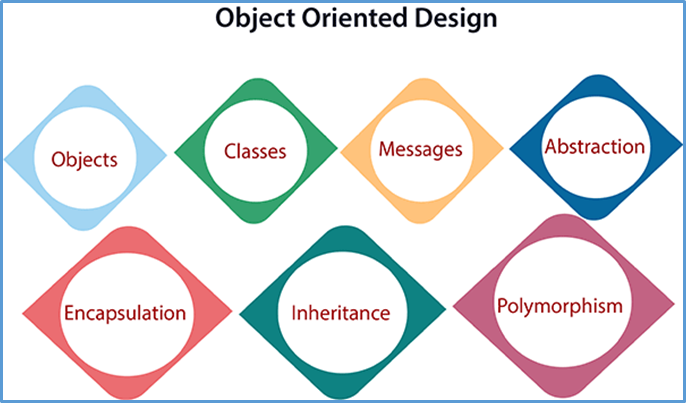
a) Objects: real world entities are object having attributes associated with it and has some methods to be perform on the attributes.
b) Classes: A class is a generalized blue print of an object. An object is an instance of a class.
c) Messages: Objects communicate by message passing.
d) Abstraction: To reduce complexity abstraction is used. it is the removal of irrelevant and the amplification of the essentials.
e) Encapsulation: Encapsulation is also called an information hiding concept. The data and operations are linked to a single unit.
f) Inheritance: inheritance is a process of reusing old data by using concept of inheritance through which an object acquires the property of another object.
g) Polymorphism: it enables using of similar function and methods name to be used with a small distinction in argument passing.
Design Verification is a method to confirm if the output of a designed software product meets the input specifications by examining and providing evidence. The goal of the design verification process during software development is ensuring that the designed software product is the same as specified.
Design input is any physical and performance requirement that is used as the basis for designing purpose.
Design output is the result of each design phase and at the end of total design effort. The final design output is a basis for device master record.
DesignVerification Process
Identification and preparation: During the development stage of a specification, the identification of verification activity is done parallel. This enables the designer to make sure that the specification is verifiable. So a test engineer can start detailed test plan and procedures. Any changes in the specification should be communicated.
Planning: Planning for verification is a concurrent activity with core and development teams. This occurs throughout the project life cycle. This will be updated as and when any changes are made to design inputs.
Developing: The test case development will coincide with SDLC methodology implemented by a project team. A variety of test methods are identified during this stage.
Execution: The test procedures created during the development phase is executed in accordance with the test plan, strictly following them in verification activity.
Reports: This activity is performed at the end of each phase of verification execution.
Design Validation Process
Some of the designs may be validated by comparing with similar equipment performing similar purpose. This method is particularly relevant for validating configuration changes for existing infrastructure, or standard designs that are to be incorporated in a new system or application.
Demonstration and/or inspection may be used to validate requirements and other functionality of the product.
Analyzing the design can be done such as mathematical modeling, a simulation which can recreate the required functionality.
Tests are performed on the final design that validates the ability of the system to operate as per the specified design.
Test plan, execution, and results should be documented and maintained as a part of design records. Thus, Validation is a collection of the results of all validation activities.
When equivalent products are used in the final design validation, the manufacturer must document the similarity and if any difference from initial production.
Example of a simple product, a waterproof watch.
The product requirement document might state that "The watch must be waterproof during swimming."
The design specification might state "The watch should function even if the user swims for a prolonged time."
The testing results should confirm that the watch should meet these requirements else the redesign iterations are done until it satisfies the requirement.
A software metric is a measure of software characteristics which are measurable or countable. Software metrics are valuable for many reasons, including measuring software performance, planning work items, measuring productivity, and many other uses.
Within the software development process, many metrics are that are all connected. Software metrics are similar to the four functions of management: Planning, Organization, Control, or Improvement.
Classification of Software Metrics
1. Product Metrics: These are the measures of various characteristics of the software product. The two important software characteristics are:
These metrics can be computed for different stages of SDLC.
2. Process Metrics: These are the measures of various characteristics of the software development process. For example, the efficiency of fault detection. They are used to measure the characteristics of methods, techniques, and tools that are used for developing software.
Types of Metrics
Internal metrics: Internal metrics are the metrics used for measuring properties that are viewed to be of greater importance to a software developer. For example, Lines of Code (LOC) measure.
External metrics: External metrics are the metrics used for measuring properties that are viewed to be of greater importance to the user, e.g., portability, reliability, functionality, usability, etc.
Hybrid metrics: Hybrid metrics are the metrics that combine product, process, and resource metrics. For example, cost per FP where FP stands for Function Point Metric.
Project metrics: Project metrics are the metrics used by the project manager to check the project's progress. Data from the past projects are used to collect various metrics, like time and cost; these estimates are used as a base of new software. These metrics are used to decrease the development costs, time efforts and risks. The project quality can also be improved. As quality improves, the number of errors and time, as well as cost required, is also reduced.